

Chiou and Youngs PEER-NGA Empirical Ground Motion Model for ...
Chiou and Youngs PEER-NGA Empirical Ground Motion Model for ...
Chiou and Youngs PEER-NGA Empirical Ground Motion Model for ...

You also want an ePaper? Increase the reach of your titles
YUMPU automatically turns print PDFs into web optimized ePapers that Google loves.
1<br />
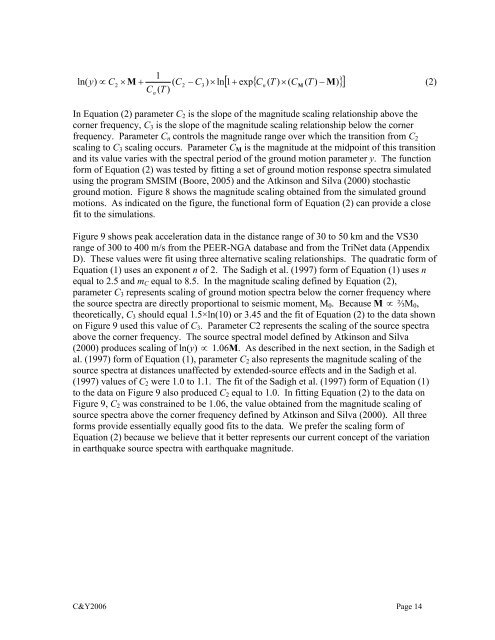
) ∝ C2<br />
× M + ( C2<br />
− C ) × ln<br />
M T −<br />
C ( T )<br />
ln( y 3<br />
n<br />
n<br />
[ 1+<br />
exp{<br />
C ( T ) × ( C ( ) M)<br />
} ]<br />
In Equation (2) parameter C2 is the slope of the magnitude scaling relationship above the<br />
corner frequency, C3 is the slope of the magnitude scaling relationship below the corner<br />
frequency. Parameter Cn controls the magnitude range over which the transition from C2<br />
scaling to C3 scaling occurs. Parameter CM is the magnitude at the midpoint of this transition<br />
<strong>and</strong> its value varies with the spectral period of the ground motion parameter y. The function<br />
<strong>for</strong>m of Equation (2) was tested by fitting a set of ground motion response spectra simulated<br />
using the program SMSIM (Boore, 2005) <strong>and</strong> the Atkinson <strong>and</strong> Silva (2000) stochastic<br />
ground motion. Figure 8 shows the magnitude scaling obtained from the simulated ground<br />
motions. As indicated on the figure, the functional <strong>for</strong>m of Equation (2) can provide a close<br />
fit to the simulations.<br />
Figure 9 shows peak acceleration data in the distance range of 30 to 50 km <strong>and</strong> the VS30<br />
range of 300 to 400 m/s from the <strong>PEER</strong>-<strong>NGA</strong> database <strong>and</strong> from the TriNet data (Appendix<br />
D). These values were fit using three alternative scaling relationships. The quadratic <strong>for</strong>m of<br />
Equation (1) uses an exponent n of 2. The Sadigh et al. (1997) <strong>for</strong>m of Equation (1) uses n<br />
equal to 2.5 <strong>and</strong> mC equal to 8.5. In the magnitude scaling defined by Equation (2),<br />
parameter C3 represents scaling of ground motion spectra below the corner frequency where<br />
the source spectra are directly proportional to seismic moment, M0. Because M ∝ ⅔M0,<br />
theoretically, C3 should equal 1.5×ln(10) or 3.45 <strong>and</strong> the fit of Equation (2) to the data shown<br />
on Figure 9 used this value of C3. Parameter C2 represents the scaling of the source spectra<br />
above the corner frequency. The source spectral model defined by Atkinson <strong>and</strong> Silva<br />
(2000) produces scaling of ln(y) ∝ 1.06M. As described in the next section, in the Sadigh et<br />
al. (1997) <strong>for</strong>m of Equation (1), parameter C2 also represents the magnitude scaling of the<br />
source spectra at distances unaffected by extended-source effects <strong>and</strong> in the Sadigh et al.<br />
(1997) values of C2 were 1.0 to 1.1. The fit of the Sadigh et al. (1997) <strong>for</strong>m of Equation (1)<br />
to the data on Figure 9 also produced C2 equal to 1.0. In fitting Equation (2) to the data on<br />
Figure 9, C2 was constrained to be 1.06, the value obtained from the magnitude scaling of<br />
source spectra above the corner frequency defined by Atkinson <strong>and</strong> Silva (2000). All three<br />
<strong>for</strong>ms provide essentially equally good fits to the data. We prefer the scaling <strong>for</strong>m of<br />
Equation (2) because we believe that it better represents our current concept of the variation<br />
in earthquake source spectra with earthquake magnitude.<br />
C&Y2006 Page 14<br />
(2)


