The reopening of a collapsed fluid-filled elastic tube - School of ...
The reopening of a collapsed fluid-filled elastic tube - School of ...
The reopening of a collapsed fluid-filled elastic tube - School of ...

You also want an ePaper? Increase the reach of your titles
YUMPU automatically turns print PDFs into web optimized ePapers that Google loves.
302 A. Juel and A. Heap<br />
(a)<br />
Ca = 0.5<br />
(b)<br />
Ca = 1.7<br />
(c)<br />
Ca = 2.5<br />
(d)<br />
Ca = 3.9<br />
(e)<br />
Ca = 5.0<br />
l<br />
θ<br />
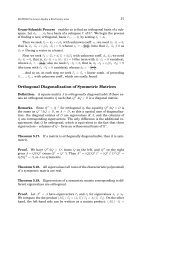
Figure 13. A series <strong>of</strong> side-view snapshots <strong>of</strong> <strong>reopening</strong> <strong>tube</strong>s <strong>filled</strong> with 200 cS oil, for<br />
increasing capillary numbers between Ca =0.5 and5.0. <strong>The</strong> horizontal solid lines in (a) and<br />
(c) denote the horizontal mid-plane far ahead <strong>of</strong> the finger tip and illustrate the asymmetry<br />
in the <strong>reopening</strong> <strong>tube</strong>. <strong>The</strong> outline <strong>of</strong> each <strong>tube</strong> is digitally traced (the white solid lines), in<br />
order to extract quantitative measures from the images: δ, the height <strong>of</strong> the reopened <strong>tube</strong>; θ,<br />
the upper-surface <strong>reopening</strong> angle; l, the length <strong>of</strong> <strong>tube</strong> which has lifted <strong>of</strong>f the bottom rigid<br />
support, as shown in (e). <strong>The</strong> height <strong>of</strong> each snapshot is 10.9 mm.<br />
marks the transition between the ‘pushing’ regime, where the pressure decreases with<br />
Ca and the air finger displaces a plug <strong>of</strong> <strong>fluid</strong> ahead <strong>of</strong> its tip, and the ‘peeling’ regime,<br />
where the pressure increases with Ca (Hazel & Heil 2003). <strong>The</strong> minimum pressure<br />
predicted by the computations remains approximately constant, at between −85.3 and<br />
−83.5 for increasing Re/Ca, which is smaller than the experimental minimum pressure<br />
by a factor <strong>of</strong> approximately 1.7. In the limit <strong>of</strong> small σ , the numerical calculations <strong>of</strong><br />
Hazel & Heil (2003) showed that the <strong>reopening</strong> pressure varies significantly with σ .<br />
<strong>The</strong> effect <strong>of</strong> the experimental error in σ =(3.6 ± 0.2) × 10 −2 was assessed by performing<br />
calculations for the maximum and minimum experimental values <strong>of</strong> σ respectively.<br />
<strong>The</strong> resulting numerical pressure curves are shifted up and down by approximately six<br />
units on the capillary scale, which is insufficient to explain the discrepancy between<br />
the experimental and numerical pressures. <strong>The</strong> results <strong>of</strong> Jensen et al. (2002), however,<br />
show that at small Ca the pressure <strong>of</strong> a bubble <strong>reopening</strong> a channel asymmetrically is<br />
a factor <strong>of</strong> approximately 1.6 larger than in the symmetric configuration. This increase<br />
in the <strong>reopening</strong> pressure is likely to be due to the reduced radius <strong>of</strong> curvature at<br />
the interface, which in turn increases the pressure difference, causing adhesion. In the<br />
present experiments, we also observed asymmetric <strong>reopening</strong> configurations which<br />
arise owing to the coupling <strong>of</strong> gravity with <strong>elastic</strong> forces, which determines the <strong>tube</strong>’s<br />
overall shape, as discussed in § 3.2. Thus, we speculate that the quantitative difference<br />
between the experimental and numerical <strong>reopening</strong> pressures originates in the gravityinduced<br />
asymmetric <strong>reopening</strong> configurations observed experimentally (see figure 13).<br />
Also, the increasing length <strong>of</strong> the transition region between the <strong>collapsed</strong> and<br />
reopened regions <strong>of</strong> the <strong>tube</strong>, visible in figure 13 for decreasing Ca, is suggestive<br />
<strong>of</strong> the existence <strong>of</strong> a ‘pushing’ regime in the experiments. For Re/Ca =8.2, where<br />
detailed data was sampled in the limit <strong>of</strong> small Ca, the saturation <strong>of</strong> the pressure<br />
for small Ca could further indicate the vicinity <strong>of</strong> a ‘pushing’ branch. <strong>The</strong> recent<br />
δ