A Hierarchical Bayes Approach to System Reliability Analysis
A Hierarchical Bayes Approach to System Reliability Analysis
A Hierarchical Bayes Approach to System Reliability Analysis

You also want an ePaper? Increase the reach of your titles
YUMPU automatically turns print PDFs into web optimized ePapers that Google loves.
SANDIA REPORT<br />
SAND 2001-3513<br />
Unlimited Release<br />
Printed November 2001<br />
A <strong>Hierarchical</strong> <strong>Bayes</strong> <strong>Approach</strong><br />
<strong>to</strong> <strong>System</strong> <strong>Reliability</strong> <strong>Analysis</strong><br />
David G. Robinson<br />
Prepared by<br />
Sandia National Labora<strong>to</strong>ries<br />
Albuquerque, New Mexico 87185 and Livermore, California 94550<br />
Sandia is a multiprogram labora<strong>to</strong>ry operated by Sandia Corporation,<br />
a Lockheed Martin Company, for the United States Department of<br />
Energy under Contract DE-AC04-94AL85000.<br />
Approved for public release; further dissemination unlimited.
SAND 2001-3513<br />
Unlimited Release<br />
Printed November 2001<br />
A <strong>Hierarchical</strong> <strong>Bayes</strong> <strong>Approach</strong><br />
<strong>to</strong> <strong>System</strong> <strong>Reliability</strong> <strong>Analysis</strong><br />
David G. Robinson, PhD<br />
Risk and <strong>Reliability</strong> Department<br />
P.O. Box 5800, MS 0748<br />
Sandia National Labora<strong>to</strong>ries<br />
Albuquerque, NM 87185-0748<br />
drobin@sandia.gov<br />
Abstract<br />
The Comprehensive Test Ban Treaty of 1996 banned any future nuclear explosions or testing of nuclear<br />
weapons and created the CTBTO in Vienna <strong>to</strong> implement the treaty. The U.S. response <strong>to</strong> this was the<br />
cessation of all above and below ground nuclear testing. As such, all s<strong>to</strong>ckpile reliability assessments are<br />
now based on periodic testing of subsystems being s<strong>to</strong>red in a wide variety of environments.<br />
This data provides a wealth of information and feeds a growing web of deterministic, physics-based<br />
computer models for assessment of s<strong>to</strong>ckpile reliability. Unfortunately until 1996 it was difficult <strong>to</strong> relate<br />
the deterministic materials aging test data <strong>to</strong> component reliability. Since that time we have made great<br />
strides in mathematical techniques and computer <strong>to</strong>ols that permit explicit relationships between materials<br />
degradation, e.g. corrosion, thermo -mechanical fatigue, and reliability. The resulting suite of <strong>to</strong>ols is<br />
known as CRAX and the mathematical library supporting these <strong>to</strong>ols is Cassandra.<br />
However, these techniques ignore the his<strong>to</strong>rical data that is also available on similar systems in the nuclear<br />
s<strong>to</strong>ckpile, the DoD weapons complex and even in commercial applications. Traditional statistical<br />
techniques commonly used in classical re liability assessment do not permit data from these sources <strong>to</strong> be<br />
easily included in the overall assessment of system reliability. An older, alternative approach based on<br />
<strong>Bayes</strong>ian probability theory permits the inclusion of data from all applicable sources. Data from a variety<br />
of sources is brought <strong>to</strong>gether in a logical fashion through the repeated application of inductive<br />
mathematics.<br />
This research brings <strong>to</strong>gether existing mathematical methods, modifies and expands those techniques as<br />
required, permitting data from a wide variety of sources <strong>to</strong> be combined in a logical fashion <strong>to</strong> increase the<br />
confidence in the reliability assessment of the nuclear weapons s<strong>to</strong>ckpile.<br />
The application of this research is limited <strong>to</strong> those systems composed of discrete components, e.g. those<br />
that can be characterized as operating or not operating. However, there is nothing unique about the<br />
underlying principles and the extension <strong>to</strong> continuous subsystem/systems is straightforward. The<br />
framework is also laid for the consideration of systems with multiple correlated failure modes. While an<br />
important consideration, time and resources limited the specific demonstration of these methods.
Contents<br />
A <strong>Hierarchical</strong> <strong>Bayes</strong> <strong>Approach</strong> <strong>to</strong> <strong>System</strong> <strong>Reliability</strong> <strong>Analysis</strong>......................................i<br />
Contents ................................................................................................................................................................... i<br />
Figures....................................................................................................................................................................iii<br />
Tables .....................................................................................................................................................................iii<br />
A <strong>Hierarchical</strong> <strong>Bayes</strong> <strong>Approach</strong> <strong>to</strong> <strong>System</strong> <strong>Reliability</strong> <strong>Analysis</strong>..................................... 1<br />
Abstract........................................................................................................................... 1<br />
Background ..................................................................................................................... 1<br />
Problem................................................................................................................................................................... 1<br />
Solution <strong>Approach</strong>................................................................................................................................................ 2<br />
Why <strong>Bayes</strong> Methods for S<strong>to</strong>ckpile Assessment?............................................................... 2<br />
Current <strong>Approach</strong>.................................................................................................................................................. 3<br />
Assumptions (see Figure 1)............................................................................................................................ 3<br />
Selection of Sample ......................................................................................................................................... 4<br />
Observation of Defects ................................................................................................................................... 4<br />
Alternative approach............................................................................................................................................. 6<br />
Assumptions..................................................................................................................................................... 6<br />
Observation of Defects ................................................................................................................................... 7<br />
Summary ................................................................................................................................................................. 8<br />
Alternative <strong>Bayes</strong>ian Techniques..................................................................................... 8<br />
Empirical <strong>Bayes</strong> .................................................................................................................................................... 8<br />
Example ............................................................................................................................................................. 9<br />
<strong>Hierarchical</strong> <strong>Bayes</strong> ................................................................................................................................................ 9<br />
Example revisited .......................................................................................................................................... 10<br />
Graphical Representation of <strong>Hierarchical</strong> Models ........................................................................................ 11<br />
Markov Chain Monte Carlo Methods ............................................................................ 12<br />
Metropolis -Hastings........................................................................................................................................... 13<br />
Gibbs Sampling ................................................................................................................................................... 15<br />
Full Conditional Distribution............................................................................................................................ 17<br />
Exchangeability ................................................................................................................................................... 18<br />
<strong>Bayes</strong>ian <strong>System</strong> <strong>Reliability</strong> <strong>Analysis</strong>............................................................................. 18<br />
<strong>System</strong> Level <strong>Analysis</strong> ....................................................................................................................................... 18<br />
<strong>System</strong> Definition .......................................................................................................................................... 19<br />
Coherence........................................................................................................................................................ 19<br />
<strong>Reliability</strong>........................................................................................................................................................ 19<br />
Aggregation of <strong>System</strong>/Component Data ....................................................................................................... 20<br />
Caution Regarding Aggregation.................................................................................................................. 20<br />
<strong>Reliability</strong> Simulation Using MCMC ............................................................................. 20<br />
Component Level <strong>Analysis</strong> ............................................................................................................................... 20<br />
Prior distribution – Example 1..................................................................................................................... 21<br />
Prior distribution – Example 2..................................................................................................................... 22<br />
Component Data ............................................................................................................................................ 22<br />
Construction of Full Conditional Distributions (without system level test data)............................... 22<br />
Simulation ....................................................................................................................................................... 23<br />
Example ........................................................................................................................................................... 24<br />
Stationarity...................................................................................................................................................... 26<br />
<strong>System</strong> Level <strong>Analysis</strong> with Component Data............................................................................................... 26<br />
Independent Failure Modes.......................................................................................................................... 26<br />
<strong>System</strong> and Component Data Aggregation..................................................................................................... 28<br />
SAND 2001-3513 i
Example ........................................................................................................................................................... 29<br />
Correlated <strong>System</strong> Failure Modes .................................................................................................................... 31<br />
Expert Elicitation <strong>to</strong> Construct Similarity Relationships........................................................................ 33<br />
Discussion ............................................................................................................................................................ 33<br />
Summary ....................................................................................................................... 33<br />
References...................................................................................................................... 34<br />
Appendix A. Function Definitions .................................................................................. 36<br />
Appendix B. Monte Carlo Sampling .............................................................................. 37<br />
Monte Carlo Sampling................................................................................................... 37<br />
Random Number Generation ............................................................................................................................ 37<br />
Inversion.......................................................................................................................................................... 37<br />
Transformation............................................................................................................................................... 38<br />
Acceptance-Rejection Sampling ................................................................................................................. 39<br />
SAND 2001-3513 ii
Figures<br />
Figure 1. Sample Parameters........................................................................................................................................3<br />
Figure 2. Probability Density Functions of Defect Rates........................................................................................6<br />
Figure 3. Interference Example of <strong>Hierarchical</strong> <strong>Bayes</strong>.........................................................................................12<br />
Figure 4.a-b Metropolis-Hastings Sample His<strong>to</strong>ry.................................................................................................15<br />
Figure 4.c Metropolis-Hastings Results....................................................................................................................15<br />
Figure 5.a-b Results for Example 1 of the Gibbs Sampler....................................................................................17<br />
Figure 6. Failure Data Processing Options............................................................................................................20<br />
Figure 7.a Prior Family ...............................................................................................................................................21<br />
Figure 7.b Hyperprior Family....................................................................................................................................21<br />
Figure 8. DAG for Example 1 ....................................................................................................................................21<br />
Figure 9. Component DAG for Example 2 ...............................................................................................................22<br />
Figure 10.a-b Results for Component <strong>Reliability</strong> Example....................................................................................25<br />
Figure 10.c-d Results for Component <strong>Reliability</strong> Example...................................................................................25<br />
Figure 11.a-b Results Using Extreme Initial Values...............................................................................................26<br />
Figure 12. Simple <strong>System</strong>............................................................................................................................................26<br />
Figure 13.a-b Results for Components 1 and 2......................................................................................................27<br />
Figure 13.c-d Results for Components 3 and 4........................................................................................................28<br />
Figure 14.a-b Results for <strong>System</strong> Level Analyses.....................................................................................................28<br />
Figure 15. Elements of Component His<strong>to</strong>gram.......................................................................................................29<br />
Figure 16. Typical Component <strong>Reliability</strong> Prior....................................................................................................29<br />
Figure 17. Typical Parameter Prior Density Functions........................................................................................30<br />
Figure 18. Typical <strong>System</strong> <strong>Reliability</strong>.......................................................................................................................30<br />
Figure 19. Typical Component Reliabilities – Case 6 ...........................................................................................31<br />
Figure 19. Typical <strong>System</strong> Reliabilities – Case 5 and Case 6 ..............................................................................31<br />
Figure B.1. Rejection Sampling..................................................................................................................................39<br />
Tables<br />
Table 1 Summary of Results for a Random Sample of 11.........................................................................................6<br />
Table 2. . Summary of Results for a Targeted Samples.............................................................................................6<br />
Table 3. Summary of Results for a Targeted Samples Using Alternative Methodology......................................8<br />
Table 4. Empirical <strong>Bayes</strong> Example...............................................................................................................................9<br />
Table 5. First and Second Stage Parameters...........................................................................................................27<br />
Table 6. Results of 9 Sample Cases ...........................................................................................................................30<br />
SAND 2001-3513 iii
A <strong>Hierarchical</strong> <strong>Bayes</strong> <strong>Approach</strong><br />
<strong>to</strong> <strong>System</strong> <strong>Reliability</strong> <strong>Analysis</strong><br />
Abstract<br />
The Comprehensive Test Ban Treaty of 1996 banned any future nuclear explosions or<br />
testing of nuclear weapons and created the CTBTO in Vienna <strong>to</strong> implement the treaty.<br />
The U.S. response <strong>to</strong> this was the cessation of all above and below ground nuclear<br />
testing. As such, all s<strong>to</strong>ckpile reliability assessments are now based on periodic testing of<br />
subsystems being s<strong>to</strong>red in a wide variety of environments.<br />
This data provides a wealth of information and feeds a growing web of deterministic,<br />
physics-based computer models for assessment of s<strong>to</strong>ckpile reliability. Unfortunately<br />
until 1996 it was difficult <strong>to</strong> relate the deterministic materials aging test data <strong>to</strong><br />
component reliability. Since that time we have made great strides in mathematical<br />
techniques and computer <strong>to</strong>ols that permit explicit relationships between materials<br />
degradation, e.g. corrosion, thermo-mechanical fatigue, and reliability. The resulting<br />
suite of <strong>to</strong>ols is known as CRAX and the mathematical library supporting these <strong>to</strong>ols is<br />
Cassandra.<br />
However, these techniques ignore the his<strong>to</strong>rical data that is also available on similar<br />
systems in the nuclear s<strong>to</strong>ckpile, the DoD weapons complex and even in commercial<br />
applications. Traditional statistical techniques commonly used in classical reliability<br />
assessment do not permit data from these sources <strong>to</strong> be easily included in the overall<br />
assessment of system reliability. An older, alternative approach based on <strong>Bayes</strong>ian<br />
probability theory permits the inclusion of data from all applicable sources. Data from a<br />
variety of sources is brought <strong>to</strong>gether in a logical fashion through the repeated application<br />
of inductive mathematics.<br />
This research brings <strong>to</strong>gether existing mathematical methods, modifies and expands those<br />
techniques as required, permitting data from a wide variety of sources <strong>to</strong> be combined in<br />
a logical fashion <strong>to</strong> increase the confidence in the reliability assessment of the nuclear<br />
weapons s<strong>to</strong>ckpile.<br />
The application of this research is limited <strong>to</strong> those systems composed of discrete<br />
components, e.g. those that can be characterized as operating or not operating. However,<br />
there is nothing unique about the underlying principles and the extension <strong>to</strong> continuous<br />
subsystem/systems is straightforward. The framework is also laid for the consideration of<br />
systems with multiple correlated failure modes. While an important consideration, time<br />
and resources limited the specific demonstration of these methods.<br />
Background<br />
Problem<br />
Current techniques and analysis <strong>to</strong>ols used <strong>to</strong> assess s<strong>to</strong>ckpile reliability do not permit the<br />
mixture of data from system, subsystem, component, etc. level tests. The methods used<br />
depend exclusively on full scale testing for system reliability evaluation and ignore<br />
s<strong>to</strong>ckpile his<strong>to</strong>rical data, commercial product his<strong>to</strong>ry and the judgment of engineering<br />
SAND 2001-3513 1
designers. There is a need <strong>to</strong> be able <strong>to</strong> focus testing on those subsystems where there<br />
will be the largest return for testing dollars. In this case, return on investment is defined<br />
as an increased confidence in s<strong>to</strong>ckpile reliability. ‘Focused’ testing such as this requires<br />
a trade-off between the amounts of testing at the subsystem level versus testing at the<br />
system level. In addition, optimal development of test plans requires consideration of the<br />
time dependent nature of material properties (corrosion, thermo-mechanical fatigue, etc.),<br />
costs of manufacturing and testing unique subsystems or components, the his<strong>to</strong>rical data<br />
on similar systems (commercial and s<strong>to</strong>ckpile), and statistically dependent failure modes.<br />
Fundamental mathematical techniques exist in the open literature <strong>to</strong> address some of<br />
these issues and have been implemented in various software <strong>to</strong>ols throughout Sandia.<br />
However, existing techniques and software <strong>to</strong>ols do not address the critical issues of time<br />
dependent performance degradation and statistically dependent failure modes. Nor do<br />
they consider the optimal allocation of test resources. More detailed investigation of<br />
these methods will be necessary before a final conclusion can be reached.<br />
Solution <strong>Approach</strong><br />
This research is focused on the use of <strong>Bayes</strong>ian methods as the fundamental<br />
mathematical <strong>to</strong>ol for addressing the problem raised above. Particular concerns in testing<br />
complex systems are the high costs of testing and making accurate predictions regarding<br />
performance through the maximum use of all available information. This information<br />
might include, for example, engineering experience on similar systems or experimental<br />
data.<br />
To appreciate why a <strong>Bayes</strong>ian approach has been taken, consider the problem of a bag<br />
containing 5 red balls and 7 green balls (Jaynes 1989). On a particular draw we choose a<br />
ball, with probability 5/12 and 7/12 of picking a red or a green ball respectively. If, after<br />
the initial selection, the ball is not returned <strong>to</strong> the bag, then the chances of picking either a<br />
green or red ball on the next selection depends on the prior selection. On the other hand,<br />
if no information regarding the result of the first selection is available and a green ball is<br />
chosen on the second draw, what can be said about the probability of choosing a red or<br />
green ball on the first pick? Intuition suggests the results of the second selection should<br />
not influence the probability of choosing a red or green ball on the first draw. However,<br />
before answering this, consider the situation where there are only 1 red and 1 green ball<br />
in the bag. Clearly, the information available as a result of the second draw influences<br />
the guess as <strong>to</strong> the first selection. It is this use of information in a conditional manner<br />
that provides additional insight in<strong>to</strong> problems not otherwise possible and is the key <strong>to</strong> a<br />
<strong>Bayes</strong>ian approach <strong>to</strong> test plan design and data analysis.<br />
Why <strong>Bayes</strong> Methods for S<strong>to</strong>ckpile Assessment?<br />
From 1945 <strong>to</strong> 1963 the reliability of the U.S. nuclear s<strong>to</strong>ckpile was guaranteed through a<br />
series of atmospheric tests. After the 1963 Limited Test Ban treaty testing by the U.S.,<br />
Russia and the United Kingdom was conducted underground. Finally, the<br />
Comprehensive Test Ban Treaty of 1996 banned any future nuclear explosions, testing of<br />
nuclear weapons, or any other nuclear explosions and created the CTBTO in Vienna <strong>to</strong><br />
implement the treaty. As such, all s<strong>to</strong>ckpile reliability assessments are now based on<br />
assessment of subsystems being s<strong>to</strong>red in a wide variety of environments.<br />
SAND 2001-3513 2
However, in addition <strong>to</strong> these tests, as the s<strong>to</strong>ckpile is brought in for aging and<br />
surveillance inspection, data is collected on materials degradation, component<br />
performance drift, etc. . The limited test and inspection data that is available provides a<br />
wealth of information for assessment purposes. These test results feed a growing web of<br />
complex physics-based computer models for assessment of s<strong>to</strong>ckpile reliability. Until<br />
approximately 1996, it was difficult <strong>to</strong> relate the deterministic materials aging test data <strong>to</strong><br />
component reliability. At that time efforts were initiated <strong>to</strong> develop a suite of<br />
mathematical techniques and computer <strong>to</strong>ols that would permit an explicit relationship <strong>to</strong><br />
be explored between materials degradation, e.g. corrosion, thermo-mechanical fatigue,<br />
and reliability. This suite of <strong>to</strong>ols is referred <strong>to</strong> as CRAX and the mathematical library<br />
that supports these <strong>to</strong>ols is Cassandra.<br />
However, in addition <strong>to</strong> explicit experimental testing of material properties, an abundance<br />
of his<strong>to</strong>rical data is available on similar systems in the nuclear s<strong>to</strong>ckpile, the DoD<br />
weapons complex and even in commercial applications. Unfortunately traditional<br />
statistical techniques commonly used in classical reliability assessment do not permit data<br />
from these sources <strong>to</strong> be included in the<br />
overall assessment of system reliability.<br />
A <strong>Bayes</strong>ian approach <strong>to</strong> reliability<br />
assessment permits the inclusion of data<br />
from all applicable sources. The data is<br />
brought <strong>to</strong>gether in a logical fashion<br />
through the repeated application of<br />
inductive mathematics.<br />
To understand the usefulness of the<br />
<strong>Bayes</strong>ian approach and the impact on the<br />
test programs being conducted, it is best<br />
<strong>to</strong> examine a very simple example that, in<br />
an abstract fashion, contrasts the current<br />
method of s<strong>to</strong>ckpile evaluation with a<br />
very simple <strong>Bayes</strong>ian perspective.<br />
Current <strong>Approach</strong><br />
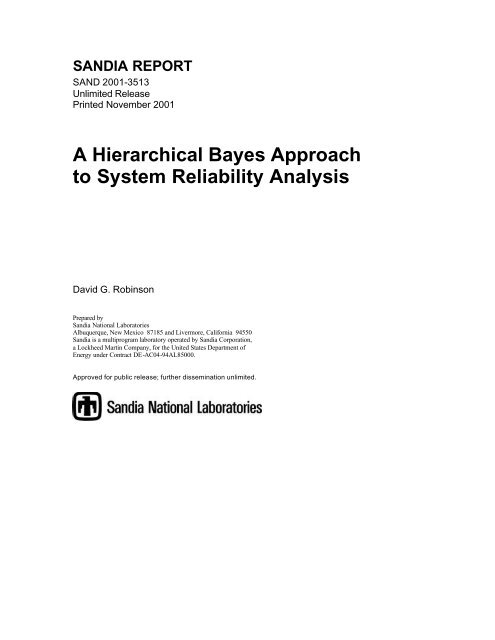
The assumptions used in the section are Figure 1. Sample Parameters<br />
based on those outlined in the white paper entitled <strong>Analysis</strong> of S<strong>to</strong>ckpile Sampling<br />
Strategies, by S. Crowder and E. Collins, 4 May 2000. The distribution of subpopulation<br />
fractions was adjusted slightly <strong>to</strong> assure that the fraction <strong>to</strong>tal was unity.<br />
Assumptions (see Figure 1)<br />
1. The general population has an overall defect rate of p1 . All of the defects<br />
associated with this rate will be lumped <strong>to</strong>gether and labeled as failure mode A.<br />
The fraction of the population with only failure mode A is f1 2. A certain fraction of the population,<br />
that occurs with rate p2 . This fraction of the population can experience both<br />
failure modes A and B.<br />
f 2 , has an additional inherent failure mode B,<br />
SAND 2001-3513 3
3. A third fraction of the population, f3 , has an additional unknown failure mode C,<br />
that occurs with rate p3 . This fraction of the population can experience both<br />
failure modes A and C.<br />
4. These three population fractions are mutually exclusive and are representative of<br />
the dominant population failure modes.<br />
5. The failure modes are pair-wise independent.<br />
6. The current approach <strong>to</strong> sampling requires a sample of 11 systems <strong>to</strong> be randomly<br />
selected from the population each year. No bias is introduced <strong>to</strong>ward/away from<br />
selecting particular units; i.e. the sampling is not done in a stratified fashion.<br />
7. The population fractions are: f1 = 0.80, f2 = 0.10, f3 = 0.10 and the assumed<br />
defect rates are: p1 = p2 = p3 = 0.1.<br />
Selection of Sample<br />
Given a sample of N units from the s<strong>to</strong>ckpile, there is a certain probability that the<br />
sample will be composed of n1 , n2 and n3 samples from the three fractions (where<br />
N = n1 + n2 + n3 ). The probability mass function of choosing a particular sample<br />
combination can be described with a multinomial distribution:<br />
P( X1 = n1 , X2 = n2 , X3 = n3)= N!<br />
n1 !n2 !n3 ! f n1 n2 n3 1 f 2<br />
f3 . (1)<br />
For example, the probability of selecting a sample composed of 8 units from the first<br />
population, 2 units from the second and 1 unit from the third can be calculated:<br />
P( X1 = 8, X2 = 2, X3 = 1)=<br />
11!<br />
8!2!1! (0.80)8 (0.10) 2 (0.10) 1 = 0.083.<br />
The probability of not sampling from the second subpopulation in the first year (of a two<br />
year sampling interval) can be calculated <strong>to</strong> be 0.318 and the probability of not sampling<br />
from the third subpopulation is also 0.318. The probability that the sample of 11 will not<br />
contain units from either subpopulation is 0.086. Note that these numbers only relate <strong>to</strong><br />
the probability that the overall sample will contain at least one unit from the<br />
subpopulations. Even if the subpopulation is sampled, there is nonzero probability that<br />
no defects will be observed.<br />
Observation of Defects<br />
Given a sample of ni units, the probability of observing si successes or equivalently<br />
di = ni − si defects is described by the binomial distribution:<br />
P( Si = si | pi , Ni = ni)= n i !<br />
s i !(n i − s i )! (1− p i )s i ( pi ) n i −s i (2)<br />
for each subpopulation. To calculate the probability of observing a defect(s) in a sample<br />
of N units, it is necessary <strong>to</strong> use the Theorem of Total Probability and convolve Equations<br />
1 and 2:<br />
N<br />
( )P X i = n i<br />
( )<br />
P(S i = si ) = ∑ P Si = si | pi , Ni = ni (3)<br />
n i =1<br />
SAND 2001-3513 4
where the marginal probability mass function is given by:<br />
( )<br />
N N<br />
P( X i = ni)= ∑ ∑ P X i = ni , X j = n j , X k = nk . (4)<br />
nj =1 nk =1<br />
Care must be taken when calculating the probability of observing defects for each of the<br />
failure modes since the <strong>to</strong>tal number of samples is limited <strong>to</strong> a specified number, in this<br />
case 11. Once the number of samples from two subpopulations is chosen, ni , nj , the<br />
number of samples from the remaining subpopulation is determined:<br />
n k = N − (n i + n j ) .<br />
Since there will always be N=11 samples that can be used <strong>to</strong> detect failure mode A, the<br />
probability of observing si successes is governed entirely by Equation 2. The probability<br />
of not observing a failure in the general population that can be traced <strong>to</strong> the common<br />
failure mode A can be calculated <strong>to</strong> be 0.314 and the expected number of years until a<br />
defect of type A is observed is 1 ≈1.5 years . This number is independent of<br />
(1− 0.314)<br />
whether targeted sampling is accomplished.<br />
Utilizing Equation 3, the probability of not observing a defect with a root cause<br />
attributable <strong>to</strong> failure mode B during a random year of testing is 0.895. The probability<br />
of not observing failure mode C is also 0.895. The expected number of years before<br />
observing at least one defect of failure type B is therefore: 1 ≈10 years .<br />
(1− 0.895)<br />
Similarly, the expected number of years before observing at least one defect related <strong>to</strong><br />
failure type C is: 1 ≈10 years .<br />
(1− 0.895)<br />
Alternatively, suppose a sample of 4 units is selected from a specific subpopulation, e.g.<br />
the subpopulation associated with failure mode B. Then for that subpopulation, the<br />
probability of observing si successes is again governed entirely by Equation 2. The<br />
probability of not observing a defect in the general population that can be traced <strong>to</strong> the<br />
common failure mode B can be calculated <strong>to</strong> be 0.656 and the expected number of years<br />
until a defect is observed is 1 ≈ 3 years .<br />
(1− 0.656)<br />
Considering that there now remain at most only 7 samples <strong>to</strong> detect failures for mode C,<br />
the probability of detecting a defect associated with failure mode C can be calculated by<br />
combining Equations 2 and 3. The probability of not detecting a failure of type C is<br />
0.932 and it is expected <strong>to</strong> take 1 ≈15 years until a defect is observed.<br />
(1− 0.932)<br />
Of course, a major fault with this analysis is that assumption that you would continue<br />
targeting a particular segment of the population even after not observing a particular<br />
failure mode. In reality, one would not continue sampling after there was sufficient<br />
confidence that the original hypothesis of a particular failure mode had been<br />
substantiated. The natural question then arises: how does one measure this degree of<br />
confidence regarding the significance of a particular failure mode?<br />
Failure Mode A B C<br />
SAND 2001-3513 5
Prob{detect defect in 1 yr} 0.686 0.105 0.105<br />
Expected time <strong>to</strong> detect defect (yrs) 1.5 10 10<br />
Table 1. Summary of Results for a Random Sample of 11<br />
Failure Mode A B C<br />
Prob{detect defect in 1 yr} 0.686 0.344 0.068<br />
Expected time <strong>to</strong> detect defect (yrs) 1.5 3 15<br />
Table 2. Summary of Results for a Targeted Samples of<br />
7 (subpopulation 2) and 4 (subpopulations 1 &3)<br />
Alternative approach<br />
In the following, an alternative approach is presented which explicitly accounts for data<br />
that might be available from various other testing activities. While there is no substitute<br />
for full scale testing in a realistic operational environment, it is also difficult justify not<br />
considering data from all relevant sources.<br />
Assumptions<br />
The alternative approach is still consistent with assumptions depicted in Figure 1. In the<br />
traditional approach outlined above, it was assumed that a particular subpopulation, e.g.<br />
B, would be targeted for sampling without any prior knowledge that a potential problem<br />
exists. It was also assumed that this failure mode had an associated defect rate of p2 ,<br />
even though there was no knowledge that this failure mode exists.<br />
As with the traditional approach, it will be assumed that the number of success, s,<br />
observed in n trials is governed by the binomial probability mass function:<br />
n!<br />
P( S = s | p,N = n)=<br />
f (s | p) =<br />
s!(n − s)! (1− p)n −s (p) s<br />
(5)<br />
However, in this alternative approach it<br />
will be assumed that the rate at which<br />
defects occur is a random variable, i.e. the<br />
true defect rate for each subpopulation is<br />
assumed <strong>to</strong> be unknown. Based on<br />
information available prior <strong>to</strong> the sample<br />
generation and testing, the probability<br />
density functions are assumed <strong>to</strong> be<br />
characterized by a beta density function:<br />
Figure 2. Probability Density Functions<br />
of Defect Rates<br />
SAND 2001-3513 6
g( p) =<br />
Γ(n 0 )<br />
Γ(s 0 )Γ(n 0 − s 0 ) p s 0 −1 (1− p) n 0 −s 0 −1 0 ≤ p ≤ 1 (6)<br />
∫<br />
∞<br />
where: Γ(n ) = x n−1 exp(− x)dx , and<br />
0<br />
s 0 ,<br />
n 0 are parameters of the distribution.<br />
After conducting a series of n tests and observing s successes, a new estimate of the<br />
defect rate can be calculated. <strong>Bayes</strong>’ theorem provides a relationship between the new<br />
defect distribution (the posterior distribution) and the prior distribution (Equation 6):<br />
g( p | s) =<br />
∫<br />
1<br />
0<br />
f (s | p)g( p)<br />
=<br />
f (s | p)g( p)dp<br />
f (s | p)g( p)<br />
f (s)<br />
Given the assumption of a general beta density function as the prior distribution on defect<br />
rate and a binomial distribution on the number of successes, the posterior distribution is<br />
also a beta distribution:<br />
g( p | s) =<br />
Γ(n 0 + n)<br />
Γ(s + s 0 )Γ(n 0 + n− s 0 − s) p(s 0 +s)−1 (1− p) (n 0 +n− s 0 −s)−1 0 ≤ p ≤ 1 (8)<br />
Observation of Defects<br />
The probability mass function of the number of successes in n trials (considering all<br />
possible values of the defect rate predicted by the posterior distribution) is the betabinomial<br />
distribution:<br />
∫<br />
1<br />
f (s) = f (s | p)g(p)dp<br />
0<br />
= n!Γ(n 0)Γ(s 0 + s)Γ(n 0 + n − s 0 − s)<br />
s!(n − s)!Γ(n 0 + n)Γ(s 0)Γ(n 0 − s 0)<br />
SAND 2001-3513 7<br />
(7)<br />
0≤ s ≤ n (9)<br />
The function, f(s), can be used <strong>to</strong> calculate the probability of observing one or more<br />
defects in a sample of n units given the current test data and prior information on the<br />
underlying defect rate.<br />
For this example, it is assumed that during the surveillance program there were 23 tests<br />
conducted and 5 failures were observed related <strong>to</strong> failure mode B. No failures have yet<br />
been observed for failure mode C. These numbers can be modified <strong>to</strong> specifically<br />
address the testing that was accomplished for a particular component.<br />
The estimate of the number of years <strong>to</strong> detect a problem is greatly simplified and is based<br />
on not updating the failure/success information that is gathered during testing each year.<br />
Failure Mode A B C<br />
Prob{detect defect in 1 yr} 0.550 0.600 0.556<br />
Expected time <strong>to</strong> detect defect (yrs) 1.82 1.67 1.80
Table 3. Summary of Results for Targeted Samples of<br />
7 (subpopulation 2) and 4 (subpopulations 1 &3)<br />
Using Alternative Methodology<br />
Summary<br />
The use of condition-based logic – given this information then I expect these results –<br />
contrasts greatly with more popular approach – this exact situation has happened many<br />
times so I expect it will happen again, or equivalently – this has never happened before<br />
so it will never happen in the future. The application of <strong>Bayes</strong>ian methods and inductive<br />
reasoning in general, permits the analyst <strong>to</strong> provide answers <strong>to</strong> a variety of questions with<br />
increased confidence.<br />
The above very simple example demonstrated how, at no additional cost, existing data<br />
could be included in the reliability assessment and highlight a potential problem in a<br />
significantly shorter period of time.<br />
The objective of this research is <strong>to</strong> explore the application of <strong>Bayes</strong>ian methods in<br />
assessing s<strong>to</strong>ckpile reliability and the use of these techniques in developing test planning<br />
strategies that will provide the nuclear weapons community with increased confidence in<br />
the system reliability being reported.<br />
Alternative <strong>Bayes</strong>ian Techniques<br />
Within the broad family of <strong>Bayes</strong>ian analysis techniques there are two broad frameworks<br />
for integrating test data from various sources and at various system and subsystem levels:<br />
empirical <strong>Bayes</strong> and hierarchical <strong>Bayes</strong>. The terms ‘empirical’ and ‘hierarchical’ are<br />
unfortunately common in the literature; all <strong>Bayes</strong>ian methods are empirical in nature and<br />
all can be described as being hierarchical in the fashion in which data is accumulated.<br />
<strong>Hierarchical</strong> <strong>Bayes</strong> (HB) is the more recent addition <strong>to</strong> the family and is more efficient<br />
than the traditional empirical <strong>Bayes</strong>ian approach and has been chosen as the general<br />
direction for future research. HB approach is also less sensitive <strong>to</strong> the choice of the prior<br />
distribution parameters, typically the source of much discussion. A very brief discussion<br />
of each method is provided in the following sections.<br />
Empirical <strong>Bayes</strong><br />
The foundation for empirical <strong>Bayes</strong>, or more specifically, parametric empirical <strong>Bayes</strong>,<br />
has been in place since von Mises in the 1940’s, but really came in<strong>to</strong> prominence in the<br />
1970’s with the series of papers by Efron and Morris, (e.g. Efron and Morris 1972).<br />
There have been a number of excellent publications in which the authors have taken the<br />
effort <strong>to</strong> explain the theory and logic behind empirical <strong>Bayes</strong> (Casella 1985, Deeley and<br />
Lindley 1981, Kass and Steffey 1989 and Morris 1983) and its relationship <strong>to</strong> other<br />
statistical techniques.<br />
The following discussion draws heavily from the example presented in Gelman, et. al.<br />
(2000, p. 120). The example has been modified slightly <strong>to</strong> provide some intuition <strong>to</strong><br />
s<strong>to</strong>ckpile reliability evaluation.<br />
SAND 2001-3513 8
Example<br />
Assume that success/test data from one particular weapon system is available from<br />
previous test cycles is summarized in Table 4.<br />
The objective of the effort is <strong>to</strong> estimate the probability of failure or defect rate, p. It will<br />
be assumed that the number of failures in each of the 10 tests (9 previous, 1 current), will<br />
be binomial distributed random variable with a given a defect rate p. The population<br />
from which the samples for the ten tests were drawn will be assumed <strong>to</strong> be absolutely<br />
homogeneous.<br />
Further, we will assume that p has a prior distribution described by a Beta probability<br />
density function with known parameters α and β: B(α, β). The posterior distribution of p<br />
after test 10 is also a Beta distribution: B(α+1, β+4). Using the traditional statistical<br />
approach of method of moments where:<br />
E( p)[1− E( p)]<br />
α + β = − 1<br />
V (p) ,<br />
α = (α + β )E( p)<br />
these parameters can be estimated from the data: α = 0.6, β = 3.13. The posterior<br />
distribution is therefore B(1.6, 7.13) with a mean and variance of 0.183 and 0.015,<br />
respectively. Compared <strong>to</strong> the estimate of p from the current data, 0.25, the posterior<br />
estimate of p is significantly smaller (p=0.183).<br />
Some subtle problems exist with the above approach. First, the use of point estimates for<br />
α and β are arbitrary and lack consideration for modeling uncertainty. Second, if there<br />
was interest in performing individual analyses on the 9 previous tests, the data would<br />
have <strong>to</strong> used once <strong>to</strong> form a prior and then again as part of the posterior. Data would be<br />
used twice and result in an overly<br />
conservative estimate of the defect rate p.<br />
In general empirical <strong>Bayes</strong>ian methods<br />
represent only an approximation <strong>to</strong> a full<br />
<strong>Bayes</strong>ian analysis. It does not represent a<br />
true <strong>Bayes</strong>ian analysis of the data since a<br />
traditional statistical approach was used <strong>to</strong><br />
estimate the parameters of the prior<br />
distribution. Alternatively, in a<br />
hierarchical <strong>Bayes</strong> approach, data<br />
analysis, all prior and posterior<br />
distribution characteristics are estimated<br />
in an integrated fashion.<br />
<strong>Hierarchical</strong> <strong>Bayes</strong><br />
As the section title suggests, the<br />
distinguishing feature of the alterative<br />
approach <strong>to</strong> empirical <strong>Bayes</strong>ian analysis is<br />
the hierarchical nature in which<br />
information is accumulated. Define<br />
Test Units<br />
tested - nj<br />
Failures-<br />
SAND 2001-3513 9<br />
yj<br />
P estimate<br />
1 5 1 0.2<br />
2 4 0 0.0<br />
3 5 0 0.0<br />
4 6 1 0.17<br />
5 4 1 0.25<br />
6 4 2 0.5<br />
7 5 0 0.0<br />
8 6 0 0.0<br />
9 6 2 0.33<br />
Total 45 7<br />
10 5 1 0.25<br />
Table 4. Empirical <strong>Bayes</strong> Example<br />
pj
y = y1 ,K, y { N } <strong>to</strong> be a set of independent and identically distributed samples and the<br />
associated likelihood function is therefore l(q,p | y) . Using the example from the<br />
previous section, it will be assumed that the variable q = {α,β} is an unknown<br />
hyperparameter vec<strong>to</strong>r described via a prior distribution f (q) . In the previous example,<br />
it was assumed that q = {α,β} was known and only required estimation. Now it is<br />
assumed that it is a random variable and the uncertainty in the hyperparameters is<br />
addressed explicitly. (The variable p will be generalized as a vec<strong>to</strong>r quantity, p, <strong>to</strong> allow<br />
for multiple distribution parameters.) The complete <strong>Bayes</strong>ian analysis for characterizing<br />
the density function f(p | y) requires a description of the vec<strong>to</strong>r of random variables<br />
(p,q) with joint prior distribution: f( p,q)=<br />
f (p | q) f(q) and joint posterior distribution:<br />
f ( p,q |y)∝<br />
f (p,q)l(p,q |y)<br />
= f (p,q) f (y |q)<br />
Note that the joint posterior density function: f( p,q |y)<br />
can be written as a product of the<br />
hyperprior f(q), the population distribution f(p |q) and the likelihood function<br />
l(q,p | y) . Under the assumption of an independent and identically distributed set of<br />
samples, y = { y1 ,K, yN }, an analytical expression for the conditional posterior density of<br />
f(p | q,y) can be easily constructed as the product of the density functions f( yi). Note<br />
also that f(y |p,q) = f (y |q) since y does not directly depend on p since q(p).<br />
In the case of conjugate density functions a solution is available directly. Once an<br />
expression for the joint posterior function is found, the marginal posterior distribution can<br />
be found through direct evaluation or via integration:<br />
f (p | y) =<br />
f (p,q | y)<br />
f (q |p, y)<br />
= ∫ f (p,q | y)dq .<br />
Example revisited<br />
We will again assume that the number of failures in each test is an independent<br />
observation from a Binomial distribution: y j ≈ Bin (n j , p j ) . In addition, the parameter p<br />
will be assumed <strong>to</strong> be a random variable following a Beta distribution: p j ≈ B(α, β) .<br />
The joint posterior distribution is defined:<br />
f ( p,α,β |y )∝ f (α,β) f ( p| α,β)l(y |α,β, p)<br />
∝ f (α,β)<br />
N<br />
∏<br />
j=1<br />
Γ(α + β)<br />
Γ(α)Γ(β)<br />
α −1 β −1<br />
pj (1− pj )<br />
y j p j (1− p j) n j − y j<br />
The marginal distributions of the parameters can then be found using the conditional<br />
f (p,α,β | y)<br />
probability expression, f ( p | y) =<br />
f (p |α,β,y) :<br />
f ( p |α,β,y) =<br />
N<br />
∏<br />
j=1<br />
Γ(α + β + n j )<br />
Γ(α + y j)Γ(β + n j − y j )<br />
SAND 2001-3513 10<br />
N<br />
∏<br />
j=1<br />
α + y j −1<br />
p j (1− pj ) β +n j −y j −1
f ( α,β | y)∝<br />
f (α,β)<br />
N<br />
∏<br />
j=1<br />
Γ(α + β)Γ(α + y j)Γ(β + n j − y j)<br />
Γ(α)Γ(β)Γ(α + β + n j)<br />
To proceed, it is only necessary <strong>to</strong> describe a hyperprior distribution function for<br />
q = {α,β}. Typically this distribution is taken <strong>to</strong> be relatively non-informative so avoid<br />
dominating the solution. Regardless of the choice of hyperprior, it is critical that it be<br />
mathematically feasible and results in a logical marginal posterior distribution.<br />
An alternative <strong>to</strong> the analytical approach outlined above is of simulation <strong>to</strong> construct the<br />
various conditional density functions.<br />
1. Generate a sample of the hyperparameter vec<strong>to</strong>r q from the marginal distribution<br />
function, f q | y<br />
( ).<br />
2. Given q, generate a sample parameter vec<strong>to</strong>r p from f(p | q,y).<br />
3. A population sample can be then be generated using the likelihood function<br />
l(y | q,p).<br />
Generally these steps will be difficult <strong>to</strong> accomplish due <strong>to</strong> the problems associated with<br />
generating samples from complex conditional distributions. A simulation technique<br />
particularly suited for this task, Markov Chain Monte Carlo simulation, will be<br />
introduced in the following section.<br />
Two recent applications of hierarchical <strong>Bayes</strong> methods in the structural reliability area<br />
are Wilson and Taylor (1997) and Celeux et al. (1999).<br />
Graphical Representation of <strong>Hierarchical</strong> Models<br />
<strong>Hierarchical</strong> models have been increasingly popular and have a potential application for<br />
solving very complex problems. The structure of hierarchical models lends itself easily<br />
<strong>to</strong> a graphical depiction of the relationships between various model constructs using<br />
directed graphs. These graphical car<strong>to</strong>ons are useful for organizing information and also<br />
for constructing the posterior distribution functions discussed above.<br />
Directed graphs are essentially a set of nodes connected with a set of directed edges or<br />
arrows which depict the informational dependencies between the nodes. Those nodes<br />
that feed information <strong>to</strong> subsequent nodes are considered parent nodes. Each node is<br />
considered independent of all other nodes except parent nodes and those nodes for which<br />
that node is a parent.<br />
There are three types of nodes:<br />
1. Constant nodes have no parents and represent fixed quantities in the analysis.<br />
These nodes are represented by rectangles.<br />
2. S<strong>to</strong>chastic nodes may have parents or children and represent, typically,<br />
unobserved random variables. They are commonly represented by circles on the<br />
graph.<br />
3. Functional or deterministic nodes represent functions of other variables in the<br />
graph.<br />
SAND 2001-3513 11
Conventional depiction of the edges includes the use of solid arrows for statistical<br />
dependence and dashed lines for functional dependence. Note that even though nodes<br />
may have no common ances<strong>to</strong>r, and thus are marginally independent, this independence<br />
may disappear when other quantities enter in<strong>to</strong> the conditioning structure. Dependencies<br />
are often induced between variables as a result of observational data. A box surrounding<br />
a set of variables indicates that those variables are conditionally statistically independent<br />
given their parents.<br />
In the classic example of stress-strength interference, g = R − S , where:<br />
f R (r |μ r ,σ r ) ⇒ N μ r ,σ ( r),<br />
f s (s | μs ,σ s ) ⇒ N( μs ,σ s)<br />
and, for example:<br />
f μs (μs | αs , βs ) ⇒ N αs , β ( s),<br />
fσ (σ s s |γ s ,τ s ) ⇒ Gam( γ s ,τ s)<br />
and so on. As indicated by the<br />
box in Figure 3, the variables R and S are assumed <strong>to</strong> be independent random variables in<br />
this example.<br />
With the exception of special simple cases involving conjugate distributions, the<br />
generation of the above mentioned conditional density functions can be extremely<br />
difficult and in some situations impossible. An increasingly useful approach for<br />
generating these distributions is based on assuming that the desired joint posterior<br />
distribution is the stationary distribution that results from a Markov chain. The use of<br />
Monte Carlo simulation methods <strong>to</strong> generate this distribution is referred <strong>to</strong> as Markov<br />
Chain Monte Carlo (MCMC) simulation.<br />
Markov Chain Monte Carlo Methods<br />
Fundamental <strong>to</strong> all Markov Chain Monte Carlo (MCMC) samplers is the ability <strong>to</strong><br />
generate random variables from a distribution indirectly without having <strong>to</strong> calculate the<br />
density explicitly. As the name implies, these simulation methods are based on the basic<br />
principles of Markov chains.<br />
Figure 3. Interference Example of <strong>Hierarchical</strong> <strong>Bayes</strong><br />
SAND 2001-3513 12
Let P( x, y) represent the transition matrix for a Markov Chain where P( x, y) represents<br />
the probability of transitioning <strong>to</strong> a state y given that the current state is x. (Note that<br />
∫<br />
P(x, y) = 1 and P( x, x) may not be zero.) Assuming certain regularity conditions for<br />
y<br />
P( x, y), then after a sufficient number of transitions the probability of being in any<br />
particular state converges <strong>to</strong> a stationary probability density function π(x). In particular,<br />
if P( x, y) satisfies the reversibility criteria: π( x)P(x, y) = π( y)P( y, x) then π(x) is a<br />
stationary distribution.<br />
For MCMC simulation, the problem is just the reverse: given a stationary probability<br />
density function π(x), what is the necessary transition matrix? A method <strong>to</strong> accomplish<br />
this was first proposed by Metropolis (1953) and generalized by Hastings (1970).<br />
Metropolis-Hastings<br />
Assume that, as with the acceptance/rejection method above, a candidate density<br />
function, q(x, y) , exists for generating possible samples from π(x). (In the MCMC<br />
literature q(x, y) is referred <strong>to</strong> as the proposal distribution.) However, since samples are<br />
being generated from a Markov chain, this density function changes during the<br />
simulation process (depending on the current state). The density q(x, y) can be easily<br />
constructed so that<br />
∫<br />
q( x, y)dy<br />
y<br />
= 1, however it may not satisfy the reversibility criteria.<br />
The construction of an appropriate state transition matrix P( x, y), for y ≠ x, must<br />
account for the degree <strong>to</strong> which the reversibility criteria is satisfied. Define the<br />
probability of moving out of state x in<strong>to</strong> any other state y as α(x, y) . Therefore the<br />
matrix describing transitions from x <strong>to</strong> y must be conditioned on this probability so that<br />
P( x, y) = q( y,x)α(x, y) . It can be shown (e.g. Chib and Greenberg 1995) that<br />
π( y)q( y,x )<br />
α(x, y) = min<br />
π( x)q( x,y ) ,1<br />
⎡<br />
⎤<br />
⎢<br />
⎥ ,<br />
⎣<br />
⎦<br />
if π( x)q( x, y) > 0<br />
=1, otherwise<br />
The value of α(x, y) represents the probably that the i+1 sample is a new sample,<br />
xi+1 = y , or is identical <strong>to</strong> the existing sample xi+1 = xi . Contrast this with the<br />
acceptance/rejection method outlined above where, upon rejection, the sample is not<br />
retained.<br />
The sampling method as first proposed by Metropolis assumes that the proposal density<br />
function is symmetric, i.e. q(x, y) = q( y, x), which simplifies the criteria for accepting or<br />
π( y)<br />
rejecting the next sample: α(x, y) = min<br />
π( x) ,1<br />
⎡ ⎤<br />
⎢ ⎥ .<br />
⎣ ⎦<br />
For the situation of a scalar x the Metropolis-Hastings algorithm can be summarized:<br />
1. Assume an initial value of<br />
x (0)<br />
2. generate a random deviate, y (the next potential candidate x value), from q( x (i) ,⋅)<br />
SAND 2001-3513 13
3. sample<br />
4.<br />
u =U 0,1<br />
If u ≤ α( x (i) , y) = min π ( y)q( y, x (i) )<br />
π( x (i) )q( x (i) , y) ,1<br />
⎡<br />
⎤<br />
⎢<br />
⎥<br />
⎣ ⎢<br />
⎦ ⎥ ⇒ x (i+1) = y else x (i+1) = x (i)<br />
5. repeat steps 2-4 until a stationary sequence of variables of sufficient length has<br />
been generated<br />
The proposal distribution can be of any form and a stationary distribution π(x) will be<br />
generated. However, for faster convergence and better mixing, it is generally desirable<br />
that the proposal distribution be similar <strong>to</strong> the desired stationary distribution.<br />
For a vec<strong>to</strong>r valued x, it is often desirable <strong>to</strong> sequentially update the individual<br />
components of the vec<strong>to</strong>r. Define<br />
sample vec<strong>to</strong>r generated and let<br />
{ } <strong>to</strong> be the i th n-dimensional<br />
{ } be the same<br />
x (i) = x (i)1 , x (i)2 ,K, x (i)n<br />
x (i)− j = x (i)1 , x (i)2 ,K, x (i) j−1 , x (i) j+1 ,K, x (i)n<br />
vec<strong>to</strong>r, but with the j th element removed. The Metropolis-Hastings algorithm then can be<br />
described:<br />
1. Assume an initial value of<br />
x (0) = { x (0)1 , x (0)2 ,K,x (0)n}<br />
2. Generate a random deviate, y (i) , from the proposal distribution q( y (i) | x (i) jx (i)− j).<br />
The value of y (i) represents the updated value of the j th component of x (i) where<br />
the other elements have been updated in a previous iteration.<br />
3. Sample<br />
u =U 0,1<br />
( )q y (i) | x (i) j , x (i)− j<br />
( )<br />
( ) ,1<br />
4. If u ≤ α(x (i) j , x (i)− j ,y (i) ) = min π y (i) | x ⎡<br />
(i)− j<br />
⎢<br />
⎢<br />
⎣<br />
π( x (i) j | x (i)− j)q<br />
x (i) j | y (i) , x (i)− j<br />
else x (i+1) j = x (i) j . The other elements of x (i) are not updated.<br />
5. Steps 2-4 are repeated until all elements of<br />
x (i+1) have been updated.<br />
6. Steps 2-5 are repeated until a stationary sequence of samples<br />
⎤<br />
⎥<br />
⎥<br />
⎦<br />
⇒ x (i+1) j = y (i)<br />
x (i) is available<br />
It is very important <strong>to</strong> note that the distribution π(x) needs <strong>to</strong> be only known up <strong>to</strong> a<br />
multiplicative constant, since this constant cancels out in the analysis. This can be<br />
critical in those situations in <strong>Bayes</strong>ian reliability analysis where the constant can be<br />
difficult <strong>to</strong> calculate.<br />
The availability of the full conditional distribution<br />
π( x (i) j | x (i)− j)=<br />
π(x)<br />
π(x)dx (i) j<br />
critical <strong>to</strong> MCMC analysis and is the subject of much of the literature. Common<br />
approaches will be outlined in the following discussion.<br />
SAND 2001-3513 14<br />
∫<br />
∝ π(x) is
Example<br />
Let π(x) = λ<br />
x! e−λ and the proposal<br />
distribution be a simple random walk:<br />
y = x (i) +1 ⎧ ⎪<br />
⎨<br />
⎩ ⎪ x (i) −1<br />
.<br />
with equal probability<br />
Since q(x,y) = q(y,x) for a random walk<br />
process, the dependence on q drops out.<br />
The Metropolis acceptance ratio is<br />
therefore:<br />
α =<br />
π( y)<br />
π( x (i) ) = x (i) !<br />
y! λ y− x ( i)<br />
If u =U0,1 , then the transition <strong>to</strong> a new state will be accepted if u < α and will be rejected<br />
otherwise. Figures 4.a,b,c illustrate the results for λ = 4.0, x (0) = 20 and a sample size of<br />
N=1000. Figure 4.a is of the first 100 samples and Figure 4.b is the complete his<strong>to</strong>ry of<br />
1000. Figure 4.c is a his<strong>to</strong>gram depicting the resulting frequency distribution for the<br />
variable x.<br />
Gibbs Sampling<br />
Gibbs sampling is a special case of the Metropolis-Hastings sampling algorithm. The<br />
proposal distribution is assumed <strong>to</strong> be:<br />
( )= π y (i) | x (i)− j<br />
q y (i) | x (i) j x (i)− j<br />
( )<br />
Figure 4.c Metropolis-Hastings Results<br />
When this distribution is incorporated in the Metropolis-Hastings algorithm, the<br />
probability of accepting a transition is one. Gibbs sampling is identical <strong>to</strong> the iterative<br />
Figure 4.a-b Metropolis-Hastings Sample His<strong>to</strong>ry<br />
SAND 2001-3513 15
algorithm outlined in the previous section with no check for sample acceptance. Using<br />
the algorithm outlined by Gelfand and Smith (1990), a sample from the probability<br />
density function, f (x) = f ( x1 , x2 ) , can be generated by iteratively samping from the full<br />
conditional distributions f (x1 | x2 ) and f (x 2 | x1 ):<br />
1. Assume an initial value of<br />
{ }<br />
x (0) = x (0)1 , x (0)2 ,K,x (0)n<br />
2. Generate a random deviate, y (i) , from the proposal distribution π( y (i) | x (i)− j).<br />
The<br />
value of y (i) represents the updated value of the j th component of x (i) where the<br />
other elements have been updated in a previous iteration.<br />
3. Step 2 is repeated until all elements of<br />
x (i+1) have been updated.<br />
4. Steps 2-3 are repeated until a stationary sequence of samples<br />
x (i) is available.<br />
Once stationarity is achieved the resulting samples represent samples from f (x) .<br />
The result of Steps 2-3 are realizations from a Markov chain with transition probability<br />
from x (i) <strong>to</strong> x (i+1) given by:<br />
n<br />
( )= ∏ π( x (i+1) l | x (i) j , j > l, x (i+1) j , j < l)<br />
l=1<br />
π( y (i) | x (i)− j)<br />
are needed for Gibbs sampling. For<br />
P x (i) , x (i+1)<br />
Only the full conditional distributions<br />
high dimensional x, Gibbs sampling can be slow <strong>to</strong> converge. For this reason, if higher<br />
order conditionals are available, e.g. f (x 2 , x3 | x1 ) versus f (x 3 | x1 , x2 ) , f (x 2 | x1 , x3 ) ,<br />
then the use of those conditionals can significantly speed convergence (Gelfland and<br />
Smith, 1990).<br />
It should also be emphasized that variance reduction methods for generating samples<br />
(Latin hypercube, importance sampling, field analysis, etc.) are still applicable.<br />
Example 1 (following Casella and George, 1992):<br />
Let the number of failures observed on a system be a random variable described by a<br />
binomial distribution:<br />
f (x | p, n) = n ⎛<br />
⎜<br />
⎝ p<br />
⎞<br />
⎟ p<br />
⎠<br />
x (1− p) n−x<br />
where p is the probability of observing a defect in a particular trial. Given an observed<br />
number of failures, let p in turn be a random variable described by a Beta distribution:<br />
f ( p | x, n,α,β ) =<br />
Γ(n + α + β)<br />
Γ(x +α )Γ(n − x + β) p (x+α )−1 (n− x+β )−1<br />
(1− p)<br />
where α and β are referred <strong>to</strong> as the pseudo-number of failures and successes<br />
respectively. It is desired <strong>to</strong> obtain the distribution of the number of defects, f (x), i.e.<br />
the marginal distribution.<br />
SAND 2001-3513 16
Figure 5.a depicts the sampling his<strong>to</strong>ry for variable x after 700 iterations with a Gibbs<br />
sampler using α = 2, β = 4 and n=16. Figure 5.b is the associated his<strong>to</strong>gram. Since<br />
there is a closed form solution available for f (x):<br />
f (x) = n ⎛<br />
⎜<br />
⎝ x<br />
⎞<br />
⎟<br />
⎠<br />
Γ(α + β)Γ( x + α)Γ(n − x + β)<br />
Γ(α)Γ(β)Γ(n + α + β)<br />
the exact solution is superimposed on the his<strong>to</strong>gram.<br />
x = 0,1,Kn<br />
It is important <strong>to</strong> note that in those cases where the full conditional distributions are not<br />
available in closed form for easy sample generation, the analyst must resort <strong>to</strong> a<br />
Metropolis-Hasting algorithm.<br />
Figure 5.a-b Results for Example 1 of the Gibbs Sampler<br />
Full Conditional Distribution<br />
As noted previously, for Gibbs sampling, only the full conditional distributions are<br />
required. By specifying the relationships between these conditional distributions it is<br />
possible <strong>to</strong> completely describe the entire model. These relationships are fully<br />
characterized by the directed acyclic graph (DAG) discussed in the hierarchical section<br />
above. The DAG represents the conditional dependencies of the full model before any<br />
data is collected. When data is introduced <strong>to</strong> the model, the statistical relationships<br />
between variables may change.<br />
Let v be the set of nodes on a DAG of interest and vi be a particular node. Define v−i <strong>to</strong><br />
be set of nodes without the node vi. A parent of vi is any node with a directed line from it<br />
<strong>to</strong> node v. Lauritzen, et al. (1990) showed that a DAG model constructed in the above<br />
manner fully describes the joint distribution of all the random variables in terms of the<br />
conditional distribution of each node: f (v) = ∏ P(vi | parents [vi ]) . The full conditional<br />
distribution is therefore<br />
SAND 2001-3513 17
f ( x j | x−j)= ∫<br />
f (x)<br />
f (x)dx j<br />
( )<br />
∝ f (x) = f x j ,x −j<br />
∝ terms in f (x) involving x j<br />
∏<br />
= P(x j | parents [x j ]) P(wk | parents [wk ])<br />
1 4 4 2 4 4 4 3 x j ∈parents [wk ]<br />
prior 1 4 4 4 4 4 2 4 4 4 4 4 3<br />
likelihood<br />
If full conditional distributions are difficult <strong>to</strong> sample from, an adaptive rejection method<br />
can be used (Gilks , 1992).<br />
Example<br />
Using the stress-strength example depicted in the DAG above, the joint distribution of all<br />
the parameters is given by:<br />
f (R,S,μ r,σ r, a r,β r,γ r,τ r,μ s,σ s,a s,β s,γ s,τ s) =<br />
f (R | μ r,σ r) f (μ r | a r,β r) f (σ r | γ r,τ r) f (S |μ s,σ s) f (μ s | a s,β s) f (σ s |γ s,τ s)<br />
Exchangeability<br />
Assume that over a period of time, a series of N binary (go/no-go) tests were performed.<br />
For the j th test, a sample of nj was evaluated and θj failures were observed. If there is no<br />
information <strong>to</strong> distinguish any of the tests, there were no grouping or unique ordering,<br />
then there is symmetry in the parameters. This symmetry implies that it is possible <strong>to</strong><br />
analyze the data regardless of the order in which the data was observed and processed,<br />
i.e. it is equally realistic <strong>to</strong> analyze the data as ( θ1 ,θ2 , θ3 ,K,θ n)<br />
or as ( θ n ,θ2 ,θ1 ,K, θ3). In<br />
this situation, where all the parameters are assumed <strong>to</strong> come from identical distributions,<br />
it is appropriate <strong>to</strong> use an exchangeable model. When additional data becomes available<br />
<strong>to</strong> support differences, then exchangeability may still be appropriate. For example, if<br />
after a series of tests, system age is identified as a distinguishing feature, this feature may<br />
be explicitly included in the model. In this way the dependencies may be encoded or<br />
grouped in such a manner that the resulting model is then exchangeable (Gelman, et al.<br />
2000, p. 123-126).<br />
<strong>Bayes</strong>ian <strong>System</strong> <strong>Reliability</strong> <strong>Analysis</strong><br />
<strong>System</strong> Level <strong>Analysis</strong><br />
Over the past 35 years there has been considerable effort expended in characterizing the<br />
reliability of a complex system using <strong>Bayes</strong>ian methods. The reader is referred <strong>to</strong> the<br />
many fine articles in the literature as well as the many books such as the classic by Martz<br />
and Waller (1982) and the more recent Savchuk and Tsokos (1996).<br />
The majority of the literature concentrates on the development of approximations <strong>to</strong><br />
unique system configurations and failure density functions such that the results are<br />
mathematically tractable. However, it is felt that the current reliability analysis problems<br />
<strong>to</strong> be addressed with this research can be better met with advanced computer simulation<br />
SAND 2001-3513 18
methods. This approach requires a minimum of compromise in utilizing all available<br />
component and system operational information. In addition, prior distribution functions<br />
and system configurations are not ‘forced’ on<strong>to</strong> the analysis.<br />
The material in this section is presented more <strong>to</strong> introduce notation necessary for future<br />
discussions rather than for completeness. The emphasis is on developing the<br />
mathematical foundation needed for combining system and component test information.<br />
<strong>System</strong> Definition<br />
It will be assumed that each of the i, i =1,K,n , components or subsystems, as well as the<br />
entire system can be in one of two possible states: operational or failed. [Note that all of<br />
the methods <strong>to</strong> be discussed can be generalized <strong>to</strong> multi-state system operation, and the<br />
possible dependence on time is unders<strong>to</strong>od.] The vec<strong>to</strong>r x = { x1 ,K, xn} and the variable<br />
y completely represent the state of the subsystem and components respectively, where:<br />
⎧ 1 if (sub)system operating<br />
y,x i = ⎨<br />
⎩ 0 if (sub)system failed<br />
i =1,K,n<br />
The system state is related <strong>to</strong> the subsystem states through a function φ(⋅) referred <strong>to</strong> as<br />
the system structure function: y = φ(x 1 ,K, xn ) .<br />
Coherence<br />
Consider two n-tuples: (α1 ,K ,α n ) and (β1 ,K,βn ) . The dominance of a over b is<br />
denoted: a ≥ b and is defined: a ≥ b iff αi ≥ βi , i = 1,K, n . Equivalence of a and b is<br />
denoted: a = b and defined: a = b iff αi = βi , i = 1,K, n . A structure function, φ(x) is<br />
said <strong>to</strong> be coherent if: x ′ ≥ x ′ ⇒ φ( x ′ ) ≥ φ( x ′ ′ ) for all vec<strong>to</strong>rs x´ and x?.<br />
<strong>Reliability</strong><br />
Let pi , the probability that subsystem i is functioning, be a random variable with<br />
distribution function π( pi ) defined over the unit interval. The expected reliability of the<br />
i th component is therefore: ˆ p i = E[ pi ] = ∫ piπ( pi )dpi . It will be assumed that, given pi ,<br />
xi is independent of pj ,∀ j≠i and, given p = ( p1,K, pn), the xi are all mutually<br />
independent.<br />
For a series system, the reliability is given by:<br />
pS = ∫ Pr{y = 1| p1 , p2 ,K, pn }π(p1 , p2 ,K,pn )dp<br />
∫<br />
∏ )π(p1 ,p2 ,K, pn )dp<br />
n<br />
= ( p i<br />
where π( p1, p2,K, pn) is not necessarily equal <strong>to</strong> π( p1)π( p2)Lπ(pn). Finally, a statement<br />
regarding the expected reliability of the system can be constructed:<br />
ˆ p s = E[p s ] = ∫ φ(p)π(p)dp . Except for unique situations, evaluation of ˆ p s is difficult <strong>to</strong><br />
compute and various uncertainty analysis methods, e.g. Monte Carlo, must be applied.<br />
SAND 2001-3513 19
Aggregation of <strong>System</strong>/Component Data<br />
A number of authors have suggested methods for combining subsystem and system data<br />
under a <strong>Bayes</strong>ian framework, including: Mastran (1976), Mastran and Singpurwalla<br />
(1978), Martz, Waller, and Fickas (1988) and Martz and Waller (1990). In general, these<br />
papers, along with a number of others, support analysis approaches that permit the<br />
inclusion of test data from a number of levels of system indenture, in<strong>to</strong> an overall<br />
estimate of the system reliability.<br />
The methods all depend on a combination of analytical techniques for combining test<br />
information and inherently depend on assumptions regarding the underlying distribution<br />
function. The approach presented in this paper is far less elegant, but applicable <strong>to</strong> wider<br />
array of complex system configurations.<br />
Caution Regarding Aggregation<br />
As noted in the papers above, the<br />
aggregation of system and component<br />
level data can become involved. In<br />
general, the system level reliability<br />
distribution derived from component<br />
data is used as a prior the reliability<br />
distribution based on system level<br />
data (Figure 6). However, when<br />
component and system level failure<br />
and performance information is<br />
collected at the same time,<br />
aggregation of component data in<strong>to</strong> a Figure 6. Failure Data Processing Options<br />
system level analysis may not result<br />
in the same reliability prediction as obtained from the system data alone, e.g. Azaiez and<br />
Bier (1995).<br />
<strong>Reliability</strong> Simulation Using MCMC<br />
The preceding discussion has laid out the pieces that comprise a foundation for<br />
conducting a Markov Chain Monte Carlo analysis of a complex system. The following<br />
discussion focuses on the application of these techniques in the reliability assessment of<br />
such a system. The discussion begins with the development of two methods for<br />
performing component level analysis. Also addressed is the issue associated with the<br />
inclusion of experimental and his<strong>to</strong>rical data in the component reliability assessment.<br />
Finally, an approach for combining component level information in<strong>to</strong> a system level<br />
reliability evaluation is presented with a suitable eye on the impact of aggregation of<br />
data.<br />
Component Level <strong>Analysis</strong><br />
For now, assume that each component can be tested and results in the observation of<br />
either a success or failure. In this binomial sampling there are n tests performed, s<br />
successes observed and p is defined <strong>to</strong> be the probability of success on a single trial. The<br />
SAND 2001-3513 20
Figure 8. DAG for Example 1<br />
conditional distribution of the number of failures<br />
observed given a particular probability of success is<br />
therefore:<br />
n!<br />
P( S = s | p,N = n)=<br />
f (s | p) =<br />
s!(n − s)! ps n− s<br />
(1− p)<br />
Let g(p) be the prior density function describing the<br />
probability of failure. The posterior distribution<br />
function is then given by:<br />
g( p | s) =<br />
f (s | p)g(p)<br />
= Kp<br />
f (s | p)g(p)dp<br />
s (1− p) n −s g(p)<br />
Prior distribution – Example 1<br />
Each component will be assumed <strong>to</strong> be highly reliable and, following Chen and<br />
Singpurwalla (1996), the prior distribution on the probability of failure will be assumed<br />
<strong>to</strong> be a truncated beta distribution: Beta(1,α), defined over the interval (γ ,1) (Figure 9.a):<br />
1<br />
π( p| γ,α) =<br />
B(a,b) pa−1 (1− p) b−1 0 < p 0<br />
= α(1− p) α −1 (1− γ) α<br />
.<br />
γ < p
The directed acyclic graph<br />
depicting the relationships between<br />
the prior and hyperprior random<br />
variables and parameters is<br />
presented in Figure 8.<br />
Prior distribution – Example 2<br />
In this situation, the first stage prior<br />
of the reliability will be assumed <strong>to</strong><br />
follow as beta distribution defined<br />
on the full interval (0,1).<br />
1<br />
π( p| a,b) =<br />
B(a,b) p a−1 (1− p) b−1 Figure 9. Component DAG for Example 2<br />
0 < p 0<br />
A common approach is <strong>to</strong> redefine the variable p via a logit transformation:<br />
⎛ p ⎞<br />
r = log⎜<br />
⎟ .<br />
⎝ 1− p⎠<br />
It is well known that if r is assumed <strong>to</strong> be a Gaussian random variable, then p is<br />
approximately beta. The second stage distributions for the first stage distribution<br />
parameters, μ,σ can then be conveniently constructed. For example, μ can be assumed<br />
<strong>to</strong> be an improper uniform distribution defined across the real line and νλ σ 2 can be<br />
2<br />
assumed <strong>to</strong> follow a χν distribution where λ and ν are specified.<br />
However, for the current situation, it will be assumed that the first stage prior remains<br />
described as a beta distribution and that the parameters, a and b, are each random<br />
variables further characterized in a second stage probability distribution.<br />
The second stage distribution will be assumed <strong>to</strong> be a two parameter Weibull:<br />
f (x) = α ⎛ x<br />
⎜<br />
β ⎝ β<br />
⎞<br />
⎟<br />
⎠<br />
α −1<br />
exp − x ⎛<br />
⎜<br />
⎝ β<br />
⎞ ⎡<br />
⎢ ⎟<br />
⎣ ⎢ ⎠<br />
α<br />
⎤<br />
⎥<br />
⎦ ⎥<br />
x > 0,α,β > 0<br />
The DAG of this multi-stage analysis is depicted in Figure 9.<br />
Component Data<br />
Given that a set of n independent tests are performed on a component with s and f<br />
successes and failures are observed, then the data d = (n, s) can be incorporated in<strong>to</strong> the<br />
posterior distribution function: π( p| a,b,d) .<br />
Construction of Full Conditional Distributions (without system level test data)<br />
For this example a first stage beta and second stage Weibull distributions will be<br />
assumed. The joint distribution of the data and the parameters of this model are then<br />
described by:<br />
SAND 2001-3513 22
g( p,a,b,d) = ∏ g(pi | a, b)g(a)g(b)<br />
i<br />
= p a+ s−1 b+ f −1<br />
(1− p) αaαb B(a,b) βaβb ⎛ a ⎞<br />
⎜ ⎟<br />
⎝ ⎠<br />
β a<br />
α a −1<br />
⎛ b ⎞<br />
⎜ ⎟<br />
⎝ ⎠<br />
β b<br />
SAND 2001-3513 23<br />
α b −1<br />
⎡ ⎧ ⎪ ⎛ a ⎞<br />
exp ⎢ −⎨<br />
⎜ ⎟<br />
⎢ ⎝ βa ⎠<br />
⎣ ⎩ ⎪<br />
α a<br />
+ b ⎛ ⎞<br />
⎜ ⎟<br />
⎝ ⎠<br />
To construct the full conditional distribution π(a |b) it is a simple matter <strong>to</strong> pick out<br />
those terms in (A) which involve the parameter a:<br />
π(a |b) ∝ a α a −1 p a+ s−1 exp − a<br />
α a ⎡ ⎛ ⎞ ⎤<br />
⎢<br />
⎝<br />
⎜<br />
βa⎠ ⎟ ⎥<br />
⎣ ⎢ ⎦ ⎥ .<br />
Similarly, the full conditional distribution π(a |b) can be found:<br />
π(b |a) ∝ b α b −1 (1− p) b+ f −1 exp − b<br />
α b ⎡ ⎛ ⎞ ⎤<br />
⎢<br />
⎝<br />
⎜<br />
βb ⎠<br />
⎟ ⎥<br />
⎣ ⎢ ⎦ ⎥<br />
Since these distributions cannot be sampled from directly, the Gibbs sampling approach<br />
can not be used directly. It is necessary <strong>to</strong> augment the sampling with a Metropolis-<br />
Hasting rejection step. Note that the full conditional distributions need <strong>to</strong> be known only<br />
up <strong>to</strong> a multiplicative constant since that constant will cancel in the reject step.<br />
Simulation<br />
The proposal distribution q() ⋅ still needs <strong>to</strong> be specified. For the parameters a and b, the<br />
distribution will be assumed <strong>to</strong> be a Gaussian distribution with mean equal <strong>to</strong> the current<br />
value of the parameter and a standard deviation of twice the standard deviation of the<br />
associated marginal distribution. For p, the proposal distribution will be assumed <strong>to</strong> be<br />
U0,1 .<br />
1. Assume initial values for { p (0) , a (0) ,b (0) }. These initial values are assumed <strong>to</strong> be<br />
the means of the respective marginal distributions.<br />
2. Generate a random deviate for the parameter a:<br />
a. Generate a candidate random deviate, a (i) , from the proposal distribution<br />
2<br />
y (i) ~ N(a (i−1),4σ<br />
a).<br />
b. Sample<br />
u =U 0,1<br />
If u ≤ α(y (i),a (i−1),b (i−1), p (i−1)) =<br />
( )q a = y (i) |b (i−1),p<br />
(i−1)<br />
( )q a (i−1) |b (i−1),p<br />
(i−1)<br />
min π a = y ⎡<br />
(i) | b (i−1), p (i−1)<br />
⎢<br />
⎣ ⎢ π a (i−1) | b (i−1), p (i−1)<br />
( )<br />
( ) ,1<br />
β b<br />
α b<br />
⎫ ⎪ ⎤<br />
⎬ ⎥<br />
⎭ ⎪ ⎥<br />
⎦<br />
⎤<br />
⎥<br />
⎦ ⎥ ⇒ a (i+1) = y (i)<br />
else a (i+1) = a (i) . The other parameters, p and b, are not updated.<br />
3. Generate a random deviate for the parameter b:<br />
(A)
a. Generate a candidate random deviate,b (i) , from the proposal distribution<br />
2<br />
y (i) ~ N(b (i−1),4σ<br />
b).<br />
b. Sample<br />
u =U 0,1<br />
If u ≤ α(y (i),a (i),b (i−1), p (i−1)) =<br />
( )q b = y (i) |a (i), p (i−1)<br />
( )q b (i−1) |a (i),p<br />
(i−1)<br />
min π b = y ⎡<br />
(i) | a (i), p (i−1)<br />
⎢<br />
⎣ ⎢ π b (i−1) | a (i), p (i−1)<br />
( )<br />
( ) ,1<br />
⎤<br />
⎥<br />
⎦ ⎥ ⇒ b (i+1) = y (i)<br />
else b (i+1) = b (i) . The other parameters, p and a, are not updated.<br />
4. Generate a random deviate for the parameter p:<br />
a. Generate a candidate random deviate, p (i) , from the proposal distribution<br />
y (i) ~ U 0,1 .<br />
b. Sample<br />
u =U 0,1<br />
If u ≤ α(y (i),a (i),b (i),p (i−1)) =<br />
( )q p= y (i) | a (i),b<br />
(i)<br />
( )q p (i−1) | a (i),b<br />
(i)<br />
min π p = y ⎡<br />
(i) | a (i),b<br />
(i)<br />
⎢<br />
⎣ ⎢ π p (i−1) | a (i),b<br />
(i)<br />
( )<br />
( ) ,1<br />
⎤<br />
⎥<br />
⎦ ⎥ ⇒ p (i+1) = y (i)<br />
else p (i+1) = p (i) . The other parameters, a and b, are not updated.<br />
5. Steps 2-4 are repeated until a stationary sequence of samples<br />
x (i) is available<br />
Example<br />
Let the conditional priors on a and b be Weibull distributions with means μ a and μ b<br />
respectively. These statistical characteristics have some intuitive relationship <strong>to</strong> the<br />
<strong>Bayes</strong>ian concept of pseudo-successes and pseudo-failures. These parameters are<br />
variables input by the user depending on component his<strong>to</strong>rical information. For the<br />
following example, these parameters are assumed <strong>to</strong> be μ a =9.0 and μ b =1.0.<br />
SAND 2001-3513 24
Figure 10.a-b Results for Component <strong>Reliability</strong> Example<br />
Since there are two Weibull parameters, a second assumption is necessary. It will be<br />
assumed that the shape parameter, α, of both Weibull distributions is 3.5. From<br />
experience, the values of this parameter in the range [2.8-4.2] provide a consistent and<br />
stable response over a wide range of possible situations. For those situations where the<br />
component is considered <strong>to</strong> be very highly reliable, a shape parameter of 1.0 has also<br />
been found <strong>to</strong> be suitable.<br />
These two conditions can be combined <strong>to</strong> estimate the location parameter of the Weibull<br />
distribution via the relationship: βi = μi Γ( 1+1 αi). The standard deviation of a and b<br />
must also be found and can be calculated using the expression:<br />
2 2 2<br />
σi = β Γ<br />
α +1<br />
⎛ ⎞<br />
⎝ ⎠ − Γ2 1<br />
α +1<br />
⎡<br />
⎛ ⎞ ⎤<br />
⎢<br />
⎣<br />
⎝ ⎠ ⎥ . The standard deviation of both parameters is<br />
⎦<br />
approximately 0.316. Using the parameter means as initial starting values, Figures 10.a<br />
and 10.b depict the results for the parameters a and b during the course of 1000<br />
simulation runs. Figure 10.c is a plot of the observed component reliabilities π( p | a,b)<br />
over the 1000 simulations runs and Figure 10.d is the associated frequency his<strong>to</strong>gram.<br />
Figure 10.c-d Results for Component <strong>Reliability</strong> Example<br />
SAND 2001-3513 25
From this analysis, a point estimate for the component<br />
reliability can be estimated:<br />
N<br />
E[p] = ∑π (pi | a,b) N = 0.833, along with the<br />
i=1<br />
associated <strong>Bayes</strong> risk: σ p = 0.1102 . Based on the<br />
simulation results, a 10% lower confidence limit of<br />
0.68 and an upper 90% upper limit of 0.95 can be<br />
estimated for the component reliability.<br />
Stationarity<br />
A critical consideration when using any MCMC technique is the number of simulations<br />
required before stationarity is achieved. Given the above stage one and stage two<br />
distribution assumptions, the simulation process stabilizes very quickly. If instead of the<br />
mean values for a and b, arbitrary values had been chosen, the random process will still<br />
converge very fast as seen in Figures 11.a-b. In this case, initial values of 5.0 and 5.0<br />
were used for initial values and the process becomes provides useful simulation results<br />
after only approximately 25 simulations.<br />
<strong>System</strong> Level <strong>Analysis</strong> with Component Data<br />
Independent Failure Modes<br />
Before delving in the more complicated aspects of component interaction, a simple<br />
demonstration of the above approach will be provided. The system in question will be<br />
the simple 4 component system depicted in Figure 12.<br />
An estimate of the system reliability will be constructed by combining simulated<br />
component reliability estimates through a coherent system function:<br />
[ ]<br />
R c = φ(p) = p 1p 2 1− (1− p 3)(1− p 4)<br />
(Rc represents the reliability of the system based on component data, while Rs is defined<br />
as the system reliability based on system level data.) The vec<strong>to</strong>r of component<br />
Figure 11.a-b Results Using Extreme Initial Values<br />
Figure 12. Simple <strong>System</strong><br />
SAND 2001-3513 26
eliabilities, p, is generated using the MCMC algorithm discussed in the previous<br />
discussion. Each vec<strong>to</strong>r of simulated component reliabilities is transformed using the<br />
system structure function and a system reliability estimate is collected. The result is an<br />
estimate of the posterior distribution of the system reliability: π(R c |q,d) given his<strong>to</strong>rical<br />
information and current failure data on each of the components. As with the component<br />
analyses, point and interval estimates of Rc can be computed. Also available is an<br />
estimate of the <strong>Bayes</strong> risk associated with using the his<strong>to</strong>rical component failure<br />
information.<br />
The first stage prior for all for components is assumed <strong>to</strong> be Beta(a,b) and the second<br />
stage prior for all first stage parameters is assumed <strong>to</strong> be Weibull(α,β). The parameter<br />
values for the second stage priors are presented in Table 5. Given mean values for the<br />
parameters, and the assumption of a Weibull with shape parameter of 3.5, the location<br />
parameter for the Weibull can be easily found for each<br />
Component μa μb<br />
second stage prior. No his<strong>to</strong>rical data was assumed <strong>to</strong><br />
be available on any of the components.<br />
p1 1.60 0.18<br />
The 4C software analysis package was used <strong>to</strong><br />
complete the system level reliability analysis based on<br />
the component information. A his<strong>to</strong>gram of the<br />
reliabilities for each of the components is presented in<br />
Figures 13.a-d. Figure 14.a depicts the system<br />
reliability under the situation where no his<strong>to</strong>rical data<br />
is available. The best estimate of the system reliability<br />
is 0.68 with a <strong>Bayes</strong> risk of 0.195 and an 80 percent confidence interval of [0.39, 0.90].<br />
Figure 13.a-b Results for Components 1 and 2<br />
p2 9.10 1.01<br />
SAND 2001-3513 27<br />
p3<br />
18.19 4.27<br />
p4 3.94 0.92<br />
Table 5. First and Second<br />
Stage Parameters
In contrast, Figure 14.b depicts the situation where 10 tests were performed on<br />
component 1 and 9 successes observed. Combining this data with the prior beliefs about<br />
component one results in a new estimate of the system reliability of 0.74, a <strong>Bayes</strong> risk of<br />
0.133, and an 80 percent confidence interval of [0.57, 0.90]. The change in the estimated<br />
reliability is evident in Figure 14.b, but equally important is the increased confidence in<br />
this estimate that results from the additional test data.<br />
<strong>System</strong> and Component Data Aggregation<br />
Figure 13.c-d Results for Components 3 and 4<br />
It is often the case that testing is conducted at the system level and information regarding<br />
the failure or success of particular subsystems is not available or not collected. As noted<br />
previously in the discussion on data aggregation, care must be taken when interpreting<br />
system level test results and combining this information with component his<strong>to</strong>rical failure<br />
data.<br />
Figure 14.a-b Results for <strong>System</strong> Level Analyses<br />
SAND 2001-3513 28
In this effort, the system level posterior distribution function that results from combining<br />
component test information will be used as a prior distribution for the system level<br />
reliability analysis. Based on the previous discussion regarding the binomial testing of<br />
components:<br />
S<br />
g( ps | s) = KRs (1− Rs ) F g( ps )<br />
S<br />
∝ Rs (1− Rs ) F π (pc |q,d)<br />
where S and F are the system level<br />
successes and failures respectively.<br />
The posterior distribution function<br />
defined as a function of a set of<br />
parameters and data, now becomes the<br />
prior distribution for the system<br />
reliability:π( p c |q,d) ⇒ g( p s).<br />
This is generally available as a<br />
his<strong>to</strong>gram of M intervals constructed<br />
from the results of an analysis such as<br />
an MCMC simulation described<br />
above. To construct the his<strong>to</strong>gram of<br />
the system reliability based on both<br />
component and system data:<br />
G[ p i | S,F] =<br />
1<br />
B(S,F) p S<br />
i (1− pi ) F π( pi | q,d) i = 1,..., M<br />
The n th moment of the system reliability is then given by:<br />
n<br />
E[pS ] =<br />
1<br />
B(S,F)<br />
M<br />
n<br />
pi pi<br />
i=1<br />
∑<br />
S<br />
(1− pi ) F [ π(p i |q,d) ]<br />
and a point estimate and associated <strong>Bayes</strong> risk can be easily constructed (see Figure 15<br />
for the definition of π( p i | q,d) ).<br />
Example<br />
The 4C software was again used <strong>to</strong> incorporate system level failure data in<strong>to</strong> a reliability<br />
analysis of the simple system depicted in Figure 12. Results from a <strong>to</strong>tal of nine different<br />
test examples are presented including<br />
the base case where no component and<br />
no system test data are available.<br />
Significant differences between cases<br />
are highlighted in red. Figure 16<br />
depicts a typical prior probability<br />
density function for the reliability of a<br />
component for the base case. Typical<br />
sample prior distributions for the<br />
parameters a and b are presented in<br />
Figure 17. The resulting system<br />
Figure 15. Elements of Component His<strong>to</strong>gram<br />
Figure 16. Typical Component <strong>Reliability</strong><br />
Prior<br />
SAND 2001-3513 29
Figure 17. Typical Parameter Prior Density Functions<br />
reliability probability density function is depicted in Figure 18.<br />
Cases 2-4 illustrate how the assumption of prior information for each of the major types<br />
of components impacts the final system reliability estimate and the uncertainty in the<br />
reliability. (Note that the confidence in the reliability estimate is presented in terms of<br />
the variance of the reliability estimate or equivalently, the <strong>Bayes</strong> risk. As the variance in<br />
the reliability estimate decreases, the<br />
confidence in the estimate increases.)<br />
The consequences of data aggregation<br />
is investigated in cases 5-9. Cases 5-7<br />
illustrate the situation where a <strong>to</strong>tal of<br />
10 system level tests were conducted<br />
and failures were isolated <strong>to</strong> 2<br />
components. Case 5 involves the<br />
situation where all data is aggregated Figure 18. Typical <strong>System</strong> <strong>Reliability</strong><br />
<strong>to</strong> the system level for reliability<br />
estimation. Two different scenarios for failure observation are investigated in cases 6 and<br />
7: first, failures are observed on each of the parallel components, see Figure 19 for typical<br />
component reliabilities for case 6. Secondly, the failures were assumed <strong>to</strong> have all<br />
occurred on a single series unit. The variation in the reliability for these two cases in<br />
comparison <strong>to</strong> the system level results (case 5), highlights the need for extreme caution<br />
when using system level data for a reliability analysis. In particular, note the difference<br />
in the probability density functions for the system reliability illustrated in Figure 22.<br />
Finally, in case 8 test data is available only at the system level; due <strong>to</strong> instrumentation<br />
Component 1 2 3 4 <strong>System</strong> <strong>System</strong> Level<br />
Results<br />
data prior data prior data prior data prior data<br />
Case S F S F S F S F S F S F S F S F S F μ σ<br />
1 0 0 1 1 0 0 1 1 0 0 1 1 0 0 1 1 0 0 0.300 0.295<br />
2 0 0 5 5 0 0 1 1 0 0 1 1 0 0 1 1 0 0 0.216 0.200<br />
3 0 0 1 1 0 0 1 1 0 0 5 5 0 0 1 1 0 0 0.291 0.281<br />
4 0 0 1 1 0 0 1 1 0 0 1 1 0 0 1 1 5 5 0.481 0.143<br />
5 0 0 1 1 0 0 1 1 0 0 1 1 0 0 1 1 8 2 0.733 0.121<br />
6 10 0 1 1 10 0 1 1 9 1 1 1 9 1 1 1 0 0 0.744 0.158<br />
7 8 2 1 1 10 0 1 1 10 0 1 1 10 0 1 1 0 0 0.632 0.147<br />
8 0 0 1 1 0 0 1 1 0 0 1 1 0 0 1 1 3 0 0.761 0.174<br />
9 3 0 1 1 3 0 1 1 0 3 1 1 3 0 1 1 0 0 0.502 0.268<br />
Table 6. Results of 9 Sample Cases<br />
SAND 2001-3513 30
Figure 19. Typical <strong>System</strong> Reliabilities – Case 5 and Case 6<br />
costs it was not possible <strong>to</strong> collect component failure information during the flight test.<br />
This scenario is very typical in operational testing of air-<strong>to</strong>-ground missiles. In reality,<br />
there has been 3 component failures, all involving a component that is part of a redundant<br />
segment of the system. The reliability estimates that result from these two different cases<br />
is vastly different (0.761 versus 0.502).<br />
Correlated <strong>System</strong> Failure Modes<br />
A complicating fac<strong>to</strong>r in system reliability analyses is the possibility that various<br />
components of φ π( p1,p 2,K,pn |a,b, d)<br />
situations a system may have a number of possible failure modes that are statistically<br />
related <strong>to</strong> each other through the physics of system operation. To address this issue, a<br />
little known family of multivariate distributions will be introduced and subsequently<br />
applied.<br />
Bivariate Sarmanov Distribution<br />
[ ] may be statistically correlated. In more general<br />
In 1966 Sarmanov developed a bivariate family of distributions which have the capability<br />
of characterizing highly correlated random variables. Lee (1996) rediscovered this work<br />
and suggested its possible use in the area of <strong>Bayes</strong>ian analysis; the following discussion<br />
draws heavily from that paper.<br />
For the bivariate case, define the parameter vec<strong>to</strong>r q i, i =1,2 . Let π( p i |q) be univariate<br />
probability density functions and let ϕ(x i) be bounded, nonconstant functions where<br />
∫<br />
Figure 19. Typical Component Reliabilities – Case 6<br />
ϕ(pi ) f (pi )dpi = 0 . Then the function:<br />
π( p1, p2 | q1,q2,ω12) = π( p1 |q 1)π( p2 | q2) { 1 +ω12ϕ( p1)ϕ(p2) }<br />
is a bivariate joint density function with 1 +ω 12ϕ( p 1)ϕ(p 2) ≥ 0, for all pi . Note that a<br />
similarity measureω 12 = 0 implies that p1 and p2 are statistically independent. The<br />
SAND 2001-3513 31
correlation coefficient of p1 and p2 can be derived: ρ = ω12ν1ν 2<br />
where<br />
σ1σ 2<br />
+∞<br />
νi = ∫ piϕ(p i )π( pi |q)dp<br />
−∞<br />
i and σi is the standard deviation of pi.. The range of the<br />
similarity measureω12 can also be shown <strong>to</strong> be bounded:<br />
max −1 ⎛ −1 ⎞<br />
−1<br />
,<br />
⎝<br />
⎜<br />
μ1μ 2 (1− μ1)(1− μ2) ⎠<br />
⎟ ≤ ω12 ≤ min<br />
μ1(1− μ2) ,<br />
⎛<br />
−1 ⎞<br />
⎝<br />
⎜<br />
μ2(1− μ1) ⎠<br />
⎟<br />
If π( p i |q) is a beta distribution function and the mixing function is defined as<br />
ϕ i(x) = p i − E[p i], then the correlation coefficient simplifies <strong>to</strong>: ρ = ω 12σ 1σ 2 and the<br />
bounds on the similarity measure simplify <strong>to</strong>:<br />
−(a1 + b1 )(a2 + b2 )<br />
max( a1a 2 ,b1b 2 ) ≤ ω12 ≤ (a1 + b1 )(a2 + b2 )<br />
max( a1b2 ,a2b1 )<br />
Multivariate Sarmanov Distribution<br />
Lee (1996) also generalized the similarity relationship above <strong>to</strong> n dimensions. Define a<br />
relationship parameter<br />
R 123 (p 1 , p 2 , p 3 ) = ω 12 ϕ(p 1 )ϕ( p 2 ) +ω 13 ϕ( p 1 )ϕ(p 3 ) +<br />
ω 23 ϕ(p 2 )ϕ(p 3 ) + ω 123 ϕ( p 1 )ϕ(p 2 )ϕ( p 3 )<br />
where: ω123 = E[(p1 − μ1 )(p2 − μ 2 )( p3 − μ3 )]<br />
2 and μi = E[ pi]. Then<br />
2 2 σ1σ 2σ<br />
3<br />
3<br />
∏ 1 + R123 (p1 ,p2 , p3 )<br />
i=1<br />
π( p1 , p2 , p3 | q1q2q 3w) = π(p i |q 1q2q 3 ) { }.<br />
The expression can be generalized:<br />
π( p 1 , p 2 ,K, p n | q,w) = π( p i |q)<br />
Sampling <strong>Approach</strong><br />
n<br />
∏ 1+ R12Kn ( p1 , p2 ,K, pn )<br />
i=1<br />
{ }<br />
Generation of the set of system component reliabilities:<br />
⎧ ⎪<br />
π( pj | p1 ,K,p− j ,K, pn |q,w) = π(p j |q) ⎨<br />
⎩ ⎪<br />
1+ R 12K n (p 1 , p 2 ,K, p n )<br />
1+ R 12K(− j)n ( p 1 ,p 2 ,K, p − j ,K, p n )<br />
can be accomplished easily using the Metropolis-Hastings rejection sampling scheme.<br />
Note that π( p j |q) is a beta distribution and that since | R |≤1:<br />
⎧ ⎪<br />
⎨<br />
⎩ ⎪<br />
1 + R 12Kn ( p 1 , p 2 ,K,p n )<br />
1 + R 12K(− j)n ( p 1 , p 2 ,K, p − j ,K,p n )<br />
⎫ ⎪<br />
⎬ ≤ 2= M<br />
⎭ ⎪<br />
SAND 2001-3513 32<br />
⎫ ⎪<br />
⎬<br />
⎭ ⎪
A sample taken and accepted if:<br />
⎧ ⎪<br />
M ⋅U0,1 ≤ ⎨<br />
⎩ ⎪<br />
1+ R 12K n (p 1 , p 2 ,K,p n )<br />
1+ R 12K(− j)n (p 1 , p 2 ,K, p − j ,K,p n )<br />
Expert Elicitation <strong>to</strong> Construct Similarity Relationships<br />
Recall that the similarity measure can be defined in terms of the correlation coefficient:<br />
ω 12 = ρ 12 σ 1σ 2 . Some algebra results in the expression:<br />
( ) σ 1<br />
ω 12 = E[ p 1 | p 2 ]− E[ p 1 ]<br />
= Ω 12<br />
[ ]<br />
p 2 − μ 1<br />
[ ]<br />
2 p2 − E[p 1 ]<br />
Obviously the best approach <strong>to</strong> constructing the similarity measure is via an estimate of<br />
the correlation function based on actual test data. However, if specific data regarding the<br />
correlation between component reliability or failure modes is not available, the parameter<br />
2<br />
Ω12 = ( E[ p1 | p2] − μ1) σ1 can be constructed via expert elicitation of E[p1 | p2]; the<br />
expected values of p1 for given values of p2.<br />
These similarity measures might also be the result of expert elicitation using those<br />
techniques being developed at LANL and implemented in the PREDICT software<br />
package.<br />
Discussion<br />
The area of correlated failure modes and the merging of data from similar systems is a<br />
very fruitful area of discussion. There are many examples and situations where such an<br />
approach would be critical <strong>to</strong> making the most efficient use of the available test data. For<br />
this reason, discussion of specific examples is presented under a separate technical report<br />
<strong>to</strong> be released in the near future.<br />
Summary<br />
This report has provided a mathematical foundation for an approach <strong>to</strong> bring <strong>to</strong>gether<br />
data from a variety of sources and provided an approach <strong>to</strong> combine this data in a logical<br />
fashion. The application of this approach will result in an increased confidence in the<br />
reliability assessment of the nuclear weapons s<strong>to</strong>ckpile.<br />
The benefits of using a <strong>Bayes</strong>ian approach were very briefly reviewed and two<br />
alternatives <strong>to</strong> <strong>Bayes</strong>ian analysis were discussed. The hierarchical <strong>Bayes</strong> approach was<br />
suggested as having more widespread applicability and also reduced the sensitivity of the<br />
analysis <strong>to</strong> the assumptions regarding the statistical structure of the prior information.<br />
The fundamental aspects of Monte Carlo Markov Chain (MCMC) were reviewed<br />
including a brief discussion of the methods associated with Metropolis-Hastings and<br />
Gibbs sampling. A methodology for the application of MCMC methods <strong>to</strong> component<br />
reliability was outlined and applied <strong>to</strong> a simple example. The approach was extended <strong>to</strong><br />
allow the assessment of system reliability using both component prior information and<br />
component test data.<br />
SAND 2001-3513 33<br />
⎫ ⎪<br />
⎬<br />
⎭ ⎪ .
Finally, an approach <strong>to</strong> aggregating system level test data and component test data was<br />
developed and demonstrated through a sequence of test cases.<br />
The discussion and examples presented in this report have been limited <strong>to</strong> those systems<br />
composed of discrete components, i.e. those that can be characterized as operating or not<br />
operating. However, there is nothing unique about the underlying principles and the<br />
extension <strong>to</strong> continuous subsystem/systems is straightforward. In addition, an approach<br />
for considering the possibility of correlated failure modes was also developed. Further<br />
discussion and application of this approach is reserved for a future research report.<br />
References<br />
The references presented here are by no means exhaustive. There are simply those<br />
citations that were found <strong>to</strong> be particularly useful in the course of this investigation and<br />
are provided for those readers interested in additional detail. Topic area include: General<br />
<strong>Bayes</strong> – GB, Empirical <strong>Bayes</strong> – EB, <strong>Hierarchical</strong> <strong>Bayes</strong> – HB, Markov Chain Monte<br />
Carlo – MCMC, <strong>Bayes</strong>ian Test Planning – TP.<br />
Azaiez, M., V. Bier (1995), Perfect Aggregation for a Class of General <strong>Reliability</strong><br />
Models with <strong>Bayes</strong>ian Updating, Applied Mathematics and Computation, Vol. 73, pp<br />
281-302. (GB)<br />
Casella, G. (1985), An Introduction ot Empirical <strong>Bayes</strong> Data <strong>Analysis</strong>, The American<br />
Statistician, Vol. 39, No. 2, May. (EB)<br />
Casella, G., E. George (1992), Explaining the Gibbs Sampler, The American Statistician,<br />
Vol. 46, No. 3, August. (MCMC)<br />
Celeux, G., M. Persoz, J. Wandji, F. Perrot (1999), Using Markov Chain Monte Carlo<br />
Methods <strong>to</strong> Solve Full <strong>Bayes</strong>ian Modeling of PWR Vessel Flaw Distributions,<br />
<strong>Reliability</strong> Engineering and <strong>System</strong> Safety, December, Vol. 66, No. 3, pp. 243-252.<br />
(HB)<br />
Chib, S. E. Greenberg (1995), Understanding the Metropolis-Hastings Algorithm, The<br />
American Statistician, Vol. 49, No. 4, November. (MCMC)<br />
Deely, J., D. Lindley (1981), <strong>Bayes</strong> Empirical <strong>Bayes</strong>, Journal of the American Statistical<br />
Association, Vol. 76, No. 376, pp. 833-841. (EB)<br />
Effron, B., C. Morris, (1972), Limiting the Risk of <strong>Bayes</strong> and Empirical <strong>Bayes</strong> Estima<strong>to</strong>rs<br />
– Part II, Journal of the American Statistical Association, Vol. 67, pp. 117-130. (EB)<br />
Gelfland, A., A. Smith (1990), Sampling-Based <strong>Approach</strong>es <strong>to</strong> Calculating Marginal<br />
Densities, Journal of the American Statistical Society, Vol. 85, No. 410, June, pp.<br />
398-409. (MCMC)<br />
Gelman, A,J. Carlin, H. Stern, D. Rubin (2000), <strong>Bayes</strong>ian Data <strong>Analysis</strong>, Chapman and<br />
Hall/CRC Press, Boca Ra<strong>to</strong>n, FL. (GB, EB, HB, MCMC)<br />
Hastings, W. (1970), Monte Carlo Sampling Methods Using Markov Chains and Their<br />
Applications, Biometrika, Vol. 57, pp. 97-109. (MCMC)<br />
Jaynes, E. (1989), Clearing Up Mysteries – the Original Goal, Maximum Entropy and<br />
<strong>Bayes</strong>ian Methods, ed. J. Skilling, Kluwer, Dordrecht.<br />
Kass, R., D. Steffey (1989), Approximate <strong>Bayes</strong>ian Inference in Conditionally<br />
Independent <strong>Hierarchical</strong> Models (Parametric Empirical <strong>Bayes</strong> Models), Journal of<br />
the American Statistical Association, Vol. 84, No. 407, pp. 717-726. (EB)<br />
SAND 2001-3513 34
Knuth, D. E. (1973), The Art of Computer Programming, Vol. 1, Fundamental<br />
Algorithms, Addison-Wesley, Reading, MA. (MC)<br />
Lee, M.L-T (1996), Properties and Applications of the Sarmanov Family of Bivariate<br />
Distributions, Communications in Statistics - Theory and Methods, Vol. 25, No. 6, pp.<br />
1207-1222.<br />
Lynn, N. N. Singpurwalla, A. Smith (1998), <strong>Bayes</strong>ian Assessment of Network <strong>Reliability</strong>,<br />
SIAM Review, Vol. 40, No. 2, pp 202-227, June.<br />
Martz, H., R. Waller (1982), <strong>Bayes</strong>ian <strong>Reliability</strong> <strong>Analysis</strong>, John Wiley and Sons, New<br />
York. (GB, TP)<br />
Martz, H. R. Waller (1990), <strong>Bayes</strong>ian <strong>Reliability</strong> <strong>Analysis</strong> of Complex Series/Parallel<br />
<strong>System</strong>s of Binomial Subsystems and Components, Technometrics, Vol. 32, No. 4,<br />
pp.407-416. (GB)<br />
Martz, H., R. Waller, E. Fickas (1988), <strong>Bayes</strong>ian <strong>Reliability</strong> <strong>Analysis</strong> of Series <strong>System</strong>s of<br />
Binomial Subsystems and Components, Technometrics, Vol. 30, No. 2, pp. 143-154.<br />
(GB)<br />
Mastran, D. (1976), Incorporating Component and <strong>System</strong> Test Data In<strong>to</strong> the Same<br />
Assessment: A <strong>Bayes</strong>ian <strong>Approach</strong>, Operations Research, Vol. 24, No. 3, pp. 491-499.<br />
Mastran, D., N. Singpurwalla (1978), A <strong>Bayes</strong>ian Estimation of the <strong>Reliability</strong> of<br />
Coherent Structures, Operations Research, Vol. 26, No. 4, pp. 663-672. (GB)<br />
Morris, C. (1983), Parametric Empirical <strong>Bayes</strong> Inference: Theory and Applications,<br />
Journal of the American Statistical Association, Vol. 78, No. 381, pp. 47-65. (EB)<br />
Metropolis, N., A. Rosenbluth, M. Rosenbluth (1953), Equations of State Calculations by<br />
Fast Computing Machines, Journal of Chemical Physics, Vol. 21, pp.1087-1092.<br />
(MCMC)<br />
Ripley, B. D. (1987), S<strong>to</strong>chastic Simulation, Wiley and Sons, New York, NY (MC)<br />
Robbins, H. (1983), Some Thoughts on Empirical <strong>Bayes</strong> Estimation, The Annals of<br />
Statistics, Vol. 11, No. 3, pp. 713-723. (EB)<br />
Robinson, D. (1998), A Survey of Probabilistic Methods Used In <strong>Reliability</strong>, Risk and<br />
Uncertainty <strong>Analysis</strong>: Analytical Techniques I, SAND 98-1189, 1998.<br />
Rubenstein, R.(1981), Simulation and the Monte Carlo Method, Wiley and Sons, New<br />
York, NY, 1981. (MC)<br />
Sarmanov, O. (1966), Generalized Normal Correlation and Two-dimensional Frechet<br />
Classes, Doklady (Soviet Mathematics), Tom. 168, pp.596-599.<br />
Savchuk, V., C. Tsokos (1996), <strong>Bayes</strong>ian Statistical Methods With Applications <strong>to</strong><br />
<strong>Reliability</strong>, World Federation Publishers. (GB)<br />
Sivia, D. (1996), Data <strong>Analysis</strong>: A <strong>Bayes</strong>ian Tu<strong>to</strong>rial, Oxford University Press, Oxford,<br />
UK. (GB)<br />
Wilson, S., D. Taylor (1997), <strong>Reliability</strong> Assessment from Fatigue Micro-Crack Data,<br />
IEEE Transactions on <strong>Reliability</strong>, Vol. 46, No. 2, p165-172. (HB)<br />
Smith, A., G. Roberts (1993), <strong>Bayes</strong>ian Computation via the Gibbs Sampler and Related<br />
Markov Chain Monte Carlo Methods, Journal of the Royal Statistical Society, B, Vol.<br />
55, No. 1, pp. 3-23. (MCMC)<br />
SAND 2001-3513 35
Appendix A. Function Definitions<br />
Name Density Function Mean Variance<br />
Beta(a,b) 1<br />
B(a,b) pa −1 (1− p) b−1 0 < p < 1, a,b> 0<br />
Truncated<br />
Beta(a,b,p0,p1)<br />
Weibull(a,b) a<br />
b<br />
1<br />
B(a,b)( p 1 − p 0 ) a−1 (p − p 0 ) a−1 (p 1 − p) b−1<br />
⎛ x⎞<br />
⎝ b⎠<br />
a−1<br />
InvGam(a,b) b a<br />
⎛ 1⎞<br />
Γ(a) ⎝ x⎠<br />
0 ≤ p 0 < p ≤ p 1 < 1, a,b > 0<br />
exp − x ⎡ ⎛ ⎞<br />
⎢<br />
⎝ b⎠<br />
⎣ ⎢<br />
a +1<br />
a<br />
a<br />
a + b<br />
SAND 2001-3513 36<br />
⎤<br />
⎥<br />
⎦ ⎥<br />
x > 0, a,b > 0<br />
exp − b ⎛ ⎞<br />
⎝ x⎠<br />
, x,a,b> 0<br />
B(a,b) Γ(a + b)<br />
Γ(a)Γ(b) , Γ(n) = xn −1 e −x ∞<br />
∫ dx,<br />
0<br />
or if n is integer > 0, Γ(n) = (n − 1)!<br />
bΓ 1 ⎛ ⎞<br />
+ 1<br />
⎝ a<br />
b<br />
, a > 1<br />
a −1<br />
⎠ b 2 Γ 2 ⎡ ⎛<br />
⎢<br />
ab<br />
(a + b + 1)(a + b) 2<br />
⎞<br />
⎝<br />
+ 1<br />
a ⎠ − Γ2 1<br />
a +1<br />
⎛ ⎞ ⎤<br />
⎣<br />
⎝ ⎠ ⎥<br />
⎦<br />
b 2<br />
( a −1)<br />
2 , a > 2<br />
( a − 2)
Appendix B. Monte Carlo Sampling<br />
Monte Carlo Sampling<br />
For each random variable in a problem, a random deviate is chosen from the sampling<br />
probability density function. Using these values a vec<strong>to</strong>r of random inputs is constructed,<br />
X i . This vec<strong>to</strong>r of random deviates is used as parameter settings in system model and a<br />
system response, G, is calculated. A series of n sample vec<strong>to</strong>rs are generated,<br />
{X 1 ,K, X n }, and associated system response calculated until sufficient samples have been<br />
generated such that the analyst is confident that the uncertainty in the system response<br />
has been adequately characterized.<br />
The following discussion is extremely brief; there are scores of books dedicated <strong>to</strong> Monte<br />
Carlo sampling techniques. This section is included primarily for completeness and <strong>to</strong><br />
provide a basis for discussing variations on the Monte Carlo theme.<br />
Random Number Generation<br />
An essential element in any Monte Carlo scheme is the generation of random numbers.<br />
Knuth (1981) provides an excellent discussion, and the following is a brief look at only<br />
the more common approaches. It will be assumed that, as a minimum, the generation of<br />
uniformly distributed random deviates from the interval [0,1] is available. Notationally,<br />
these random deviates will be denoted: U0,1 . A random deviate from a Gaussian density<br />
function with mean μ and variance σ 2 will be denoted:<br />
N(μ,σ 2 ) .<br />
There are three fundamental methods for generating random numbers: inversion,<br />
transformation and rejection. Only a brief introduction <strong>to</strong> these methods will be<br />
presented; the reader is again referred <strong>to</strong> the many books on simulation, e.g. Ripley<br />
(1987) or Rubenstein (1981).<br />
Inversion<br />
Inversion is the most straightforward method of generating random numbers from a<br />
particular density function. This technique is based on the availability of the inverse<br />
cumulative density function for the density function of interest. For some probability<br />
density functions this is straightforward, as in the case of the exponential density. In<br />
other cases, such as the Gaussian probability density function, this inverse does not exist.<br />
Assume that the cumulative density function of the random variable is known,<br />
y = P{X ≤ x}= F(x). Since y can take on any value in the interval [0,1], it is a simple<br />
matter <strong>to</strong> generate a random value yi from<br />
xi = F −1 (U 0,1 ).<br />
Example<br />
U 0,1 and then solve:<br />
Given a random variable x with probability density and cumulative density functions:<br />
f (x) = λexp{−λx}<br />
F(x) = 1− exp{−λx} λ, x ≥ 0<br />
SAND 2001-3513 37
The inverse of the cumulative function is easily found:<br />
U0,1 , y is also distributed U0,1 . The above expression can be<br />
Since (1-y) is distributed<br />
simplified somewhat and a sequence of random variables from an exponential<br />
distribution can be generated by repeated application of:<br />
x i = F −1 (U 0,1 ) = − 1<br />
λ ln( U 0,1 )<br />
Transformation<br />
While the inversion method is extremely straightforward, it depends on the ease with<br />
which the inverse cumulative density function can be computed either analytically or<br />
numerically. In those cases where the inverse is not easily available, an alternative<br />
method for deviate generation is the transformation method. The basic idea behind the<br />
transformation method is <strong>to</strong> develop a function, which when applied <strong>to</strong> uniformly<br />
distributed random deviates, transforms these random variables in<strong>to</strong> deviates from the<br />
desired density function. The inverse method described above is, as might be suspected,<br />
a unique case of the transformation method.<br />
Assume a general two-dimensional case, where it is desired <strong>to</strong> generate a random number<br />
from the density function, f (x1 , x2 ) . This density function can be described as a result of<br />
the transformation:<br />
where<br />
( )<br />
( )<br />
f (x1 , x2 ) = g(y 1 , y2 ) ∂ y1 , y2 ∂ x1 , x2 g( y 1 , y 2 ) is some function of the new variables<br />
Jacobian of the transformation.<br />
y 1 , y 2 and<br />
( )<br />
( )<br />
∂ y 1 , y 2<br />
∂ x 1 , x 2<br />
is the<br />
Example<br />
The most famous application of the above approach is the Box-Muller method for<br />
generating random deviates from the Gaussian probability density function. Let y1 , y2 be independently distributed with density functions,<br />
therefore:<br />
x 1 = −2 ln( y 1) cos(2πy 2)<br />
x 2 = −2ln( y 1) sin( 2πy 2)<br />
y1 = exp − 1<br />
2 x ⎡<br />
⎢ 1<br />
⎣<br />
y2 = 1<br />
2π arctan x ⎡ ⎤ 2<br />
⎢ ⎥<br />
⎣ x1 ⎦<br />
The Jacobian is then:<br />
⎤<br />
2 2 ( + x2)<br />
⎥<br />
⎦<br />
U 0,1 . Define:<br />
SAND 2001-3513 38
( )<br />
( ) =<br />
∂ y 1 , y 2<br />
∂ x 1 , x 2<br />
⎡<br />
⎢<br />
⎣ ⎢<br />
1<br />
2π exp − x 2 ⎛ ⎞ ⎤ ⎡<br />
1<br />
⎜<br />
⎝ 2<br />
⎟ ⎥ ⎢<br />
⎠ ⎦ ⎥ ⎣ ⎢<br />
1<br />
2π exp − x 2 ⎛ ⎞ ⎤<br />
2<br />
⎜<br />
⎝ 2<br />
⎟ ⎥<br />
⎠ ⎦ ⎥<br />
which is just the product of two independent, standardized, Gaussian distributed random<br />
variables. Therefore, inputting two, independent random variables y1 , y2 from U0,1 , two<br />
independent, Gaussian distributed random variables,<br />
N 0,1 can be generated.<br />
Acceptance-Rejection Sampling<br />
Assume that we wish <strong>to</strong> generate a sample from a probability density function f (x), but<br />
for computational reasons the inversion or transformation methods are not practical.<br />
However, assume that a straightforward method exists for generating samples from a<br />
second, candidate probability density function g( x) where f (x) < Mg( x) and M is any<br />
scalar multiplier. Then <strong>to</strong> generate a sample from f (x) the following procedure can be<br />
used (see Figure B.1):<br />
1. generate a random deviate, x, from<br />
g( x)<br />
2. sample<br />
u =U 0,1<br />
3. Accept x as sample if<br />
else return <strong>to</strong> Step 1<br />
u <<br />
f (x)<br />
Mg( x)<br />
A small value of M is desired since the<br />
number of samples that must be generated<br />
until an acceptable sample is generated<br />
follows a geometric distribution with mean<br />
M. The efficiency of the algorithm is also Figure B.1. Rejection Sampling<br />
sensitive <strong>to</strong> the choice of g(x), i.e. the closer g(x) bounds f(x) the more efficient the<br />
sampling procedure.<br />
Example<br />
Given a random variable x with probability density function (Beta):<br />
f (x) = xα −1 β −1<br />
(1− x)<br />
α,β ≥1<br />
The bounding distribution, g(x) is distributed U0,1 . The multiplier is then defined:<br />
M = (α − 1)α −1 β −1<br />
(β − 1)<br />
α +β −2<br />
(α + β − 2 )<br />
The Metropolis-Hastings algorithm discussed in the main body is a variation of the above<br />
rejection sampling method. However, rather than accepting/rejecting x as independent<br />
samples from a desired distribution, the generated sample must depend on a previous<br />
value. The resulting set of samples constitutes a Markov process.<br />
SAND 2001-3513 39
Distribution<br />
1 MS 1407 R. J. Salzbrenner (1805)<br />
1 MS 0639 R. W. Lizut (2950)<br />
1 MS9033 A. J. West (2253)<br />
1 MS 9015 C. Knapp (2262)<br />
1 MS 0747 A. L. Camp (6410)<br />
1 MS 0747 G. D. Wyss (6410)<br />
1 MS 0747 R. G. Cox (6410)<br />
5 MS 0748 D. G. Robinson (6413)<br />
1 MS 0829 J. M. Sjulin (12323)<br />
1 MS 0405 T. R. Jones (12333)<br />
1 MS 0830 K. V. Diegert (12335)<br />
1 MS 1176 L. A. Swiler (15312)<br />
1 MS 9018 (8945-1) Central Technical Files<br />
1 MS0161 (11500) Patent and Licensing Office<br />
2 MS 0899 (9616) Technical Library<br />
1 MS 0612 (9612) Review & Approval Desk for<br />
DOE/OSTI<br />
TOTAL COPIES = 21<br />
SAND 2001-3513 40