Bulletin 1.pdf - California Department of Water Resources - State of ...
Bulletin 1.pdf - California Department of Water Resources - State of ...
Bulletin 1.pdf - California Department of Water Resources - State of ...

You also want an ePaper? Increase the reach of your titles
YUMPU automatically turns print PDFs into web optimized ePapers that Google loves.
CHAPTER I. INTRODUCTION<br />
WATER A MAJOR FACTOR IN CALIFORNIA ECONOMY<br />
Few convictions are more generally or more firmly fixed in the minds<br />
<strong>of</strong> the people <strong>of</strong> <strong>California</strong> than that our number one economic problem<br />
is to put to best use our invaluable water supply.<br />
Previous investigations have shown that this supply is adequate for<br />
a population much larger than the present 10,500,000, and that with<br />
additional storage and redistribution <strong>of</strong> water, most <strong>of</strong> the agricultural<br />
lands <strong>of</strong> the <strong>State</strong>, except only some desert and higher areas, can be<br />
serviced for irrigation as our expanding economy and human requirements<br />
justify the costs involved. Furthermore, without too great a sacrifice<br />
<strong>of</strong> reasonable needs, our multiple uses <strong>of</strong> water for domestic and<br />
municipal consumption, for agriculture, industry, power, recreation,<br />
and wild life preservation can be so coordinated as to achieve maximum<br />
benefits for the largest number <strong>of</strong> people.<br />
This bulletin presents the first results <strong>of</strong> new studies, under direction<br />
<strong>of</strong> the <strong>State</strong> <strong>Water</strong> <strong>Resources</strong> Board, aimed at a solution <strong>of</strong> this<br />
number one problem. It brings together in one volume the principal basic<br />
data regarding water in <strong>California</strong> that have been accumulated up to<br />
1947, thereby becoming an inventory <strong>of</strong> the water resources <strong>of</strong> the <strong>State</strong>.<br />
Concurrently with pr'eparafion <strong>of</strong> this inventory, work has progressed<br />
on the other principal phases <strong>of</strong> the program: determination <strong>of</strong> present<br />
use <strong>of</strong> water and <strong>of</strong> ultimate water requirement, and formulation <strong>of</strong><br />
"The <strong>California</strong> yvater Plan" to meet that requirement.<br />
NEED FOR AN INVENTORY OF WATER RESOURCES<br />
Several inventories <strong>of</strong> the water resources <strong>of</strong> <strong>California</strong> have been<br />
made in the past, but succeeding years have added to the basic records<br />
and generally to the knowledge <strong>of</strong> the water resources <strong>of</strong> the <strong>State</strong>. It<br />
is for this reason and because planning for the future must start with a<br />
thorough understanding <strong>of</strong> the location, amount, and quality <strong>of</strong> the<br />
waters <strong>of</strong> the <strong>State</strong>, and <strong>of</strong> physical conditions which determine their<br />
occurrence and availability, that the <strong>State</strong> <strong>Water</strong> <strong>Resources</strong> Board was<br />
authorized by the Legislature to make this state-wide investigation.<br />
AUTHORITY AND FUNDS FOR INVESTIGATION<br />
The <strong>State</strong> <strong>Water</strong> <strong>Resources</strong> Act <strong>of</strong> 1945, as amended by Chapter<br />
908, Statutes <strong>of</strong> 1947, invested in the <strong>State</strong> <strong>Water</strong> <strong>Resources</strong> Board broad<br />
powers to initiate and conduct investigations <strong>of</strong> the water resources <strong>of</strong><br />
the <strong>State</strong>. Section 17 (a) <strong>of</strong> the amended act reads as follows:<br />
"The <strong>Water</strong> <strong>Resources</strong> Board is authorized to conduct investigations<br />
<strong>of</strong> the water resources <strong>of</strong> the <strong>State</strong>; to formulate plans for<br />
the control, conservation, protection, and utilization <strong>of</strong> such water<br />
resources, including solutions for the water problems <strong>of</strong> each portion<br />
<strong>of</strong> the <strong>State</strong> as deemed expedient and economically feasible; and to<br />
render reports thereon. "<br />
( 17 )
18 WATER RESOURCES OF CALIFORXIA<br />
Chapter 1541, Statutes <strong>of</strong> 1947, appropriated $140,000 to the board<br />
lor expenditure during the I
WATER RESOURCES OF CALIFORNIA 21<br />
<strong>Department</strong> <strong>of</strong> Public Works, pursuant to Divisions 1 and 2 <strong>of</strong> the <strong>State</strong><br />
<strong>Water</strong> Code (formerly the <strong>Water</strong> Commission Act). In contrast with<br />
either a riparian right to surface water or an overlying right to ground<br />
water, an appropriative right is created by use and is lost by nonuse.<br />
The opposing riparian doctrine as now established in <strong>California</strong> consists<br />
<strong>of</strong>the old common law rule, as modified by <strong>California</strong> court decisions,<br />
and particularly by Section 3 <strong>of</strong> Article XIV <strong>of</strong> the <strong>State</strong> Constitution<br />
adopted in 1928, and decisions following and applying it. rnder this<br />
doctrine, a riparian landowner is entitled to a reasonable use <strong>of</strong> water<br />
correlative with all other riparian owners bordering on the same stream,<br />
lake, or watercourse, except that all the water may be consumed by an<br />
upper riparian owner if necessary for domestic use. The <strong>State</strong> Supreme<br />
Court in a line <strong>of</strong> decisions between 1886, Lux v. Haggin and 1927 Herminghau$<br />
v. Southern <strong>California</strong> Eduon Co., vacillated between strict<br />
application and liberalization <strong>of</strong> the old common law rule. The harsh construction<br />
<strong>of</strong> the rule in the latter case brought about a general demand<br />
for modification. The result was adoption <strong>of</strong> the constitutional amendment<br />
<strong>of</strong> 1928. This amendment, which has repeatedly been upheld by the<br />
courts <strong>of</strong> the <strong>State</strong>, imposed reasonable and beneficial use on riparian as<br />
well as other water users. It provides as follows:<br />
"Sec. 3. It is hereby declared that because <strong>of</strong> the conditions<br />
prevailing in this <strong>State</strong> the general welfare requires that the water<br />
resources <strong>of</strong> the <strong>State</strong> be put to beneficial use to the fullest extent <strong>of</strong><br />
which they are capable, and that the waste or unreasonable use or<br />
unreasonable method <strong>of</strong> use <strong>of</strong> water be prevented, and that the conservation<br />
<strong>of</strong> such waters is to be exercised with a view to the reasonable<br />
and beneficial use there<strong>of</strong> in the interest <strong>of</strong> the people and for<br />
the public welfare.<br />
" The right to water or to the use or flow <strong>of</strong> water in or from any<br />
natural stream or water course in this <strong>State</strong> is and shall be limited<br />
to such water as shall be reasonably required for the beneficial use to<br />
be served, and such right does not and shall not extend to the waste<br />
or unreasonable use or unreasonable method <strong>of</strong> use or unreasonable<br />
method <strong>of</strong> diversion <strong>of</strong> water. Riparian rights in a stream or water<br />
course attach to, but to no more than so much <strong>of</strong> the flow there<strong>of</strong> as<br />
may be required or used consistently with this section, for the purpose<br />
for which such lands are, or may be made adaptable, in view <strong>of</strong><br />
such reasonable and beneficial uses; provided, however, that nothing<br />
herein contained shall be construed as depriving any riparian owner<br />
<strong>of</strong> the reasonable use <strong>of</strong> water <strong>of</strong> the stream to which his land is<br />
riparian under reasonable methods <strong>of</strong> diversion and use, or <strong>of</strong> depriving<br />
any appropriator <strong>of</strong> water to which he is lawfully entitled. This<br />
section shall be self-executing, and the Legislature may also enact<br />
laws in the furtherance <strong>of</strong> the policy in this section contained. "<br />
In 1935, the Supreme Court <strong>of</strong> <strong>California</strong> in the case <strong>of</strong> Peabody v.<br />
City <strong>of</strong> Vallejo, 2 Cal.2d 351, fully approved and upheld the constitutional<br />
amendment, saying in part as follows:<br />
"The limitations and prohibitions <strong>of</strong> the constitutional amendment<br />
now apply to every water right and every method <strong>of</strong> diversion.<br />
Epitomized the amendment declares:<br />
"1. The right to the use <strong>of</strong> water is limited to such water as<br />
shall be rt>asonably rt>quired for the beneficial use to be served.
22 WATER RESOURCES OF CALIFORSIA<br />
"2. Such right does not extend to the waste <strong>of</strong> water.<br />
"3. Such right does not extend to unreasonable use or unreasonable<br />
method <strong>of</strong> use or unreasonable method <strong>of</strong> diversion <strong>of</strong> water.<br />
"4. Riparian rights attach to, but to no more than so much <strong>of</strong><br />
the flow as may be required or used consistently with this section <strong>of</strong><br />
the Constitution.<br />
"The foregoing mandates are plain, they are positive, and admit<br />
<strong>of</strong> no exception. The;r apply to the use <strong>of</strong> all water, under whatever<br />
right the use may be enjoyed. The problem is to apply these rules in<br />
the vaIJ-ing circumstances <strong>of</strong> cases as the;r arise. "<br />
During the last few years quality <strong>of</strong> water has become a matter <strong>of</strong><br />
vital concern to some areas <strong>of</strong> the <strong>State</strong>. Ithas long been common practice<br />
to discharge various sewage and industrial wastes into water sources and<br />
onto the land, thereby <strong>of</strong>ten impairing the quality <strong>of</strong> surface and ground<br />
water supplies. Local communities have made some efforts to cope with<br />
the problems thus created, but without great success. The need for effective<br />
action was finally brought sharply into focus by the tremendous<br />
expansion in industrial development during and since World War II.<br />
An increase in population <strong>of</strong> about 4,000,000 in the last decade intensified<br />
pollution damage, and the ever increasing threat to the quality <strong>of</strong><br />
their water supplies became a matter <strong>of</strong> grave anxiety to water users.<br />
As a result, under provisions <strong>of</strong> a series <strong>of</strong> laws enacted by the Legislature<br />
in 1949, the <strong>State</strong> has recognized the continuing threat <strong>of</strong> water pollution<br />
and assumed responsibility for maintaining the quality <strong>of</strong> its water<br />
resources. These acts created nine regional water pollution control boards<br />
and one state board, and endowed them with broad powers to control<br />
water pollution.<br />
THE CAUFORNIA WATER PROBLEM<br />
The over-all water problem <strong>of</strong> <strong>California</strong> is made up <strong>of</strong> many interrelated<br />
problems, some <strong>of</strong> which are mainly local while others are statewide<br />
in implication. Prior to the time when the southern part <strong>of</strong> <strong>California</strong><br />
had to turn to the Colorado River, and until rapidly receding<br />
ground waters in southern San Joaquin Valley brought about initiation<br />
<strong>of</strong> the Central Valley Project, water needs were met in most instances<br />
by some form <strong>of</strong> local action. It is now generally realized, however, that<br />
a greater measure <strong>of</strong> state leadership and participation in planning and<br />
construction is required if the water resources <strong>of</strong> <strong>California</strong> are to be<br />
properly controlled and utilized to meet rapidly increasing needs <strong>of</strong><br />
the people.<br />
From a state-wide point <strong>of</strong> view, redistribution <strong>of</strong> the water supply<br />
from areas <strong>of</strong> surplus to areas <strong>of</strong> deficiency provides the greatest challenge,<br />
especially in the northern and central portions <strong>of</strong> <strong>California</strong>. About<br />
two-thirds <strong>of</strong> the water is in the northern third <strong>of</strong> the <strong>State</strong>, whereas the<br />
greater demands--agricultural, industrial, and municipal-are in the<br />
central and southern portions. The solution <strong>of</strong> such a geographical problem<br />
must involve transportation and exchange <strong>of</strong> water, generally from<br />
north to south. It must include construction <strong>of</strong> surface storage reservoirs<br />
and utilization <strong>of</strong> the great ground water storage capacity <strong>of</strong> the valleys<br />
for regulating stream flow. Multiple-purpose basin and trans-basin developments<br />
will be required, involving many complex technical, financial,
24 WATER RESOURCES OF CALIFORKIA<br />
No. 31 discussed briefly the plans for diversion and transmission <strong>of</strong><br />
Colorado River water to the South Coastal Basin under the project <strong>of</strong><br />
the Metropolitan <strong>Water</strong> District <strong>of</strong> Southern <strong>California</strong>.<br />
OBJECTIVE OF STATE-WIDE WATER RESOURCES INVESTIGATION<br />
Although investigations that led to the <strong>State</strong> <strong>Water</strong> Plan were conceived<br />
as comprehensive and state-wide, they were never completed in<br />
that pattern. All phases were not considered for certain areas <strong>of</strong> the <strong>State</strong>,<br />
and important projects were omitted and left for future study. Furthermore,<br />
although adopted by the Legislature in 1941, the plan was formulated<br />
in 1930 and was based on investigations and studies conducted in<br />
the preceding decade. Since 1930 the population <strong>of</strong> <strong>California</strong> has almost<br />
doubled, and the need for flood control, water conservation, and power<br />
has more than kept pace with population and industrial growth.<br />
Objective <strong>of</strong> the current state-wide water resources investigation is,<br />
therefore, the preparation <strong>of</strong> a revised and more complete plan for the<br />
fullest conservation, control, and utilization <strong>of</strong> the water resources <strong>of</strong><br />
<strong>California</strong>, both surface and underground, to meet present and future<br />
water needs for all beneficial purposes and uses in all areas <strong>of</strong> the <strong>State</strong>,<br />
so far as is practicable. This plan has been dt'signated "The <strong>California</strong><br />
<strong>Water</strong> Plan."<br />
SCOPE OF BUUETlN<br />
The present bulletin-the first <strong>of</strong> four to be concerned with preparation<br />
<strong>of</strong> the <strong>California</strong> <strong>Water</strong> Plan-comprises an inventory <strong>of</strong> the water<br />
resources <strong>of</strong> the <strong>State</strong>. As the state-wide water resources investigation<br />
progresses, this bulletin will be followed by others concerned with present<br />
utilization and ultimate water requirement in <strong>California</strong>, the <strong>California</strong><br />
<strong>Water</strong> Plan for development <strong>of</strong> the water resources <strong>of</strong> the <strong>State</strong> to meet<br />
the ultimate requirement, and finally a summary <strong>of</strong> the t'arlier bulletins<br />
and restatement <strong>of</strong> the <strong>California</strong> <strong>Water</strong> Plan.<br />
This bulletin outlines and describes the drainage basins <strong>of</strong> <strong>California</strong><br />
by major hydrographic areas. with a summary <strong>of</strong> "mountain and foothill"<br />
and "valley and mesa" lands. It discusses conditions relating to<br />
precipitation and run<strong>of</strong>f, on a state-wide basis, and contains estimates <strong>of</strong><br />
the probable frequency <strong>of</strong> floods on principal streams. Since this bulletin<br />
comprises an inventory <strong>of</strong> the water resources <strong>of</strong> the <strong>State</strong>, it includes<br />
available records <strong>of</strong> precipitation and run<strong>of</strong>f at most stations or points<br />
<strong>of</strong> measurement, and records or estimates <strong>of</strong> the natural flow <strong>of</strong> streams<br />
<strong>of</strong> all drainage basins. Finally, it summarizes available data regarding<br />
quality and suitability for beneficial uses <strong>of</strong> both the surface and underground<br />
waters <strong>of</strong> <strong>California</strong>.<br />
Consideration is given to the principal sources <strong>of</strong> ground waters <strong>of</strong><br />
the <strong>State</strong>. These consist <strong>of</strong> surface inflow from mountain and foothill<br />
lands tributary to ground water basins, and precipitation on valley and<br />
mesa lands overlying the basins. However, subsurface inflow from tributary<br />
drainage basins is not included in the present inventory. Subsurface<br />
inflow is known to be locally significant in certain underground basins,<br />
but in most tributary drainage areas the soil mantle is either nonwaterbearing,<br />
or too thin to transmit appreciable subsurface flow. On a statewide<br />
basis, the aggregate <strong>of</strong> such flow is small compared. with recharge <strong>of</strong><br />
ground water basins from surface run<strong>of</strong>f and from precipitation on overlying<br />
lands.
WATER RESOURCES OF CALIFORNIA<br />
RELATED SUBJECTS<br />
For reasons later indicated, certain subjects relating in various<br />
degree to the water resources <strong>of</strong> <strong>California</strong> have been excluded from the<br />
scope <strong>of</strong> this bulletin.<br />
The relatively large water storage capacity <strong>of</strong> valley fills in <strong>California</strong><br />
comprises one <strong>of</strong> the more important natural resources <strong>of</strong> the<br />
<strong>State</strong>, its great value stemming from its natural regulation and conservation<br />
<strong>of</strong> precipitation and run<strong>of</strong>f. However, ground water storage<br />
capacity in itself is not an additional water resource, and has not been<br />
evaluated in the present inventory. It is briefly discussed in the ensuing<br />
section, "Natural Regulation <strong>of</strong> <strong>Water</strong> <strong>Resources</strong>."<br />
Recent technological advances have called attention to sea water<br />
conversion and to cloud seeding as possible means <strong>of</strong> adding to the water<br />
resources <strong>of</strong> <strong>California</strong>. Similarly, reclamation <strong>of</strong> sewage and waste<br />
waters for beneficial use, which already has been accomplished in certain<br />
instances, is under discussion and investigation. Possible augmentation<br />
<strong>of</strong> the water resources <strong>of</strong> the <strong>State</strong> by these methods has not been considered<br />
in the present inventory. However, the three methods are briefly<br />
discussed in ensuing sections, and a tentative evaluation <strong>of</strong> potential<br />
reclamation <strong>of</strong> sewage and waste water is contained in an appendix to<br />
this bulletin.<br />
Natural Regulation <strong>of</strong> <strong>Water</strong> <strong>Resources</strong><br />
The extensive ground water basins <strong>of</strong> <strong>California</strong> provide natural<br />
regulation for run<strong>of</strong>f from tributary mountain and foothill drainage<br />
areas, and for precipitation directly on overlying mesa and valley floor<br />
lands. More than half <strong>of</strong> the <strong>State</strong>'s water presently utilized on irrigated<br />
lands, and for domestic, municipal, and industrial purposes, is regulated<br />
in ground water basins.<br />
Additional natural regulation <strong>of</strong> water resources would be provided<br />
if presently unused ground water storage capacity were utilized to the<br />
full extent <strong>of</strong> safe yield <strong>of</strong> the ground water basins. Furthermore, as<br />
additional surface water supplies are developed and made available for<br />
storage in ground water basins, safe yield <strong>of</strong> the underground reservoirs<br />
will be increased. Under ultimate development <strong>of</strong> water resources in the<br />
<strong>State</strong>, the maximum amount <strong>of</strong> firm water could be made available on<br />
demand through operation <strong>of</strong> surface reservoirs on an average yield<br />
basis in conjunction with cyclic underground storage. Such coordinated<br />
operation would necessitate an adequate supply <strong>of</strong> energy to pump<br />
ground water in a series <strong>of</strong> dry years.<br />
Usability <strong>of</strong> a ground water basin as a natural regulator <strong>of</strong> water<br />
resources is dependent upon method and rate <strong>of</strong> replenishment <strong>of</strong> stored<br />
water, as well as extraction from the basin for beneficial use. The largest<br />
bodies <strong>of</strong> usable ground water storage capacity in <strong>California</strong> are in the<br />
Sacramento and San Joaquin Valleys in the Central Valley Area. Other<br />
important natural regulators <strong>of</strong> lesser magnitude are those in Santa<br />
Clara, Napa, Santa Rosa, and Livermore Valleys, and the Niles Cone in<br />
the San Francisco Bay Area; the Pajaro, Salinas, Santa Maria, and Santa<br />
Ynez River Basins in the Central Coastal Area ; the Ventura, Santa Clara,<br />
Los Angeles, San Gabriel, and Santa Ana River Basins in the South<br />
Coastal Area; Antelope, Owens, and Mojave Valleys in the Lahontan<br />
Area; and the Coachella Valley in the Colorado Desert Area.<br />
25
WATER RESOURCES OF CALrFORNIA 27<br />
and ground water basins are available for development to conserve a substantial<br />
portion <strong>of</strong> such run<strong>of</strong>f.<br />
An important phase <strong>of</strong> sea water conversion is the power needed<br />
for its accomplishment. Firm water from this source in quantity commensurate<br />
with requirements would call for a large and unfailing supply<br />
<strong>of</strong> power. Hence the question arises as to the advisability <strong>of</strong> depleting oil<br />
and natural gas resources <strong>of</strong> the <strong>State</strong> for such purpose. No surplus hydroelectric<br />
power is now available, and none is likely to be available in the<br />
future. Harnessing <strong>of</strong> other possible power sources such as wind, tides,<br />
or solar or nuclear energy on an economic basis seems only remotely<br />
possible.<br />
Other obstacles encountered in sea water conversion include corrosion<br />
<strong>of</strong> equipment and the excessive scale-forming property <strong>of</strong> sea<br />
water. These and the other difficulties eliminate sea water conversion from<br />
present consideration as a solutiou <strong>of</strong> the <strong>California</strong> water problem.<br />
Cloud Seecling<br />
Cloud seeding, or "milking," to produce precipitation or to dissipate<br />
threatening hailstorms and downpours has been undertaken by several<br />
agencies in different parts <strong>of</strong> the United <strong>State</strong>s since World War II with<br />
rather impressive results. In some experiments clouds were bombed with<br />
dry ice and strafed with silver iodide from a plane flying in and over the<br />
clouds. In New Mexico experiments were made on the ground by feeding<br />
silver iodide into a hydrogen flame that burned at about 2500 degrees F.<br />
It is claimed the invisible silver iodide vapor makes nuclei around which<br />
raindrops and snowflakes are formed.<br />
It appears that dry ice and silver iodide are effective only on clouds<br />
that are supercooled, but, except in winter, such clouds are scarce in <strong>California</strong>.<br />
In the Rogue River Valley in Oregon a new substance, designated<br />
"Element X, " was used iu the summer <strong>of</strong> 1949 in an effort to control hail<br />
damage to fruit crops by dissipating storm clouds en route to the area<br />
It is claimed that Element X works on "hot clouds, " where dry ice and<br />
silver iodide would be ineffective.<br />
In 1950 New Mexico inaugurated at the School <strong>of</strong> Mines in Socorro<br />
the first state-fostered rainmaking study project. Objective <strong>of</strong> the study<br />
is to determine the relative effectiveness and stability <strong>of</strong> several cloudseeding<br />
materials, and to find methods <strong>of</strong> dispersing such materials that<br />
might spread great distances and cause damage.<br />
The <strong>State</strong> <strong>Water</strong> <strong>Resources</strong> Board believes that exploration <strong>of</strong> this<br />
new field <strong>of</strong> activity has reached a stage where it should receive <strong>of</strong>ficial<br />
recognition and the aid, protection, and supervision <strong>of</strong> the <strong>State</strong>.<br />
Reclamation 01 Sewage and Waste <strong>Water</strong>s<br />
Study <strong>of</strong> large scale sewage reclamation in <strong>California</strong> is a relatively<br />
new field in which advances are being made, particularly in the San<br />
Francisco Bay and South Coastal Areas. The term "sewage," as herein<br />
used, is defined as liquid wastes flowing in sewers from residences, business<br />
buildings, institutions, and industrial establishments, with such<br />
ground, surface, and storm waters as may be admitted to or find their<br />
way into the sewers.<br />
Many sewage treatment plants are so designed as to be capable <strong>of</strong><br />
converting sewage into a stable, in<strong>of</strong>fensive, and sterile eftluent. However,<br />
knowledge <strong>of</strong> the quality and quantity <strong>of</strong> sewage available for
28 WATER RESOURCES OF CALIFORNIA<br />
reclamation is necessary for planning and designing the various features<br />
<strong>of</strong> the reclamation process. Domestic sewage may be <strong>of</strong> snfficiently good<br />
mineral quality to be reclaimable for irrigation and industrial uses. By<br />
contrast, sewage containing certain industrial wastes may be highly<br />
mineralized and not acceptable for irrigation. Mineral solubles from<br />
industrial sources are especially harmful when composed <strong>of</strong> high salt<br />
concentrations.<br />
Investigation <strong>of</strong> the feasibility <strong>of</strong> reclaiming and utilizing sewage<br />
is recognized as a phase in planning for complete or ultimate development<br />
<strong>of</strong> the water resources <strong>of</strong> <strong>California</strong>. However, because <strong>of</strong> presently<br />
unsolved problems in the reclamation and utilization process, and lack<br />
<strong>of</strong> reliable data on quantity <strong>of</strong> sewage available and its quality, sewage<br />
has not been considered in this bulletin as a primary water resource <strong>of</strong><br />
the <strong>State</strong>.<br />
Tentative evaluations <strong>of</strong> potential sources <strong>of</strong> reclaimable sewage<br />
and waste waters in the San Francisco Bay and South Coastal Areas,<br />
with respect to both quantity and quality, are included in this bulletin<br />
as Appendix A, "Reclamation <strong>of</strong> Sewage and Waste <strong>Water</strong>s." Flow data<br />
presented are limited to total quantities measured or estimated at points<br />
<strong>of</strong> outfall to San Francisco Bay Or the Pacific Ocean, and in all cases pertain<br />
to dry weather flow exclusive <strong>of</strong> storm waters.<br />
Disposal <strong>of</strong> sewage onto lands overlying underground basins and<br />
into inland streams augments ground water replenishment and stream<br />
flow. Sewage so disposed <strong>of</strong> is generally recoverable for re-use by natural<br />
processes <strong>of</strong> reclamation, and is not considered in Appendix A.
CHAPTER II. SUMMARY<br />
The purpose <strong>of</strong> this chapter is to outline the nature <strong>of</strong> the investigation<br />
reported, to describe briefly the physical conditions that govern<br />
occurrence, quantity, and quality <strong>of</strong> the water resources <strong>of</strong> <strong>California</strong>,<br />
and to summarize for the <strong>State</strong> as a whole, statistical and other information<br />
presented and discussed by major hydrographic Areas in succeeding<br />
chapters. Plate 1, "Map <strong>of</strong> <strong>California</strong>," has been included to assist in<br />
following the presentation. It has been placed inside the back cover for<br />
convenience <strong>of</strong> use.<br />
MAJOR HYDROGRAPHIC AREAS<br />
The <strong>State</strong> has been divided into seven Areas, numbered from 1 to 7,<br />
which generally coincide with major hydrographic divisions. The portion<br />
<strong>of</strong> the <strong>State</strong> included within each Area and the names by which the<br />
Areas are designated are :<br />
1. Borth Ooasta.l Area. Lower Klamath Lake and Lost River<br />
Basins, and all basins draining into the Pacific Ocean from the <strong>California</strong><br />
Oregon state line southerly to the northern boundary <strong>of</strong> Lagunitas Creek<br />
Basin in Marin County.<br />
2. SaD Franciaeo Bay Area. All basins draining into San Francisco,<br />
San Pablo, and Suisun Bays, and into Sacramento River downstream<br />
from Collinsville; Winter and Browns Islands in Contra Costa<br />
County; basins west <strong>of</strong> the eastern boundary <strong>of</strong> Kirker Creek Basin in<br />
Contra Costa County; and basins directly tributary to the Pacific Ocean<br />
from the northern boundary <strong>of</strong> Lagunitas Creek Basin to the southern<br />
boundary <strong>of</strong> Pescadero Creek Basin, in San :Mateo and Santa Cnu;<br />
Counties.<br />
3. Central Coastal.Area. All basins draining into the Pacific<br />
Ocean from the southern boundary <strong>of</strong> Pescadero Creek Basin in Santa<br />
Cruz County, to the southeastern boundary <strong>of</strong> Rincon Creek Basin in<br />
the western part <strong>of</strong> Ventura County.<br />
4. South Coastal Area. All basins draining into the Pacific Ocean<br />
from the southeastern boundary <strong>of</strong> Rincon Creek Basin to the <strong>California</strong><br />
Mexico boundary.<br />
5. Central Valley Area. All basins draining into the Sacramento<br />
and San Joaquin Rivers above the eastern boundary <strong>of</strong> the San Francisco<br />
Bay Area near Collinsville, including Goose Lake Basin in Modoc<br />
County.<br />
6. Lahontan Area. All basins east <strong>of</strong> the Santa Ana and Los<br />
Angeles River Basins and aU basins east <strong>of</strong> the Central Valley Area,<br />
between the <strong>California</strong>-Oregon boundary and the southern boundary <strong>of</strong><br />
basins draining into Antelope Valley and Mojave River, and into Dry<br />
Lake Basin near the <strong>California</strong>-Nevada line north <strong>of</strong> Ivanpah.<br />
7. Colorado Desert.Area. All basins east <strong>of</strong> the South Coastal<br />
Area that drain into the Colorado River within <strong>California</strong>; also Salton<br />
Sea Basin and local sinks between the southern boundary <strong>of</strong> the Lahontan<br />
Area and the <strong>California</strong>-Mexico boundary.<br />
(29 )
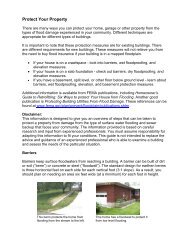
WEATHER STATION AT SHASTA RESERVOIR<br />
(U. S. Em'eau <strong>of</strong> Reclamation Photo)
WATER RESOURCES OF CALIFORNIA 41<br />
areas. It occurs principally in the desert regions, especially in the<br />
Lahontan and Colorado Desert Areas and in adjacent portions <strong>of</strong> the<br />
Central Valley and South Coastal Areas. Analyses <strong>of</strong> floods caused by<br />
cloudbursts are not included in this bulletin, since sufficient data with<br />
reference to areal extent and frequency <strong>of</strong> occurrence are not available.<br />
Those rainstorms in <strong>California</strong> which produce floods not associated<br />
with cloudbursts are general and cover large areas. In nearly all cases<br />
they occur during winter and early spring, and may last several days,<br />
although periods <strong>of</strong> intense rainfall are comparatively short. While<br />
general storms are common during the rainy season, destructive floods<br />
are only infrequently produced. To cause a major flood the storm must<br />
either be <strong>of</strong> long duration, or must occur while watersheds are saturated<br />
and little channel storage space is available. The combination <strong>of</strong> a<br />
saturated watershed and such a storm is rare.<br />
Estimated magnitudes <strong>of</strong> mean daily flows <strong>of</strong> rainwater floods with<br />
probable frequencies <strong>of</strong> once in 100 years and once in 250 years on seven<br />
representative streams in the <strong>State</strong> are given in Table 5. This table also<br />
shows maximum instantaneous recorded flows on these streams, including<br />
preliminary estimates for the floods <strong>of</strong> November, 1950, where applicable.<br />
No estimates are given for streams in the Colorado Desert Area, as :floods<br />
in this Area are mainly <strong>of</strong> the cloudburst type.<br />
Snowfloods<br />
Floods resulting from melting snow occur in streams that drain the<br />
higher mountains <strong>of</strong> the <strong>State</strong>, and characteristically have longer duration<br />
and lower peak :flows than rainwater floods. Data relating to daily<br />
flow for one, two, three, five or even ten days have little significance in<br />
these floods. In the present investigation snow-melt season from April<br />
to July, inclusive, has been considered as one :flood period, and total<br />
volume <strong>of</strong> flow has been computed for these four months. Volumes <strong>of</strong><br />
BIlOW melt were determined for those 13 streams <strong>of</strong> the Sierra Nevada on<br />
which have occurred the greatest snow-melt :floods experienced in the <br />
<strong>State</strong>. Nine <strong>of</strong> the streams are in San Joaquin Valley in the Central Valley<br />
Area, and four are in the Lahontan Area. Estimates <strong>of</strong> volumes <strong>of</strong> snow<br />
floods with probable frequencies <strong>of</strong> once in 100 years and once in 250<br />
years are shown in Table 5, for two <strong>of</strong> the representative streams <strong>of</strong><br />
<strong>California</strong>.<br />
QUAUTY OF WATER<br />
Most fresh waters in <strong>California</strong> are <strong>of</strong> excellent quality and well<br />
suited to irrigation and other beneficial uses. This is especially true <strong>of</strong><br />
drainage from the North Coastal Area and from the eastern side <strong>of</strong> the<br />
Central Valley Area, both <strong>of</strong> which Areas have large watersheds with<br />
high water yield. Analyses show that their surface and underground<br />
waters possess remarkably slight concentrations <strong>of</strong> salts, low percent<br />
sodium, and relatively small amounts <strong>of</strong> elemental boron. These waters<br />
are <strong>of</strong> the bicarbonate type, and calcium is the predominating base. Surface<br />
waters <strong>of</strong> comparatively high salinity are found in streams on the<br />
west Bide <strong>of</strong> the San Joaquin Valley, in Cache Creek in the Sacramento<br />
Valley, in basins on the west slope <strong>of</strong> the Diablo Range that separates<br />
the Central Coastal and Central Valley Areas, in Cuyama and Santa<br />
Maria Rivers in the Central Coastal Area, and in Piru and Sespe Creeks
CHAPTER III. METHODS AND PROCEDURES<br />
The complexity and magnitude <strong>of</strong> the task <strong>of</strong> assembling and interpreting<br />
basic data presented in this bulletin justify some explanation <strong>of</strong><br />
the procedure followed. In explaining this procedure it has been found<br />
desirable in some instances to indicate the nature and scope <strong>of</strong> the physical<br />
data available, and in other instances to review historically the technical<br />
approach to solution <strong>of</strong> the problems involved.<br />
DEFINITIONS<br />
Basin--Total drainage area above the mouth <strong>of</strong> a stream.<br />
SubbaSin-Total drainage area <strong>of</strong> any subdivision <strong>of</strong> a basin.<br />
Stream Group-Two or more minor streams within a drainage<br />
basin, designated either by the name <strong>of</strong> the principal stream or by reference<br />
to a geographical feature.<br />
Seasonal Precipitation--Total precipitation from July 1st <strong>of</strong> one<br />
year to June 30th <strong>of</strong> the following year.<br />
Mean Seasonal Precipitation--Average seasonal precipitation for<br />
the 50-year period from 1897-98 to 1946-47.<br />
Average Seasonal 'Precipitation--Average seasonal precipitation<br />
for a period other than the 50-year period from 1897-98 to 1946-47.<br />
Weighted Mean Seasonal Precipitation-Summation <strong>of</strong> the products<br />
<strong>of</strong> means <strong>of</strong> adjacent isohyets and the areas between them, divided<br />
by the summation <strong>of</strong> the areas.<br />
Natural Flow-Flow <strong>of</strong> a stream unaltered by diversions or storage<br />
<strong>of</strong> its waters, or by importation <strong>of</strong> water from another drainage basin.<br />
Seasonal Run<strong>of</strong>f-Total run<strong>of</strong>f at any station from October 1st <strong>of</strong><br />
one year to September 30th <strong>of</strong> the following year.<br />
Mean Seasonal Run<strong>of</strong>f-Average seasonal run<strong>of</strong>f for the 53-year<br />
period from 1894-95 to 1946-47. This is taken to be the long-time mean.<br />
Average Seasonal Rttn<strong>of</strong>f-Average seasonal run<strong>of</strong>f for a period<br />
other than the 53-year period frorp. 1894-95 to 1946-47.<br />
Flood Plain--Valley areas subject to periodic inundation by a<br />
stream are collectively termed its flood plain.<br />
LOCATION MAPS<br />
Plate 1, "Map <strong>of</strong> <strong>California</strong>," referred to previously, shows location<br />
<strong>of</strong> physical features and place names. Even greater detail was desirable<br />
for congested portions <strong>of</strong> the San Francisco Bay and South Coastal<br />
Areas. Accordingly, larger scale maps <strong>of</strong> those vicinities are included as<br />
Plate 10, "Portion <strong>of</strong> the San Francisco Bay Area," and Plate 16, "Los<br />
Angeles Coastal Plain <strong>of</strong> the South Coastal Area." Plate 1 has been<br />
placed inside the back cover <strong>of</strong> this bulletin for convenience <strong>of</strong> use, while<br />
Plates 10 and 16 appear in Chapters V and VII, respectively.<br />
( 45 )
48 WATER RESOURCES OF CALIFORNIA<br />
depth <strong>of</strong> precipitation were summed, to obtain mean weighted volume <strong>of</strong><br />
precipitation for all subareas and Areas <strong>of</strong> the <strong>State</strong>.<br />
RUNOFF<br />
Estimates <strong>of</strong> run<strong>of</strong>f given in this bulletin generally include only the<br />
portion <strong>of</strong> precipitation that 1I0ws from mountain and foothill lands. For<br />
the Sacramento Valley, however, run<strong>of</strong>f from precipitation on the valley<br />
lIoor also is included in estimated run<strong>of</strong>f.<br />
Run<strong>of</strong>f data previously published by the Division <strong>of</strong> <strong>Water</strong><br />
<strong>Resources</strong>, principally in <strong>Bulletin</strong>s Nos. 5, 26, and 29, have been extended<br />
or revised to conform to later information.<br />
The 53-year period from 1894-95 to 1946-47 was selected for determining<br />
mean seasonal run<strong>of</strong>f, in order to include dry years between 1894<br />
and 1904 in the southern part <strong>of</strong> the <strong>State</strong>. The period from 1894 to 1904<br />
was the driest <strong>of</strong>record in that region, whereas the driest period <strong>of</strong> record<br />
in the north was from 1923 to 1934.<br />
All estimates <strong>of</strong> run<strong>of</strong>f in this bulletin are for naturalllow as defined<br />
earlier in this chapter. In computing run<strong>of</strong>f data, measured run<strong>of</strong>f was<br />
adjusted to natural 1I0w by adding known upstream diversions and<br />
quantities stored in reservoirs, and subtracting importations and reservoir<br />
releases. Evaporation from reservoirs and lakes was also added to<br />
measured run<strong>of</strong>f where large enough to be significant. In the absence <strong>of</strong><br />
records at a reservoir or lake, evaporation was estimated from records at<br />
comparable locations. Where no records were available and water was<br />
known to have been stored, storage and release were estimated either<br />
from records <strong>of</strong> operation in other seasons, or from records <strong>of</strong> operation<br />
<strong>of</strong> other reservoirs in the same watershed, taking into account differences<br />
in run<strong>of</strong>f between seasons with available records and seasons for which<br />
estimates were made. The foregoing method <strong>of</strong> computing natural run<strong>of</strong>f<br />
was used only for periods for which records <strong>of</strong> measured run<strong>of</strong>f were<br />
available.<br />
One <strong>of</strong> the three methods described in the following paragraphs was<br />
used to estimate run<strong>of</strong>f for periods <strong>of</strong> incomplete records, although the<br />
first and second methods were used to only a limited extent.<br />
The first method involved use <strong>of</strong> the C Cindex <strong>of</strong> seasonal wetness,"<br />
which is defined as precipitation for the season expressed as a percentage<br />
<strong>of</strong> the long-time seasonal mean. In pursuing this method, indexes <strong>of</strong> wetness<br />
developed in Division <strong>of</strong> Engineering and Irrigation <strong>Bulletin</strong> No.5,<br />
"Flow in <strong>California</strong> Streams," were used. In this previous study the<br />
<strong>State</strong> was divided into 26 "precipitation divisions" and indexes <strong>of</strong> seasonal<br />
wetness were determined for each division. A c, curve <strong>of</strong> probable<br />
run<strong>of</strong>f" was then drawn for the stream being studied, by plotting run<strong>of</strong>f<br />
for seasons for which records were available against corresponding<br />
indexes <strong>of</strong> seasonal wetness. The curves were extended to give run<strong>of</strong>f for<br />
indexes as great as 200. Run<strong>of</strong>f for seasons lacking stream 1I0w records<br />
was then taken from the appropriate curve <strong>of</strong> indexes <strong>of</strong> seasonal wetness.<br />
In the second method, run<strong>of</strong>f for seasons <strong>of</strong> record was plotted<br />
against precipitation, and run<strong>of</strong>f for seasons lacking records was then<br />
taken from the curve. This method was followed where good coverage <strong>of</strong><br />
precipitation records was available over the drainage basin.
52 WATER RESOURCES OF CALIFORNIA<br />
been eliminated. However, this form <strong>of</strong> expression does not give a true<br />
measure <strong>of</strong>winter floods from drainage basins subject to substantial snow<br />
cover. Size <strong>of</strong> the area actually contributing to run<strong>of</strong>f will vary, depending<br />
upon the extent and absorptive capacity <strong>of</strong> snow cover at the time<br />
<strong>of</strong> flood. Only limited information on snow cover and its effect on rain<br />
floods is available.<br />
For streams with flow records <strong>of</strong> 20 years or longer, analyses have<br />
been made and graphs prepared for 1-, 2-, 3-, 5- and 10000y floods in<br />
drainage basins throughout <strong>California</strong> embracing areas in excess <strong>of</strong> 1,000<br />
square miles, and for all except 10-day floods in basins <strong>of</strong> less than 1,000square<br />
miles. Floods <strong>of</strong> various durations were determined on the basis<br />
<strong>of</strong> the following criteria:<br />
(1) One-day Peak Flow. This is defined as a daily flow that<br />
was both preceded and followed by lower flows. However, if two or<br />
more consecutive daily flows were equal, that flow was considered<br />
the one-day peak flow if the series <strong>of</strong> equal daily flows was both<br />
preceded and followed by lower flows.<br />
(2) Multiple - day Peak Flow. (a) Moving totals <strong>of</strong> a<br />
sequence <strong>of</strong> daily flows may be obtained by subtracting flows <strong>of</strong> the<br />
first day from the summation <strong>of</strong> flows <strong>of</strong> "n" days, and adding flow<br />
<strong>of</strong> the day succeeding the"nth" day. The largest total flow for "n"<br />
days, over a given flood period determined by such moving totals,<br />
was taken as the "n"-day peak flow <strong>of</strong> the flood.<br />
(b) If consecutive flood periods occurred with one or more days<br />
in common, only the larger flood was considered.<br />
(c) If one or more days included in a peak flow fell beyond the<br />
date arbitrarily set as the limit <strong>of</strong> the flood season, the flood was<br />
considered if the sum <strong>of</strong> daily flows within the season was greater<br />
than the sum <strong>of</strong> flows beyond the season.<br />
Flood-frequency data on rainwater floods as developed in the current<br />
investigation are presented on plates in succeeding chapters. Frequency<br />
data on volume <strong>of</strong> snow run<strong>of</strong>f, for the period from April 1st to<br />
July 31st, are presented only for the Central Valley and Lahontan Areas.<br />
QUALITY OF WATER<br />
Inorganic chemical analyses used in this bulletin for evaluating the<br />
quality <strong>of</strong> water resources were obtained from files and publications <strong>of</strong><br />
the Division <strong>of</strong> <strong>Water</strong> <strong>Resources</strong>, the United <strong>State</strong>s <strong>Department</strong> <strong>of</strong> Agriculture,<br />
the United <strong>State</strong>s Bureau <strong>of</strong> Reclamation, the United <strong>State</strong>s<br />
Geological Survey, and the University <strong>of</strong> <strong>California</strong>. Analyses <strong>of</strong> municipal<br />
supplies were also obtained from the <strong>California</strong> <strong>State</strong> <strong>Department</strong><br />
<strong>of</strong> Public Health, from United <strong>State</strong>s <strong>Department</strong> <strong>of</strong> Agriculture Technical<br />
<strong>Bulletin</strong> 448, from the City and County <strong>of</strong> San Francisco, from<br />
the City <strong>of</strong> San Diego and from the <strong>Department</strong> <strong>of</strong> <strong>Water</strong> and Power<br />
<strong>of</strong> the City <strong>of</strong> Los Angeles.<br />
Principal bases in mineral constituents <strong>of</strong> natural water solubles<br />
are calcium, magnesium, and sodium. These occur almost entirely as<br />
bicarbonates, sulphates, chlorides, and nitrates. Boron, usually present<br />
in smaller amounts than the foregoing constituents, may be particularly
REDWOOD mGHWAY-KORTH COASTAL .ARE.\.<br />
•<br />
(Dtd.....'". <strong>of</strong> RlghUXlll8 PIIQlol
WATER RESOURCES OF CALWORNIA<br />
TRIl\'ITY RIVER<br />
69
WATER RESOURCES OF CALIFORNIA 85<br />
TABLE IS-Continued<br />
ESTIMATED SEASONAL NATURAL RUNOFF, 1894-95 TO 1946-47, FROM MAIN<br />
STREAM AND TRIBUTARY BASINS FOR WHICH RECORDS ARE AVAILABLE,<br />
NORTH COASTAL AREA<br />
Season<br />
Oct. l·Sept. 30<br />
InAcre-feet<br />
1894-95..__ _. _ _ _ __ . _. .<br />
95-96__ _ _.. __ _. _ _ __ . __<br />
96-97__._ __ _. _ _ _.. .. _<br />
97-98 __ __ __ _<br />
98-99 _ __ _.. _.. _ _..<br />
1899-1900 __ _ __ _<br />
00-01.._ _ __ _ _ _ .<br />
01-02 __ _ .<br />
02-03 _ _ __ __ _. _. _.._ .<br />
03-04 _ __ __ .. _. __ _<br />
1904-05.._ __ _ __ _ .<br />
05-06.._ _ _ __ __ _ __ . _.. __ .<br />
06-07.._ __ _ __ .. _<br />
07-08._ __ _ _ .<br />
08-09 __ _ _ _ _ .<br />
1909-10._ _._ _ __ _ _.. _..<br />
10-11. _ _. _ __ __ _.._ __ _<br />
11-12_ __ _ _ . _.. __.. _ _ .<br />
12-13_ _ _ _ __ . _.. _ .<br />
13-14._ _ _ _ __ .. _ _ .<br />
1914-15._ __ _ _ _ _.. _.. _. _ .<br />
15-16_ _ _ _ _ _ .<br />
16-17 __ __ _ __ __ .<br />
17-18.__ _ _ __ .<br />
18-19 _ _ _ _ .<br />
1919-20_ _ __ .<br />
20-21. __ _ __ .<br />
21-22 _ _. _ _ _ _ __ .<br />
22-23 __ _ _<br />
23-24 _ _ .<br />
1924-25._ _ _. _ _ __ _ _ .<br />
25-26 _ _ __ _. _ .<br />
26-27 _ _ _ _ .<br />
27-28 _ __ . _ _ __ __ . _..<br />
28-29._ _ __ __ " __ .<br />
1929-30_ _ __ .<br />
30-31._. _ _ _ _. __ ..<br />
31-32 __ _ __ .<br />
32-33 _ _ __ _. __ _.. _ __ _<br />
33-34_ _ _ _ __ .<br />
1934-35 _.._ _ _ __ _ _ _<br />
35-36 _ _ __ _.<br />
36-37 _ _ _ _. _. _<br />
37-38._ _. _ __ _. _ _ .<br />
38-39.._ _ _ _ .<br />
1939-40 _ __ _ _. _ _ __<br />
40-41.._.. __ _ _. _ __ __ .<br />
41-42_._..__ _ _. _ __ _ _ _.<br />
42-43._.._ _ _.. _ _ _..<br />
43-44.._. _ __ _ _ .<br />
1944-45..__ _ _ .<br />
45-46._ ..__.._. _ __ _ _.<br />
Van Duzen<br />
River at<br />
mouth<br />
1,248,000<br />
1,178,000<br />
1,180,000<br />
193,000<br />
532,000<br />
1,007,000<br />
1,054,000<br />
1,248,000<br />
1,153,000<br />
1,492,000<br />
1,175,000<br />
1,215,000<br />
1,345,000<br />
886,000<br />
1,408,000<br />
1,020,000<br />
768,000<br />
752,000<br />
939,000<br />
1,403,000<br />
1,294,000<br />
1,165,000<br />
799,000<br />
471,000<br />
945,000<br />
300,000<br />
1,287,000<br />
708,000<br />
558,000<br />
151,000<br />
1,204,000<br />
643,000<br />
1,292,000<br />
849,000<br />
401,000<br />
662,000<br />
333,000<br />
541,000<br />
702,000<br />
508,000<br />
914,000<br />
1,010,000<br />
686,000<br />
1,640,000<br />
544,000<br />
1,176,000<br />
1,341,000<br />
1,241,000<br />
998,000<br />
438,000<br />
883,000<br />
1,047,000<br />
Mattole<br />
River near<br />
Petrolia<br />
1,254,000<br />
1,197,000<br />
1,199,000<br />
216,000<br />
615,000<br />
1,055,000<br />
1,096,000<br />
1,254,000<br />
1,179,000<br />
1,440,000<br />
1,195,000<br />
1,228,000<br />
1,328,000<br />
950,000<br />
1,376,000<br />
1,066,000<br />
845,000<br />
854,000<br />
1,020,000<br />
1,374,000<br />
1,289,000<br />
1,186,000<br />
871,000<br />
551,000<br />
1,002,000<br />
354,000<br />
1,282,000<br />
790,000<br />
643,000<br />
157,000<br />
1,218,000<br />
728,000<br />
1,288,000<br />
919,000<br />
472,000<br />
729,000<br />
389,000<br />
492,000<br />
786,000<br />
589,000<br />
976,000<br />
1,057,000<br />
766,000<br />
1,571,000<br />
628,000<br />
1,151,000<br />
1,322,000<br />
1,252,000<br />
1,046,000<br />
492,000<br />
962,000<br />
1,088,000<br />
Russian<br />
River at<br />
Guerneville<br />
2,134,000<br />
1,850,000<br />
1,861,000<br />
193,000<br />
532,000<br />
1,339,000<br />
1,464,000<br />
2,137,000<br />
1,756,000<br />
3,379,000<br />
1,834,000<br />
1,988,000<br />
2,582,000<br />
1,060,000<br />
2,892,000<br />
1,372,000<br />
871,000<br />
763,000<br />
1,202,000<br />
2,855,000<br />
2,338,000<br />
1,802,000<br />
924,000<br />
458,000<br />
1,190,000<br />
273,000<br />
2,315,000<br />
776,000<br />
563,000<br />
166,000<br />
1,956,000<br />
680,000<br />
2,337,000<br />
999,000<br />
380,000<br />
737,000<br />
315,000<br />
760,000<br />
764,000<br />
504,000<br />
1,118,000<br />
1,345,000<br />
749,000<br />
4,198,000<br />
546,000<br />
1,953,000<br />
3,087,000<br />
2,202,000<br />
1,308,000<br />
628,000<br />
981,000<br />
1,389,000<br />
544,000<br />
1,403,000<br />
1946-47__ . _ _.._ _ __ __ __.. _.._.. 509,000 571,000<br />
1-----1-----1-----<br />
MEAN.._..__ _. _ _ __ _ _..<br />
914,000 950,000
106 WATER RESOURCES OF CALIFORNIA<br />
TABLE 20<br />
PRECIPITATION STATIONS WITH CONTINUOUS RECORDERS, SAN FRANCISCO BAY AREA<br />
(Asterisk indicates stations at which precipitation records have been kept for 10 years or longer;<br />
also the station number on Plate 3)<br />
File<br />
number<br />
---<br />
Latitude Eleva- Period Source<br />
Station County and tion, <strong>of</strong> <strong>of</strong><br />
longitude feet record record<br />
2-29* Berkeley_____ --------- Alameda _____ 37° 52' 299 Dec. 1923 Univ. <strong>of</strong><br />
122° 16' June 1947 Calif.<br />
2-008 Hayward (near) ____ --- Alameda _______ 37° 38' 1,000 Nov. 1939 USWB<br />
121° 58' June 1947<br />
2-011 Oakland Airport_________ Alameda _______ 37° 44' 7 Nov. 1940 USWB<br />
122° 12' June 1947<br />
2-013 Upper San Leandro Alameda _______ 37° 46' 413 Jan. 1945 EBMUD<br />
Filters 122° 10' June 1947<br />
2-014 Antioch (near) ___ -- --- Contra Costa- __ 37° 56' 300 Jan. 1945 USWB<br />
121° 47' June 1947<br />
2-018 Martinez (near) ___ Contra Costa___ 37° 59' 225 July 1944 USWB<br />
122° 08' June 1947<br />
2-022 Walnut Creek (near)_ --- Contra Costa___ 37° 55' 220 July 1944 USWB<br />
122° 01' June 1947<br />
2-024 Hamilton Field__________ Marin__________ 38° 03' 20 Jan. 1940 USAC<br />
122° 30' Sept. 1942<br />
2-22* Mt. Tamalpais__________ Marin__________ 37° 56' 2,375 Jan. 1907 USWB<br />
122' 35' May 1920<br />
2-025 Mt. TamaJpais (near) --- Marin__________ 37° 54' 1,000 Feh. 1947 USWB<br />
122° 34' June 1947<br />
2-026 Novato (near) ____ - --- Marin. _______ 38° 07' 550 Oct. 1943 USED<br />
122° 42' June 1947<br />
2-028 Atlas Road ______ Napa _______ -- 38° 26' 1,750 Jan. 1940 USWB<br />
122° 15' June 1947<br />
2-030 Oakville No. L _________ Napa__________ 38° 26' 150 Dec. 1943 USWB<br />
122° 25' Jan. 1947<br />
2-032 Oakville (near) __________ Napa __ ---- - -- 38° 24' 170 May 1940 USWB<br />
122° 28' June 1947<br />
2-034 St. Helena (nearl ________ Napa__ -- ---- 38° 30' 1,800 Dec. 1939 USWB<br />
122° 32' June 1947<br />
2-035 St. Helena No. 3 ________ Napa _____ ---- 38° 34' 1,050 Nov. 1939 USWB<br />
I 122° 22' June 1947<br />
2--40* San Francisco_____ ----- San Francisco___ 37° 47' 52 May 1906 USWB<br />
122° 25' June 1947<br />
2-038 San Francisco Airport___ San Francisco___ 37° 37' 38 June 1944 USWB<br />
122° 23' June 1947<br />
2-37* South East Farallon_____ San Francisco___ 37° 42' 30 Mar. 1941 USCG<br />
123° 00' June 1947<br />
2-053 Gilroy _________________ Santa Clara_____ 37° 03' 1,050 Sept. 1943 USWB<br />
121° 27' July 1944<br />
2-80* Lick Observatory________ Santa Clara_____ 37° 20' 4,209 Sept. 1888 Private<br />
121° 39' June 1947<br />
2-058 M<strong>of</strong>fett Field__ -------- Santa Clara___ 37° 24' 40 May 1940 USAC<br />
122° 03' April 1942<br />
2-059 Morgan HilL_ ---- ----- Santa Clara___ 37° 07' 225 Nov. 1945 USWB<br />
121° 39' June 1947<br />
2-061 Mt. Madonna____ Santa Clara_____ 37° 01' 1,800 Nov. 1945 USWB<br />
121° 43' June 1947<br />
2-71* Palo Alto_______________ Santa Clara_____ 37° 26' 57 Nov. 1910 City <strong>of</strong><br />
122° 10' June 1947 Palo Alto<br />
2-78* San Jose_______________ Santa Clara_____ 37° 20' 141 Sept. 1906 USWB<br />
121° 54' June 1947<br />
2-065 Fairfield (near) ------ -- Solano ____ ---- 38° 15' 15 Dec. 1944 USWB<br />
122° 03' June 1947<br />
2-7* Petaluma_____ 8onoma________ ----- 38° 15' 30 Jan. 1943 USED<br />
122° 38' June 1947<br />
Abbreviation<br />
USWB<br />
EBMUD<br />
USCG<br />
USAC<br />
USED<br />
SOURCE OF RECORD<br />
Name<br />
United <strong>State</strong>s Weather Bureau<br />
East Bay Municipal Utility District<br />
United <strong>State</strong>s Coast Guard<br />
United <strong>State</strong>s Army Air Corps<br />
United <strong>State</strong>s Corps <strong>of</strong> Engineers
114 WATER RESOPRCES OF CALIFORXIA<br />
RUNOFF<br />
Estimated mean seasonal natural run<strong>of</strong>f <strong>of</strong> the San Francisco Bay<br />
Area for the 53-year period from 1894-95 to 1946-4i is 1,245,000 acre-feet.<br />
or 1.8 percent <strong>of</strong> total surface run<strong>of</strong>f from mountain and foothill lands<br />
in the <strong>State</strong>. The minimum seasonal total <strong>of</strong> 93.000 acre-feet occurred in<br />
1923-24, and the maximum, amounting to 3,130,000 acre-feet. in 1906-07.<br />
The lO-year period from 1923-24 to 1932-33 was the driest <strong>of</strong> record in the<br />
Area. During each season <strong>of</strong> that period, except 1926·27, run<strong>of</strong>f was less<br />
than the 53-:rear mean, and the average was only 49.1 percent <strong>of</strong> this<br />
long-time mean.<br />
Run<strong>of</strong>f from the Area is derived principally from rain, since snow<br />
falls on only a small portion. Approximately half the total run<strong>of</strong>f occurs<br />
between October 1st and February 15th, and about 30 percent during<br />
the following 90 days. )[onthly run<strong>of</strong>f varies from approximately 1.5<br />
percent <strong>of</strong> the seasonal total during the period from July to !\ovember<br />
inclusive, to 28 percent in the maximum month, usually in the spring.<br />
As <strong>of</strong> September 30,1947, the United <strong>State</strong>s Geological Survey was<br />
maintaining 14 stream gaging stations in the San Francisco Bay Area,<br />
principal stations being Coyote Creek near :Madrone with a drainage area<br />
<strong>of</strong> 192 square miles, Alameda Creek near !\iles with a drainage area <strong>of</strong><br />
634 square miles. and Xapa River near St. Helena with a drainage area<br />
<strong>of</strong> 85 square miles. The only long-time records are those for Alameda and<br />
Coyote Creeks.<br />
Stream gaging stations <strong>of</strong> the Area are listed in Table 24, together<br />
with average, maximum, and minimum seasonal run<strong>of</strong>f for stations with<br />
records <strong>of</strong> ten years or more. The 14 gaging stations maintained by the<br />
Geological Survey measure run<strong>of</strong>f from 1,216 <strong>of</strong> the 3.967 square miles<br />
<strong>of</strong> land area in the San Francisco Bay Area. These stations are supplemented<br />
by several, maintained by other agencies, which measure run<strong>of</strong>f<br />
from minor basins, each <strong>of</strong> less than 50 square miles.<br />
Estimated mean seasonal natural run<strong>of</strong>f from the Area by basins.<br />
subbasins, and stream groups for the 53-year period from 1894-95 to<br />
1946-47 is shown in Table 25. Of total mean seasonal natural run<strong>of</strong>f.<br />
approximately 614,000 acre-feet was estimated by the empirical formula<br />
described in Chapter III. Estimates <strong>of</strong> seasonal natural run<strong>of</strong>f <strong>of</strong> m8in<br />
stream and tributary basins for which there are partial records are given<br />
in Table 26.<br />
A record <strong>of</strong> flow <strong>of</strong> Lagunitas Creek at Alpine Dam was obtained<br />
from the :Marin County Municipal <strong>Water</strong> District. This record was begun<br />
in 1914-15 and covers 27 <strong>of</strong> the past 33 )·ears. Run<strong>of</strong>f for missing seasons,<br />
and for seasons prior to commencement <strong>of</strong> the record was estimated by<br />
comparison with run<strong>of</strong>f <strong>of</strong> San Leandro Creek. Among records used in<br />
computing and estimating natural flows in the Area secured from
CHAPTER VI. CENTRAL COASTAL AREA<br />
Both geographically and climatically, the Central Coastal Area is a<br />
transition zone between the North Coastal and San Francisco Bay Areas<br />
and the South Coastal Area.<br />
LOCATION AND DESCRIPTION<br />
This Area lies along the Pacific Ocean, between latitudes 34!0 and<br />
37° N., from the southern boundary <strong>of</strong> Pescadero Creek Basin, in Santa<br />
Cruz County, to the southeastern boundary <strong>of</strong> Rincon Creek Basin, in<br />
Ventura County. Inland it extends an average <strong>of</strong> about 50 miles to the<br />
crests <strong>of</strong> the coastal ranges.<br />
Summer fogs are common along the coastal strip. In interior valleys<br />
there is a marked contrast between summer and winter temperatures,<br />
with summer highs reaching 110° F. and winter lows occasionally falling<br />
to 16° F. Near the coast the Santa Cruz, Santa Lucia, and Santa Ynez<br />
Mountains are the main topographic features, with elevations <strong>of</strong> 3,801<br />
feet at Lorna Prieta in the Santa Cruz Mountains, 5,844 feet at Junipero<br />
Serra Peak in the Santa Lucia Range, and 6,828 feet at Big Pine Mountain<br />
in the San Rafael Range. Elevations in the Diablo Range, on the<br />
western side <strong>of</strong> basins draining interior portions <strong>of</strong> the Area, are 5,248<br />
feet on San Benito Mountain at the head <strong>of</strong> San Benito River, and 8,750<br />
feet on Sawmill Mountain at the head <strong>of</strong> Santa Maria River.<br />
STREAMS AND AREAS OF DRAINAGE BASINS<br />
Principal streams <strong>of</strong> the Central Coastal Area are Pajaro, Salinas,<br />
Santa Maria, and Santa Ynez Rivers, which drain the larger basins to<br />
the crests <strong>of</strong> the Gabilan, Diablo, San Rafael and Santa Ynez Mountains,<br />
and San Lorenzo, Carmel, and Big Sur Rivers, and Scott, Morro, San<br />
Luis Obispo, Arroyo Grande, San Antonio, and Rincon Creeks, which flow<br />
directly into the Pacific Ocean along the coastal slope. Two-fifths <strong>of</strong> the<br />
Area lies within the basin <strong>of</strong> Salinas River and its tributaries. This basin,<br />
about 170 miles long, approximately parallels the coast, from which it is<br />
separated by the Santa Lucia Range. Areas <strong>of</strong>drainage basins in the Central<br />
Coastal Area are listed in Table 31.<br />
PRECIPITATION<br />
Precipitation on the Central Coastal Area is moderate except in a<br />
few isolated sections, and decreases from north to south. Snow normally<br />
falls in limited amounts at higher altitudes but is rare on the valley<br />
floors. The definite influence exerted by mountain ranges on precipitation<br />
is indicated by greater density <strong>of</strong> vegetation on their western slopes.<br />
Mountains may also affect distribution <strong>of</strong> precipitation in the interior<br />
valleys. For instance, precipitation from major storms crossing Salinas<br />
Valley is substantially heavier on the west side <strong>of</strong> the valley than on<br />
the east side.<br />
( 135 )
COABTAL TERP.AOf-CEXTRAI.. COASTAL AREA
WATER RESOURCES OF CALIFORNIA 147<br />
TABLE 34-Continued<br />
PRECIPITATION STATIONS WITH RECORDS OF LESS THAN 10 YEARS,<br />
CENTRAL COASTAL AREA<br />
File Latitude Eleva- Period Type<br />
number Station County and tion, <strong>of</strong> <strong>of</strong><br />
longitude feet record record<br />
------<br />
3-033<br />
3-034<br />
3--035<br />
3-036<br />
Buena Vista__________________<br />
Fremont Peak________________<br />
Hernandez_______ ___ -- -------<br />
Hernandez (near) ______________<br />
San Benito_____<br />
San Benito_____<br />
San Benito_____<br />
San Benito_____<br />
36° 46'<br />
121° 11'<br />
36° 46'<br />
121° 29'<br />
36° 22'<br />
120° 48'<br />
36° 18'<br />
1,640<br />
2,500<br />
2,500<br />
4,000<br />
1943-47<br />
1940-41<br />
1914-15<br />
1940-42<br />
A<br />
A<br />
B<br />
A<br />
3-037 Hernandez (near) No. 2 ________ San Benito_____<br />
120° 47'<br />
36° 18' 2,770 1939-47 A<br />
3-038<br />
120° 42'<br />
o 24<br />
Hollister No. 2 ________________ 3-039<br />
San Benito_____ 36° 51'<br />
121° 24'<br />
300 1938-47 A<br />
Hollister_____________________ San Benito_____ 36° 52' 300 1930-31 B<br />
3-040 Paicines (near) ________________ San Benito_____<br />
121° 24'<br />
36° 44' 920 1942-47 B<br />
3-041 Panoche Store________________ San Benito_____<br />
121° 22'<br />
36° 36' 1,265 1914-15 B<br />
3-042 Pinnacles_____________________ San Benito_____<br />
120° 50'<br />
36° 28' 1,389 1936-38 B<br />
3-043 San Benito (near) _____________ San Benito _____<br />
121° 11'<br />
36° 31 ' 1,360 1940-47 A<br />
3-044 San Juan Bautista (near) No. 2_ San Benito_____<br />
121° 05'<br />
36° 49' 550 1943-47 A<br />
3-045 Tequisquito Rancho ___________ San Benito_____<br />
121° 31'<br />
36° 51' 200 1899· B<br />
121° 24' 1902<br />
3-046 Tree Pinos____________________ San Benito_____ 36° 47' 500<br />
1905-06<br />
1898-99 B<br />
3-047 Upper Tres Pinos______________ San Benito_____<br />
121° 19'<br />
36° 38' 2,190 1940-47 A<br />
121° 02'<br />
3-048<br />
3-049<br />
Atascadero (Atascadero Mutual<br />
<strong>Water</strong> Co.)<br />
Atascadero Sub Station________<br />
San Luis Obispo<br />
San Luis Obispo<br />
35° 29'<br />
120° 40'<br />
35° 29'<br />
831<br />
860<br />
1915-17<br />
1934-39<br />
B<br />
B<br />
3-050 Avila________________________ San Luis Obispo<br />
120° 40'<br />
35° 11' 115 1930-39 B<br />
3-051 Cambria_____________________ San Luis Obispo<br />
120°<br />
35°<br />
44'<br />
34' 100 1904-06 B<br />
3-052 Camp No. 5 __________________ San Luis Obispo<br />
121° 04'<br />
35° 28' 1,000 1914-17 B<br />
3-053 Cholame (near) _______________ San Luis Obispo<br />
120° 41'<br />
35° 41 ' 1,975 1940-47 A<br />
3-054 CorraL ______________________ San Luis Obispo<br />
120° 12'<br />
35° 28' 1,225 1914-15 B<br />
3-055 Eagle________________________ San Luis Obispo<br />
120° 41'<br />
35° 28' 8SO 1914-16 B<br />
3-056 Edna________________________<br />
San Luis Obispo<br />
120° 38'<br />
35° 12' 400 1930-39 D<br />
3-057<br />
120° 37'<br />
Ernst Ranch__________________ San Luis Obispo 35° 39' 900 1918-20 B<br />
3-058 Estero_______________________<br />
San Luis Obispo<br />
120° 37'<br />
35° 25' 25 1929·32 B<br />
3-059 Estrada______________________ San Luis Obispo<br />
120° 52'<br />
35° 31' 900 1914-16 B<br />
3-060<br />
120° 40'<br />
Garcias______________________ San Luis Obispo 35° 31 ' 850 1914-16 B<br />
3-061<br />
120° 42'<br />
Hepburn Well_________________ San Luis Obispo 35° 26' 1,025 19i4-16 B<br />
3-062<br />
120° 38'<br />
Hill Ranch___________________ San Luis Obispo 35° 44' SOO 1897- B<br />
3-063<br />
120° 39' 1900<br />
HUBsna ______________________ San Luis Obispo 35° 08' ,<br />
12 °<br />
770 1940·47 A
152 WATER RESOURCES OF CALIFORNIA<br />
TABLE 36<br />
ESTIMATED MEAN SEASONAL PRECIPITATION ON VALLEY AND MESA LANDS<br />
1897.98 TO 1946-47<br />
Number<br />
on<br />
Plate 2<br />
2-1<br />
2-2<br />
2-3<br />
3-1<br />
3-2<br />
4-1<br />
4-2<br />
4-3<br />
4-4<br />
4-6<br />
4-7<br />
5<br />
6<br />
7-1<br />
7-2<br />
7-3<br />
7-4<br />
7-5<br />
7-7<br />
7-9<br />
9-2<br />
14-2<br />
15-1<br />
15-2<br />
16-1<br />
16-2<br />
16-5<br />
16-6<br />
17-2<br />
18--2<br />
18-3<br />
19<br />
20<br />
CENTRAL COASTAL AREA<br />
Stream or stream group buin<br />
Precipitation<br />
in<br />
acre-feet<br />
Scott Creek Group - - - __ - -- - - - - _<br />
12,800<br />
San Lorenzo River Buin<br />
Above gage at Big Trees<br />
Branciforte Creek above gage at Santa Cruz<br />
Remainder <strong>of</strong> San Lorenzo River<br />
_<br />
_<br />
_<br />
4,500<br />
3,900<br />
4,600<br />
Soquel Creek Group<br />
Soquel Creek above gage at SoqueL<br />
Remainder <strong>of</strong> Group<br />
_<br />
_<br />
3,200<br />
13,000<br />
PaJaro River Buin<br />
San Benito River above gage near Willow Creek SchooL<br />
Tres Pinos Creek above gage near Tres Pinos<br />
_<br />
_<br />
Pacheco Creek above gage near Dunneville<br />
Llagu Creek above gage near Gilroy<br />
_<br />
_<br />
Remainder <strong>of</strong> Pajaro River above gage near Chittenden (below gage near<br />
Morgan Hill on Uvu Creek) _<br />
Remainder <strong>of</strong> Pajaro River _<br />
Elkhorn Slough Basin - _<br />
Moro Cojo Group _<br />
Salinas River Basin<br />
Above gage at Paso Robles _<br />
Nacimiento River above gage near San MigueL<br />
San Antonio River above gage at Pleyto<br />
, _<br />
_<br />
Remainder <strong>of</strong> Salinas River above San Lucas damsite:<br />
Above Salinas valley Hoor _<br />
Salinas valley Hoor : _<br />
Remainder <strong>of</strong> Salinas River (below gage near Soledad on Arroyo Seco):<br />
Above valley Hoor-East Bide _<br />
Valley Hoor - - - ---- - -----.--- - - ----- - - - - -- - -- - - __ -_ - _- _- - - --<br />
Carmel River Basin<br />
Remainder <strong>of</strong> Carmel River (below San Clemente Dam) _<br />
Morro Creek Group<br />
Remainder <strong>of</strong> Morro Creek Group (less Steiner Creek above gage near San<br />
Luis Obispo) - - -------------------- - - - -.- -- - - -- - - - _- - - --<br />
Arroyo Grande Basin<br />
Above gage at Arroyo Grande _<br />
Remainder <strong>of</strong> Arroyo Grande _<br />
Santa Maria River Basin<br />
Sisquoc River above gage near Gary _<br />
Cuyama River above gage near Santa Maria _<br />
Remainder <strong>of</strong> Santa Maria River above gage at Guadalupe (below gages on<br />
Alamo Creek and Huasna River) _<br />
Remainder <strong>of</strong> Santa Maria River _<br />
San Antonio Creek Group<br />
Remainder <strong>of</strong> San Antonio Creek Group (less San Antonio Creek above gage<br />
at Harris) -----_--_ -_ - -_ -_ -. _<br />
Santa Ynez River Basin<br />
From Gibraltar Dam to gage at Lompoc<br />
Remainder <strong>of</strong> Santa Ynez River<br />
_<br />
_<br />
San Jose Creek Group _<br />
Soda Lake Basin - -_ - - _<br />
TOTAL, CENTRAL COASTAL AREA _<br />
4,500<br />
11,800<br />
2,900<br />
1,200<br />
191,000<br />
53,800<br />
9,400<br />
6,400<br />
98,600<br />
22,100<br />
62,300<br />
164,000<br />
42,800<br />
17,100<br />
216,000<br />
5,300<br />
61,900<br />
6,100<br />
22,200<br />
6,300<br />
87,000<br />
58,900<br />
92,600<br />
23,600<br />
57,200<br />
48,500<br />
35,500<br />
136,000<br />
1,587,000
WATER RESOURCES OF CALIFORNIA 163<br />
TABLE 39<br />
ESTIMATED SEASONAL NATURAL RUNOFF, 1894.95 TO 1946-47, FROM MAIN<br />
STREAM AND TRIBUTARY BASINS FOR WHICH RECORDS ARE AVAILABLE,<br />
CENTRAL COASTAL AREA<br />
Season<br />
Oct. I-Sept. 30<br />
San Lorenzo<br />
River at<br />
Big Trees<br />
InAcre-feet<br />
Branciforte<br />
San Benito<br />
Creek<br />
Soquel River near Tres Pinos Pacheco<br />
at Santa Creek at Willow Creek near Creek near<br />
Cruz<br />
Soquel Creek Tres Pinos Dunneville<br />
School<br />
1894-95_______ 226.000 31,800 96,700 110,000 63.300 97,100<br />
95-96______ 153,000 21,700 65,900 19,800 11,100 31,100<br />
96-97_________ 151,000 21,300 64,500 66,500 38,700 68,000<br />
97-98_________ 16,500 2,300 8,200 1,800 600 3,600<br />
98-99______ 62,700 8,900 27,700 5,200 2,700 13,600<br />
1899-1900______ 73,200 10,400 32,000 3,500 1,900 10,500<br />
()(H)1. _______ 158,000 22,400 67,900 19,800 11,100 31,100<br />
01-{)2. _______ 83,600 11,800 36,100 9,000 4,600 19,000<br />
02-03_______ 106,000 14,900 45,200 30,000 17,300 40,300<br />
03-{)4________ 58,300 8,200 26,100 6,500 2,900 15,000<br />
1904-{)5. _______ 89,700 12,700 38,600 5,200 2,700 13,600<br />
05-{)6_________ 168,000 23,700 72,200 59,500 34,900 63,100<br />
06-07. _______ 264,000 37,300 113,000 166,000 94,000 131,000<br />
07-{)8_________ 73,700 10,400 32,200 9,800 5,000 20,100<br />
08-09. ________ 213,000 30,200 91,600 129,000 73,800 109,000<br />
1909-10_________ 80,900 11,400 35,100 11,800 6,100 22,300<br />
10-11.____ _._- 215,000 30,300 92,000 69,200 40,300 69,800<br />
11-12________ 30,800 43,500 14,000 2,000 800 4,700<br />
12-13_________ 13,200 1,900 6,600 1,800 800 4,100<br />
13-14__ ------ 230,000 32,500 98,500 147,000 83,200 119,000<br />
1914-15_________ 173,000 24,500 74,500 64,000 37,200 66,100<br />
15-16_________ 212,000 30,000 90,900 99,200 57,300 90,200<br />
16-17. ------- 136,000 19,200 58,500 21,800 12,100 32,600<br />
17-18. ______ "_ 57,500 8,100 25,400 77,800 45,100 76,100<br />
18-19_________ 71,500 10,100 31,200 10,000 5,200 20,400<br />
1919-20__ ------ 45,100 6,400 19,900 2,500 1,500 7,000<br />
20-21.. _______ 83,600 11,800 36,100 14,000 7,700 25,100<br />
21-22__ ------ 154,000 21,700 65,700 21,200 11,700 32,000<br />
22-23.. _______ 101,000 14,200 43,400 11,200 5,900 21,900<br />
23-24________ 13,200 1,900 6,600 1,800 600 3,400<br />
1924-25_________ 45,100 6,400 20,300 2,200 1,300 6,900<br />
25-26_________ 112,000 15,900 48,000 7,800 3,800 17,100<br />
26-27.________ 128,000 18,100 55,000 12,200 6,700 23,100<br />
27-28_________ 61,600 8,700 26,900 3,200 1,900 9,900<br />
28-29_________ 40,700 5,800 18,300 2,000 800 5,000<br />
1929-30. ________ 45,100 6,400 20,300 3,000 1,700 8,500<br />
30-31.________ 11,000 1,500 5,500 1,800 600 3,600<br />
31-32._______ . 113,000 15,900 48,200 21,800 12,100 32,600<br />
32-33_________ 20,400 2,900 9,700 2,000 800 5,100<br />
33-34_________ 57,200 8,100 25,000 2,200 1,000 5,800<br />
1934-35.________ 75,400 10,700 32,800 5,500 2,700 13,700<br />
35-36_________ 99,200 14,000 42,900 13,000 6,900 23,900<br />
36-37_________ 76,200 10,800 33,500 25,000 14,200 36,100<br />
37-38_________ 184,000 26,000 80,600 104,000 60,000 93,100<br />
38-39_________ 23,000 3,300 14,400 2,000 800 4,800<br />
1939--40.. _______ 173,000 37,500 81,400 24,200 18,700 37,400<br />
40--41. ________ 265,000 21,200 107,000 91,600 52,700 85,000<br />
41--42_________ 158,000 17,600 57,100 28,600 10,900 29,500<br />
42--43 _________ 119,000 16,800 48,000 20,700 13,700 41,800<br />
43--44.________ 48,600 6,900 35,500 16,200 6,100 19,800<br />
1944--45. ________ 87,200 12,300 39,400 9,500 4,900 24,600<br />
45--46_______ •. 63,500 9,000 29,800 7,000 3,400 7,300<br />
1946--47___ • _____ 29,200 4,100 13,300 2,100 1,200 5,300<br />
MEAN.____ 104,700 15,400 45,500 30,300 17,100 34,000
li4 WATER RESOURCES OF CALIFORKIA<br />
sources. Run<strong>of</strong>f <strong>of</strong> excellent quality from the Santa Lucia Range commences<br />
earlier in the season and is better sustained than inferior quality<br />
run<strong>of</strong>f from the Diablo Range. Until about 1925, when irrigated acreage<br />
in Salinas Valley was approximately half the present, average run<strong>of</strong>f<br />
from the Santa Lucia Range occurring early in the season was sufficieut<br />
to recharge fully all ground waters in Salinas Valley, except in minor<br />
deltas <strong>of</strong> east side streams south <strong>of</strong> King City. Consequently there was no<br />
remaining capacity in the ground water basins for retention <strong>of</strong> inferior<br />
quality drainage from the Diablo Range. However, heavy draft on<br />
ground waters in dl")· years since 1925 has increased retention <strong>of</strong> poor<br />
quality waters from the Diablo Range and resulted in enlargement <strong>of</strong> the<br />
zone <strong>of</strong> comminglement.<br />
Ground waters recharged from drainage <strong>of</strong> the Santa Lucia Range<br />
vary in quality from excellent to good, while those recharged from<br />
commingling <strong>of</strong> drainages range from good to fair, and those recharged<br />
from Diablo Range drainage, from fair to unusable. The first eleven<br />
analyses for Salinas Valley gi,·en in Table 41 are <strong>of</strong> ground waters<br />
recharged from Santa Lucia Range drainage. The following seven are<br />
<strong>of</strong> ground waters recharged from commingling <strong>of</strong> drainages. The last six<br />
are <strong>of</strong> ground waters recharged from Diablo Range drainage. The latter<br />
are unsafe for irrigation use because <strong>of</strong> excessive salinity, excessive<br />
l"hlorides, or excessive boron.<br />
Quality <strong>of</strong> ground waters in Arroyo Grande Valley, and in small<br />
basins along the coastal strip to the north in San Luis Obispo County, is<br />
generally good, except in minor areas <strong>of</strong> sea water encroachment. These<br />
are l"arbonate type waters, and calcium and magnesium are rather<br />
ewnly balanced as the important bases.<br />
In Santa Maria Valley the ground water is similar in quality to water<br />
<strong>of</strong> Santa Maria River, which contains a blend <strong>of</strong> high concentrations <strong>of</strong><br />
sulphates from Cuyama River and low total solubles from Sisquoc River.<br />
Ground water in Sisquoc Valley generally reflects the good quality <strong>of</strong><br />
water in Sisquoc River, and that in the vicinity <strong>of</strong> Lompoc is similar to<br />
water in Santa Ynez River.<br />
All constituents in ground waters <strong>of</strong> Sisquoc and Santa Ynez Valleys<br />
are rather evenl)' balanced, and total salinity is moderate. Ground waters<br />
in the south coastal strip <strong>of</strong> Santa Barbara County in the vicinity <strong>of</strong><br />
Carpinteria are calcium carbonate type, and generally low in total<br />
solubles.
UPPER SANTA ANA VALLEY-SOUTH COASTAL AREA<br />
(Pacific Air Industries Photo)
WATER RESOURCES OF CALIFORNIA 191<br />
The four precipitation stations listed in Table 46 were selected as<br />
representative <strong>of</strong> elevations and topographic patterns within the Area.<br />
Maximum and minimum precipitation figures in the table are monthly<br />
extremes during the period <strong>of</strong> record. The bar diagrams <strong>of</strong> Plate 17,<br />
"Distribution <strong>of</strong> Precipitation at Selected Stations, South Coastal Area,"<br />
show graphically for these stations the monthly distribution <strong>of</strong> precipitation<br />
in the maximum and minimum seasons <strong>of</strong> record. Also shown is<br />
monthly distribution during the season in which precipitation was nearest<br />
to the average seasonal total given in Table 46.<br />
Mean seasonal precipitation on valley and mesa lands <strong>of</strong> the South<br />
Coastal Area for the period from 1897-98 to 1946-47 is estimated to have<br />
been 2,470,000 acre-feet, as shown in Table 47. Valley lands <strong>of</strong> this Area<br />
lie chiefly in three regional groups, each <strong>of</strong> which receives light to moderate<br />
rainfall. In the northern end <strong>of</strong> the Area, in Ventura County, valley<br />
floor precipitation averages about 15 inches per season. The largest<br />
regional group <strong>of</strong> valley lands in the Area is in the basins <strong>of</strong> the Los<br />
Angeles, San Gabriel, and Santa Ana Rivers, where average precipitation<br />
ranges from about 12 inches seasonally along the coast to about 20 inches<br />
near the base <strong>of</strong> the mountains. Precipitation on valley and mesa lands<br />
<strong>of</strong> this regional group is listed in Table 47 by ground water basins, rather<br />
than by surface drainage basins as elsewhere. In San Diego County, in<br />
the southern end <strong>of</strong> the Area, valley lands are scattered along the coast<br />
and in pockets along streams draining the interior. Average seasonal<br />
valley floor precipitation in this county ranges from about 10 to about 20<br />
inches, increasing with distance from the ocean.
WATER RESOURCES OF CALIFORNIA 199<br />
TABLE 43....,Continued<br />
MEAN, MAXIMUM, AND MINIMUM SEASONAL PRECIPITATION AT STATIONS WITH<br />
UNBROKEN RECORDS OF 10 YEARS OR LONGER, SOUTH COASTAL AREA<br />
(For Explanatory Notes, See End <strong>of</strong> Table)<br />
Mean for- Maximum and<br />
No. Ele- minimum<br />
on Name <strong>of</strong> Latitude va- Period Type and<br />
Plate station County and tiOll, <strong>of</strong> source <strong>of</strong><br />
3 longitude feet record record Period 1897<strong>of</strong><br />
1947 Season Inches<br />
record<br />
._----------------------<br />
4-125 Lowe Obser- Los Angeles 34' 13' 3,420 1896-97 BC 26.22 26.44 1913-14 43.45<br />
vatory 118' 07' 1937-38 USWB& 1898-99 10.72<br />
LAFC<br />
4-205 Mandeville Los Angeles 34' 04' 470 1928-29 CD 21.46 18.41 1940-41 40.70<br />
Canyon No.1 118' 30' 1941-42 LAFC 1932-33 13.53<br />
4-194 Mason Estate. Los Angeles 34' 05' 1,155 1931-32 CD 23.46 20.41 1940-41 47.61<br />
118' 53' 1946-47 LAFC 1932-33 15.07<br />
4-11 Mint Canyon. Los Angeles 34' 31' 2,400 1930-31 C 15.30 12.12 1940-41 27.17<br />
118' 21' 1944-45 LAFC 1933-34 8.94<br />
4-147 Monrovia Los Angeles 34' 10' 965 1917-18 C 22.55 23.83 1936-37 36.72<br />
Canyon 118' 00' 1938-39 LAFC& 1923-24 12.32<br />
(Lower End) USWB<br />
4-256 J\.{onrovia Los Angeles 34' 09' 560 1913-14 CD 20.58 19.99 1940-41 40.76<br />
(Chamber <strong>of</strong> 118' 00' 1946-47 LAFC 1923-24 10.02<br />
Commerce)<br />
4-149 Monrovia Los Angeles 34' 11' 1,800 1928-29 CD 31.62 30.03 1940-41 52.99<br />
Falls 117' 59' 1946-47 LAFC 1932-33 18.76<br />
4-148 Monrovia Los Angeles ·34' 10' 694 1920-21 CD 21.59 21.18 1940-41 38.36<br />
(O'Conner) 118' 00' 1946-47 LAFC 1923-24 11.48<br />
4-383 Montana Los Angeles 33' 51' 47 1915-16 CD 13.17 12.54 1940-41 31.13<br />
Ranch 118' 07' 1946-47 LAFC 1924-25 6.21<br />
4-156 Morris Dam __ Los Angeles 34' 11' 1,210 1930-31 D 29.16 26.93 1940-41 50.22<br />
117' 53' 1946-47 LAFC& 1941-42 16.84<br />
USWB<br />
4-124 Mt. Lowe Los Angeles 34' 14' 4,460 1926-27 BC 28.98 30.21 1934-35 45.91<br />
Tavern 118' 07' 1936-37 USWB 1932-33 17.56<br />
4-208 Mt. St. Mary's Los Angeles 34' 05' 1,025 1930-31 CD 22.07 19.09 1940-41 43.87<br />
College 118' 29' 1946-47 LAFC 1932-33 12.38<br />
4-132 Mt. Wilson Los Angeles 34' 14' 5,709 1904-05 B 34.79 33.00 1940-41 74.02<br />
Airway 118' 04' 1946-47 USWB 1923-24 17.45<br />
4-133 Mt. Wilson Los Angeles 34' 14' 5,850 1904-05 D 34.91 33.31 1940-41 74.00<br />
(Power 118' 03' 1946-47 LAFC 1923-24 17.29<br />
House)<br />
4-168 Mouth <strong>of</strong> San Los Angeles 34' 10' 2,500 1904-05 D 29.70 28.36 1940-41 48.58<br />
Antonio 117' 41' 1946-47 °LAFC 1918-19 14.40<br />
Canyon<br />
4-4 Mun. Ranch_ Los Angeles 34' 40' 3,250 1927-28 CD 21.50 19.59 1931-32 31.66<br />
118' 25' 1942-43 LAFC 1929-30 14.42<br />
4-43 Newhall______ Los Angeles 34' 23' 1,270 1877-78 B 17.61 19.01 1883-84 42.11<br />
118' 32' 1946-47 USWB 1898-99 5.44<br />
4-44 Newhall Los Angeles 34' 23' 1,245 1927-28 CD 19.87 17.98 1940-41 44.69<br />
(Forestry 118° 32' 1946-47 LAFC 1927-28 10.45<br />
Station)<br />
4-244 Newmark ____ Los Angeles 34° 03' 375 1930-31 BCD 17.20 15.20 1940-41 32.16<br />
118' 08' 1946-47 LAFC 1932-33 10.79<br />
4-372 Ninty Sixth & Los Angeles 33° 57' 121 1930-31 BCD 14.73 13.02 1940-41 30.99<br />
Central 118° 15' 1946-47 LAFC 1945-46 8.42<br />
(Edison)<br />
4-92 North Holly- Los Angeles 34° 10' 593 1906-07 BCD 17.96 17.40 1940-41 38.82<br />
wood 118° 22' 1946-47 LAFC 1924-25 8.60
WATER RESOURCES OF CALIFORNIA 213<br />
TABLE 43-Continued<br />
MEAN, MAXIMUM, AND MINIMUM SEASONAL PRECIPITATION AT STATIONS WITH<br />
UNBROKEN RECORDS OF 10 YEARS OR LONGER, SOUTH COASTAL AREA<br />
(For Explanatory Notes, See End <strong>of</strong> Table)<br />
Mean for- Maximum and<br />
No. Ele- minimum<br />
on Name <strong>of</strong> Latitude va- Period Type aud<br />
Plate station County and tioD, <strong>of</strong> source <strong>of</strong><br />
3 lougitude feet record record Period 1897<strong>of</strong><br />
1947 Season Inches<br />
record<br />
--------------------<br />
4-352 Redlands San Ber- 34· 03' 1,480 1930-31 D 15.83 14.58 1936-37 26.60<br />
(Anderson) nardino 117· 11' 1946-47 DWR 1933-34 8.31<br />
4-349 Redlauds San Ber- 34· 05' 1,225 1929-30 D 14.79 13.75 1936-37 24.33<br />
(Crowu Jewel nardino 117· 13' 1946-47 DWR 1933-34 8.19<br />
Groves)<br />
4-340 Rialto_______ . San Ber- 34· 07' 1,250 1926-27 D 18.59 17.74 1936-37 30.53<br />
nardino 117" 22' 1937-38 DWR 1932-33 11.17<br />
4-186 Running San Ber- 34· 12' 6,200 1931-32 D 44.54 41.33 1937-38 69.28<br />
Spriugs nardino 117· 07' 1946-47 DWR 1933-34 26.26<br />
4-345 San Bernar- San Ber- 34· 06' 1,050 1870-71 B 16.97 17.21 1883-84 37.51<br />
dino nardino 117· 18' 1946-47 USWB 1898-99 7.49<br />
4-346 San Bernar- San Ber- 34· 06' 1,030 1929-30 D 15.18 14.11 1940-41 29.65<br />
dino (<strong>Water</strong> nardino 117· 17' 1946-47 DWR 1933-34 7.98<br />
<strong>Department</strong>)<br />
4-360 Santa Ana San Ber- 34· 08' 2,765 1904-05 D 27.94 26.49 1915-16 44.36<br />
Power nardino 117· 03' 1946-47 DWR 1918-19 16.86<br />
House No.1<br />
4-359 Santa Ana San Ber- 34· 09' 2,850 1904-05 BCD 27.77 26.51 1936-37 45.50<br />
River nardino 117· 03' 1946-47 USWB 1918-19 16.86<br />
4-357 Santa Ana San Ber- 34· 06' 2,060 1905-06 D 20.55 19.43 1936-37 36.33<br />
(Edison No.3) nardino 117· 06' 1946-47 DWR 1912-13 9.60<br />
4-190 Seven Oaks___ San Ber- 34· 01' 5,000 1910-11 BC 27.94 26.44 1921-22 52.80<br />
nardino 116· 55' 1946-47 USWB 1912-13 13.73<br />
4-185 Squirrel Inn __ San Ber- 34· 14' 5,700 1893-94 BCD 41.31 42.19 1915-16 77.61<br />
nardino 117· 15' 1946-47 USWB 1927-28 16.39<br />
4-322 Upland San Ber- 34· 09' 1,785 1891-92 BCD 22.58 22.66 1940-41 42.40<br />
(Johnson) nardino 117· 39' 1946-47 USWB 1898-99 8.37<br />
4-321 Upland San Ber- 34· 06' 1,230 1930-31 D 22.31 20.57 1940-41 37.59<br />
(Jordan) nardino 117" 40' 1946-47 DWR 1932-33 13.22<br />
4-326 Upland (Lib- San Ber- 34· 08' 1,605 1931-32 D 23.21 21.12 1940-41 39.77<br />
erty Grove) nardino 117· 38' 1946-47 DWR 1941-42 13.70<br />
4-316 Upland San Ber- 34· 05' 1,275 1929-30 D 20.75 18.37 1940-41 35.00<br />
(Ward) nardino 117· 41' 1940-41 DWR 1932-33 13.24<br />
4-315 Upland (L. San Ber- 34· 08' 1,525 1932-33 C 21.83 20.00 1940-41 40.85<br />
Wood) nardino 117" 41' 1946-47 LAFC 1941-42 12.83<br />
4-362 Yucaipa San Ber- 34· 02' 2,705 1920-21 D 19.54 18.66 1936-37 35.93<br />
(Arnett) nardino 117" 02' 1946-47 DWR 1933-34 10.79<br />
4-560<br />
Alpine.. _____ San Diego __ 32" 50' 1,880 1935-36 B 23.30 20.53 1940-41 37.19<br />
116· 46' 1944-45 USWB 1935-36 18.61<br />
4-530 Amago. ______ San Diego__ 33· 17' 2,715 1912-13 B 27.16 26.80 1921-22 43.53<br />
116· 52' 1943-44 USWB 1933-34 12.78<br />
4-581 Barrett Dam _ San Diego__ 32· 41' 1,750 1895-96 BCD 18.35 18.49 1914-15 35.63<br />
116° 40' 1946-47 USWB 1933-34 8.61<br />
4-544 Bernardo San Diego__ 33· 04' 370 1926-27 B 17.19 16.08 1936-37 33.86<br />
Bridge 117· 04' 1946-47 CitySD 1933-34 7.41<br />
4-585 Bonita_______ San Diego__ 32· 38' 110 1899-00 BC 11.53 11.27 1940-41 25.70<br />
117° 02' 1946-47 USWB 1933-34 4.04<br />
4-592 I Campo_______ San Diego __ 32· 37' 3,000 1877-78 BD 19.03 18.30 1921-22 33.41<br />
116· 28' 1946-47 USWB 1933-34 6.49
308 WATER RESOURCES OF CALIFORNIA<br />
Sierra Nevada, and Cottonwood, Stony, Cache, and Putah Creeks which<br />
drain the coastal ranges west <strong>of</strong> the Sacramento Valley. San Joaquin<br />
River flows into the Sacramento from the south and its principal tributaries,<br />
the Cosumnes, Mokelumne, Calaveras, Stanislaus, Tuolumne, and<br />
Merced Rivers, are all from the Sierra Nevada. Kings, Kaweah, Tule, and<br />
Kern Rivers also drain from the Sierra Nevada but into Tulare Lake,<br />
rather than northward into San Joaquin River. A portion <strong>of</strong> the flood<br />
flow <strong>of</strong> Kings River is tributary to San Joaquin River, by way <strong>of</strong> Fresno<br />
Slough, and in times past during periods <strong>of</strong> flood Tulare Lake has overflowed<br />
into San Joaquin River. No large streams enter San Joaquin<br />
Valley from the coastal ranges. Areas <strong>of</strong> drainage basins in the Central<br />
Valley Area are listed in Table 53.<br />
PRECIPITATION<br />
It is difficult to generalize regarding precipitation <strong>of</strong> the Central<br />
Valley Area in terms <strong>of</strong> "light," "moderate," or"heavy." Storms<br />
sweeping in from the ocean over the coastal ranges and across the Central<br />
Valley are influenced by changes in elevation. As elevation is gained on<br />
the west slope <strong>of</strong> the coastal ranges precipitation increases. Inversely, it<br />
diminishes down the east slope. In general, little variation is registered<br />
as storms pass eastward across the Central Valley floor, but as they<br />
ascend the west slope <strong>of</strong> the Sierra Nevada precipitation again increases,<br />
reaching the maximum as the crest is approached. Then, as storms pass<br />
over the crest and down the east side, it again decreases.<br />
Heavy snowfall is a winter feature <strong>of</strong> the Sierra Nevada at elevations<br />
above about 3,000 feet in the northern portions and above about<br />
4,000 feet in the south. Its depths are exceeded in few parts <strong>of</strong> the United<br />
<strong>State</strong>s. In March, 1907, and again in 1911, 308 inches <strong>of</strong> snow was measured<br />
at Donner Summit. During the seasons <strong>of</strong> 1880 and 1890, as estimated<br />
from records <strong>of</strong> marks at stations on the transcontinental railroad<br />
crossing the Sierra Nevada, the fall was 370 inches. These figures are<br />
given for snow depths at time <strong>of</strong> measurement. Accretions during a season<br />
have exceeded 800 inches at Tamarack, at an elevation <strong>of</strong> 8,000 feet<br />
in Alpine County. The Cascade Range on the Olympic Peninsula in<br />
WashingtQn is the only area in the United <strong>State</strong>s to record greater<br />
depths. Snow in measurable quantities on floors <strong>of</strong> the Sacramento and<br />
San Joaquin Valleys is rare.<br />
Two hundred and ninety-nine precipitation stations with records <strong>of</strong><br />
10 years or more are being maintained in the Central Valley Area. They<br />
are listed in Table 54, together with mean, maximum and minimum seasonal<br />
precipitation. These stations are at elevations ranging from sea level<br />
to 8,000 feet. The longest record is for the station at Sacramento, which is<br />
unbroken since 1849. Precipitation stations in the Central Valley Area<br />
with continuous recorders are listed in Table 55. Stations with records <strong>of</strong><br />
less than ten years are listed in Table 56.<br />
Precipitation in the Area decreases progressively from north to<br />
south. Mean seasonal rainfall on the floor <strong>of</strong> Sacramento Valley between<br />
the Sacramento-San Joaquin Delta and Red Bluff varies in general from<br />
15 inches to 25 inches. On the San Joaquin Valley floor, which is bounded<br />
by a seasonal isohyet <strong>of</strong> 15 inches, minimum seasonal precipitation <strong>of</strong><br />
less than five inches may occur in the Tulare Lake and Buena Vista Lake<br />
sections. A minimum seasonal total <strong>of</strong> 0.57 inch was recorded at Rio
346 WATER RESOURCES OF CALIFORNIA<br />
RUNOFF<br />
Estimated mean seasonal natural run<strong>of</strong>f <strong>of</strong> the Central Valley Area<br />
for the 53 years from 1894-95 to 1946-47 is 33,636,000 acre-feet, or 47.5<br />
percent <strong>of</strong> total surface run<strong>of</strong>f from mountain and foothill lands in the<br />
<strong>State</strong>. The minimum seasonal flow <strong>of</strong> 9,280,000 acre-feet occurred in<br />
1923-24, and the maximum, totalling 63,300,000 acre-feet, in 1906-07. The<br />
10-year period from 1923-24 to 1932-33 was the driest <strong>of</strong> record in this<br />
Area. Run<strong>of</strong>f during each <strong>of</strong> those 10 years, except 1926-27, was less than<br />
the 53-year mean, and the average was only 66.3 percent <strong>of</strong> this long-time<br />
mean.<br />
Run<strong>of</strong>f from drainage basins <strong>of</strong> the Central Valley Area is derived<br />
largely from snow. Consequently, the major portion <strong>of</strong> seasonal run<strong>of</strong>f<br />
comes during late spring and early summer months from March to June,<br />
inclusive. For Sacramento River the run<strong>of</strong>f during these months is 42.8<br />
percent <strong>of</strong> the seasonal total, for American River, 65.4 percent, and for<br />
Kings River, 71.8 percent. Minimum run<strong>of</strong>f comes from August to<br />
October, inclusive, flow for this period being 9.7 percent <strong>of</strong> total seasonal<br />
run<strong>of</strong>f for Sacramento River, 2.1 percent for the American, and 5.5 percent<br />
for the Kings. Sacramento River drains a region <strong>of</strong> porous lava<br />
formation, with large underground storage capacity. Summer flow <strong>of</strong><br />
the Sacramento is therefore better sustained than is that <strong>of</strong> other streams<br />
in the Area.<br />
An indication <strong>of</strong> variation in monthly flow <strong>of</strong> Central Valley Area<br />
streams, and <strong>of</strong> the percentage <strong>of</strong> seasonal run<strong>of</strong>f that comes during .<br />
each month, is given by data for Sacramento River at Red Bluff, American<br />
River at Fair Oaks and Kings River at Piedra listed in Table 59.<br />
The first records <strong>of</strong> stream flow in the Central Valley Area were<br />
obtained by Wm. Ham. Hall, <strong>State</strong> Engineer from 1878 to 1884. The<br />
only stream gaging station then maintained in the Sacramento River<br />
Basin was at Collinsville, at the mouth <strong>of</strong> the Sacramento. In the San<br />
Joaquin River Basin 20 gaging stations were maintained, most <strong>of</strong> them<br />
at the base <strong>of</strong> the foothills. All stations established by <strong>State</strong> Engineer<br />
Hall were discontinued after 1884, when the <strong>of</strong>fice <strong>of</strong> <strong>State</strong> Engineer<br />
was abolished. As <strong>of</strong> September 30, 1947, records from 96 stations were<br />
published by the United <strong>State</strong>s Geological Survey in the Sacramento<br />
River Basin and 105 in the San Joaquin River Basin.<br />
The first gaging station established in the Sacramento River Basin<br />
by the Geological Survey wa,
WATBR RESOURCES OF CALIFORNIA<br />
streams for simultaneous periods. Estimates <strong>of</strong> mean seasonal run<strong>of</strong>f for<br />
minor drainage areas on the west side <strong>of</strong> the San Joaquin Valley were<br />
derived by establishing the relationship between mean precipitation and<br />
run<strong>of</strong>f in that part <strong>of</strong> the Area. An estimate <strong>of</strong> mean seasonal run<strong>of</strong>f for<br />
the Sacramento Yalley floor was made by correlating recorded inflows<br />
at various points with average precipitation on the valley floor.<br />
Estimated natural run<strong>of</strong>f for the seasons from 1894-95 to 1946-47,<br />
from main stream and tributary basins for which there are complete or<br />
partial records, is given in Table 62.<br />
TABLE 59<br />
AVERAGE MONTHlY DISTRIBUTION OF AVERAGE SEASONAl. RUNOFF<br />
FOR THREE CENTRAL VALLEY STREAMS<br />
Month<br />
Oetober__ • ____ • __ • _____ • __ ._<br />
No...ember__ • ______________ ._<br />
December_________ • _________<br />
&cramento Ri...er AmericaD Ri..... KiDpRi......<br />
&& Red Bluft at FairOab at Piedra<br />
Monthly Percent<br />
I !>Ionthly Percent Mooth1y Percent<br />
runolf <strong>of</strong> runolf <strong>of</strong> run<strong>of</strong>f <strong>of</strong><br />
in IM!llIOODal in IM!llIOODal in _nal<br />
_feet total -reet total -reet total<br />
280.000 3.3 20,000 0.9 22,000 1.3<br />
450.000 5.4 60.000 2.2 25.000 1.5<br />
700,000 8.4 130,000 4.9 37,000 2.2<br />
January___________ • __ ._.___ • 1,110,000 13.2 270.000 9.9 64.000 3.8<br />
Februat)·______ • _________ ••_. 1,380,000 16.4 330,000 12.5 81.000 4.8<br />
Mareh. ______ • _____________ • 1,330,000 15.8 420,000 15.6 127,000 7.5<br />
."priL. __ • _••__ • _______ • _____ 1,040,000 12.4 4110,000<br />
May________________________<br />
18.1 225,000 13.3<br />
740.000 8.8 540,000 20.0 443,000<br />
June__________ . __ . __________<br />
26.2<br />
4110.000 5.8 310,000 1l.7 419,000 24.8<br />
July_____ ._ • __ . __ . ________ ._ 340,000 4.1 80,000 3.0 176.000 10.4<br />
Aueun____ -_. -_. -__ - __ --•___ 280,000 3.3 20,000 0.7 51.000 3.0<br />
September_'____ • _______ •"'_ 260,000 3.1 10,000 0.5 20,000 1.2<br />
Totaill_________• _______ • 8,400,000 I 100.0 2,680,000 100.0 l,lIllO,OOO 100.0<br />
I
414 WATER RESOURCES OF CALIFORNIA<br />
flOOD FLOWS<br />
Histories <strong>of</strong> early settlements in Sacramento Valley mention a great<br />
flood in 1805 which is supposed to have covered the entire valley except<br />
the Sutter Buttes. It is related that thousands <strong>of</strong> Indians were drowned.<br />
Stories handed down by Indians and trappers tell <strong>of</strong> another flood <strong>of</strong><br />
large but indeterminate magnitude in 1825. There are reliable accounts <strong>of</strong><br />
devastation that year in the south, but the authenticity <strong>of</strong> Indian legends<br />
regarding devastion in the north is questionable.<br />
The Forty-Niners met their first flood in 1849-50, when the Sacramento<br />
Valley was partially inundated. It is reported that small mountain<br />
streams became raging torrents, and that the larger rivers generally<br />
flooded wide stretches <strong>of</strong> the valley floor. According to one early writer,<br />
"The valley <strong>of</strong> the Sacramento was like an inland sea, and the city <strong>of</strong><br />
Sacramento became a second Venice," and "instead <strong>of</strong> gondolas, the<br />
honest miners navigated the submerged streets in wagon-boxes, bakers'<br />
troughs, crockery crates, and on rafts made <strong>of</strong> whiskey-kegs."<br />
Descriptions <strong>of</strong> the floods <strong>of</strong> 1861-62, by Thomas Rowlandson, are<br />
contained in Bancr<strong>of</strong>t's "Hand-Book Almanac for the Pacific <strong>State</strong>s,<br />
1863. " Following these floods, the author toured the West Coast from<br />
Mexico to the Canadian border. He states that there were three heavy<br />
storms between December 9, 1861, and January 10, 1862, extending the<br />
full length <strong>of</strong> the Pacific Coast. Each was preceded by a heavy snowfall<br />
that reached to the valley floors. According to William H. Brewer'8<br />
description <strong>of</strong> these floods in "Up and Down in <strong>California</strong> in 1860-1864,"<br />
the "great central valley" <strong>of</strong> the <strong>State</strong> was under water-"a region 250<br />
to 300 miles long and an average <strong>of</strong> at least 20 miles wide, a district <strong>of</strong><br />
5,000 or 6,000 square miles, or probably three to three and a half million<br />
acres." Thousands <strong>of</strong> farms, he stated, were entirely under water, with<br />
cattle starving and drowning.<br />
In January, 1862, the American River rose to a height probably not<br />
since equalled. Many bridges were destroyed, isolating whole communities,<br />
and at Folsom a flour mill was washed away taking with it a wire<br />
suspension bridge. The attested high water mark <strong>of</strong> this flood, made on an<br />
old stone stable on the left bank <strong>of</strong> American River 1.5 miles above Folsom,<br />
indicates that the flood crest would have registered 39.3 feet on the<br />
present gage at Folsom, or 7 feet higher than the crest <strong>of</strong> March, 1928.<br />
After the flood <strong>of</strong> 1861-62, it was estimatedthat more than one-fourth<br />
<strong>of</strong> all taxable property in the <strong>State</strong> had been destroyed, and the <strong>State</strong><br />
Treasurer thought the tax list would be cut one-third. This was the greatest<br />
and most disastrous general flood in <strong>California</strong> <strong>of</strong> which there is<br />
authentic record, and there is much interesting and reliable information<br />
available regarding it. Some <strong>of</strong> the local newspapers, notably the" Sacramento<br />
Union" and the "Alta <strong>California</strong>." carried day-by-day accounts<br />
<strong>of</strong> its progress.<br />
There have been many damaging floods in the Central Valley Area<br />
since 1861-62. One <strong>of</strong> the greater <strong>of</strong> these was in 1907 when an estimated<br />
300,000 acres <strong>of</strong> reclaimed land in the Sacramento-San Joaquin Delta<br />
was submerged. owing to the breaking <strong>of</strong> many levees. During four days<br />
from March 18th to 21st the mean flow from the Sacramento and San<br />
Joaquin River watersheds was about 732,000 second-feet. Floods in 1909<br />
were comparable in run<strong>of</strong>f and disaster to any known up to that time, and<br />
conditions were again critical in 1911. Records at gaging stations on many
420<br />
WATEB RESOUBCES OF CALIFORNIA.<br />
Flood.frequency studies involving run<strong>of</strong>f resulting primarily from<br />
snow melt were made for the streams listed below, the flood-frequency<br />
curves appearing 88 Plates 78 to 82. These studies were <strong>of</strong> total run<strong>of</strong>f for<br />
the period from April 1st to July 31st. Although some run<strong>of</strong>f during this<br />
period resulted from rainfall, this was <strong>of</strong> minor influence.<br />
Kern River near Bakersfield;<br />
Tule River above South Fork near Porterville;<br />
Kaweah River near Three Rivers ;<br />
Kings River at Piedra;<br />
San Joaquin River near Friant;<br />
Merced River at Exchequer;<br />
Tuolumne River above La Grange Dam near La Grange;<br />
Stanislaus River below Melones Powerhouse ;<br />
Mokelumne River near Clements.
WATER RESOURCES OF CALIFORNIA 465<br />
content. Boron is also present in significant amounts in ground waters<br />
<strong>of</strong> Cache Creek Basin.<br />
West-side ground waters in the San J oaquin Valley are characterized<br />
by high percentage <strong>of</strong> sulphate and abnormal amounts <strong>of</strong> boron,<br />
<strong>of</strong>ten in toxic concentrations. Nearly all have a brackish taste and many<br />
are unpalatable. The predominating sulphate radical usually has a concentration<br />
below the upper limit <strong>of</strong> safe use for irrigation. The usable<br />
zone <strong>of</strong> pumping on the west side <strong>of</strong> the San Joaquin Valley from Mendota<br />
to Buttonwillow is generally found between overlying unusable<br />
perched water, underlying brines, and a more or less effective impervious<br />
stratum in the trough <strong>of</strong> the valley, commonly known as the Mendenhall<br />
Dike. Calcium and magnesium are dominant bases in both east-side and<br />
west-side ground waters. These bases are generally subordinated by<br />
sodium toward the trough <strong>of</strong> the valley, from Sutter Basin south to<br />
Buena Vista Lake. Chloride is <strong>of</strong>ten the principal acid radical in axial<br />
ground waters, although bicarbonate concentrations remain high. In the<br />
trough <strong>of</strong> the San Joaquin Valley, ground waters between depths <strong>of</strong><br />
about 300 feet and about 1,000 feet generally are lower in mineral content<br />
than are shallow waters. Axial ground waters are characterized by<br />
diverse composition and concentration <strong>of</strong> salts.<br />
GROUND WATER STORAGE CAPACITY OF SACRAMENTO VALLEY<br />
For some years the <strong>State</strong> <strong>of</strong> <strong>California</strong> has cooperated with the<br />
United <strong>State</strong>s Geological Survey in ground water investigations, and<br />
the results have been published in numerous reports <strong>of</strong> the Geological<br />
Survey. A summary <strong>of</strong> a recent unpublished report entitled" Ground<br />
<strong>Water</strong> Storage Capacity <strong>of</strong> the Sacramento Valley, <strong>California</strong>," by J. F.<br />
Poland and others, dated November 1949, appears in this bulletin as<br />
Appendix D.
480 WATER RESOUHCJ::S OF CALWORNIA<br />
DONNER LAKE-LAHONTAN AREA<br />
(Dl"/.flo,,, 01 HIghw(lJ/s "'10M)
Number<br />
on<br />
Plate 2<br />
12<br />
13<br />
14-1<br />
14-2<br />
14-3<br />
14-4<br />
WATER RESOURCES OF CALIFORNIA<br />
TABLE 65-Continued<br />
AREAS OF DRAINAGE BASINS, LAHONTAN AREA<br />
In Square Miles<br />
(Only Figures in Bold Face Type Are Carried Into "Totals, Lahontan Area")<br />
Stream or stream group basin<br />
Huntoon Valley Basin in <strong>California</strong> _<br />
Adobe Valley Basin _<br />
In Nevada _<br />
In <strong>California</strong>____ _ ______ _ _<br />
Owens River Basin<br />
Above gage near Round Valley _<br />
Rock Creek above gage near Little Round Valley _<br />
Remainder <strong>of</strong> Owens River above Tinemaha Reservoir<br />
Above Tinemaha Reservoir _<br />
Remainder <strong>of</strong> Owens River- _<br />
Owens River _<br />
In Nevada _<br />
In <strong>California</strong> _<br />
15 Cottonwood Creek Group _<br />
16 Deep Springs Group _<br />
17 Amargosa River Basin<br />
In Nevada _<br />
In <strong>California</strong> _<br />
18 Ivanpah Valley Group in <strong>California</strong> _<br />
Mojave River Basin<br />
19-1 Above gage at Lower Narrows near Victorville _<br />
19-2 Remainder <strong>of</strong> Mojave River _<br />
Mojave River _<br />
20 Antelope Valley Basin _<br />
Searles Lake Group<br />
21-1 East drainage <strong>of</strong> Sierra Nevada Mountains _<br />
21-2 Remainder <strong>of</strong> Searles Lake Group _<br />
Searles Lake Group _<br />
Mountains<br />
and<br />
foothills<br />
22<br />
194<br />
(7)<br />
187<br />
285<br />
36<br />
1,130<br />
1,451<br />
1,012<br />
2,463<br />
(54)<br />
2,409<br />
231<br />
1,419<br />
(1,762)<br />
&,124<br />
&99<br />
282<br />
3,2I.5<br />
3,497<br />
&96<br />
670<br />
3,781<br />
4,451<br />
Valley<br />
and<br />
mesa<br />
o<br />
88<br />
(3)<br />
8&<br />
149<br />
o<br />
327<br />
476<br />
258<br />
734<br />
(10)<br />
724<br />
54<br />
230<br />
(719)<br />
1,318<br />
256<br />
249<br />
1,160<br />
1,409<br />
1,820<br />
27<br />
1,710<br />
1,737<br />
483<br />
Totals<br />
22<br />
282<br />
(10)<br />
272<br />
434<br />
36<br />
1,457<br />
1,927<br />
1,270<br />
3,197<br />
(64)<br />
3,133<br />
28&<br />
1,649<br />
(2,481)<br />
6,442<br />
8&&<br />
531<br />
4,375<br />
4,906<br />
2,416<br />
697<br />
5,491<br />
6,188<br />
TOTALS, LAHONTAN AREA IN CALI-<br />
FORNIA_____ __ __ __ __ __ 23,012 9,895 32,907
SIERRA NEVADA FROM OWENS V ALLEY<br />
(Division <strong>of</strong> Highways Photo)
WATER RESOURCES OF CALIFORNIA 497<br />
RUNOFF<br />
Estimated mean seasonal natural run<strong>of</strong>f <strong>of</strong> the Lahontan Area for<br />
the 53-year period from 1894-95 to 1946-47 is 3,177,000 acre-feet, or 4.5<br />
percent <strong>of</strong> total surface run<strong>of</strong>f <strong>of</strong> the <strong>State</strong>. Minimum seasonal run<strong>of</strong>f<br />
amounting to 930,000 acre-feet occurred in 1923-24, and the maximum,<br />
totalling 7,070,000 acre-feet, in 1906-07. <strong>Water</strong> supply during each year<br />
<strong>of</strong> the 10-year period from 1923-24 to 1932-33, except 1926-27, was less<br />
than the 53-year seasonal mean, and the average was only 63 percent <strong>of</strong><br />
this long-time mean.<br />
Snow falls on large portions <strong>of</strong> the tributary drainage <strong>of</strong> the Lahontan<br />
Area. Consequently, a substantial portion <strong>of</strong> seasonal run<strong>of</strong>f is delayed<br />
until late spring and early summer. For Truckee River, a typical<br />
Lahontan Area stream that flows from the Sierra Nevada, snow melt<br />
contributes 95 percent <strong>of</strong> seasonal run<strong>of</strong>f. Minimum run<strong>of</strong>f in the Area<br />
occurs from August to October, inclusive. On Truckee River run<strong>of</strong>f<br />
during these months is only 4.9 percent <strong>of</strong> the seasonal total.<br />
Stream gaging stations in the Lahontan Area, are listed in Table 71<br />
together with the average, maximum and minimum seasonal run<strong>of</strong>f for<br />
stations with more than 10 years <strong>of</strong> record. Longest available records <strong>of</strong><br />
stream flow are for Truckee River at or near the state line, and for Owens<br />
River near Round Valley. The record for the 'rruckee has been maintained<br />
since September, 1899, and that for Owens River since August,<br />
1903, except from October, 1923, to March, 1927. Records for these two<br />
stations are no longer published by the Geological Survey, but may be<br />
secured from the Federal Court <strong>Water</strong>master for Truckee River and<br />
from the <strong>Department</strong> <strong>of</strong> <strong>Water</strong> and Power <strong>of</strong> the City <strong>of</strong> Los Angeles<br />
for Owens River.<br />
Estimated mean seasonal natural run<strong>of</strong>f <strong>of</strong> the 53 years from 1894-95<br />
to 1946-47, shown in Table 72, has been prepared i:r{ the same manner<br />
as corresponding tables in preceding chapters. For stations with partial<br />
records, mean seasonal run<strong>of</strong>f shown is the mean <strong>of</strong> estimated natural<br />
flow for each season <strong>of</strong> the 53-year period. At locations where records are<br />
not available, only directly derived long-time mean estimates are given.<br />
Estimates <strong>of</strong> seasonal natural run<strong>of</strong>f <strong>of</strong> main stream and tributary<br />
basins having records, presented in Table 73, were made in accordance<br />
with principles outlined in Chapter III. Estimates <strong>of</strong> run<strong>of</strong>f from drainage<br />
basins where records were not available were made by comparison<br />
with run<strong>of</strong>f from other basins. In deriving the 53-year seasonal mean for<br />
unmeasured streams discharging into lakes in the northern portion <strong>of</strong><br />
the Area, inflow to a lake, computed from records <strong>of</strong> lake levels, was taken<br />
to be run<strong>of</strong>f <strong>of</strong> the stream during the period <strong>of</strong> record. A relationship<br />
was then established with an adjacent stream, and the missing record<br />
was estimated by the third method <strong>of</strong> restoring missing records described<br />
in Chapter III.<br />
Estimates <strong>of</strong> mean seasonal run<strong>of</strong>f for streams or basins for which<br />
no records <strong>of</strong> any type existed were made by comparison with run<strong>of</strong>f <strong>of</strong><br />
adjacent areas, on the basis <strong>of</strong> geographical, geological and meteorological<br />
conditions. The portion <strong>of</strong> mean seasonal run<strong>of</strong>f that was estimated for<br />
the Lahontan Area approximates 1,183,000 acre-feet, the remaining<br />
1,994,000 acre-feet being based on records.<br />
An unusual feature <strong>of</strong> the natural flow estimate for Truckee River,<br />
in Table 73, is the occurrence in several years <strong>of</strong> negative values in esti-
498 WATER RESOURCES OF CALIFORNIA<br />
mated flow above the outlet <strong>of</strong> Lake Tahoe. This is due to evaporation<br />
from the lake, estimated to approximate 375,000 acre-feet seasonally. In<br />
years for which negative values <strong>of</strong> flow are shown, estimated evaporation<br />
exceeded inflow by the amounts given in the table.<br />
An indication <strong>of</strong> variation in monthly flow in streams in the Lahontan<br />
Area draining from the Sierra Nevada is given by data for Truckee<br />
River at the state line, presented in the following tabulation:<br />
AVEIlAGI MONnaT DlSRlaunoN Of AVEIlAGI SIA50NAL RUNOFF, TRUCKlE<br />
RIVER IUWIEN LAKE TAHOI AND FARAD<br />
(Drainage Area-425 Squar. Miles)<br />
October_•.. 00. __<br />
November.. _<br />
December_" _<br />
laouary__ • . __<br />
February... _<br />
March. __ . _<br />
. ---- ::1<br />
-------1<br />
Pereellt<strong>of</strong><br />
llea80naJ average<br />
Acre-f""t<br />
1.8 7,000<br />
2.5 10.000<br />
3.2 13,000<br />
4.2 17,000<br />
4.8 19.000<br />
9.8 311,000<br />
April..<br />
May<br />
June __ •<br />
_<br />
_<br />
_<br />
21.4<br />
26.8<br />
17.0<br />
85,000<br />
106.000<br />
67,000<br />
5.4 21,000<br />
1.7 7,000<br />
1.4 6.000<br />
E::;,;;·.· ••·•• •··•···•·.•• •· .••.··•·· •• ·•· ••• ··I------;------ Totals __ . _ _ . _.<br />
100.0 397,000
JOSHUA TREES-COLORADO DESERT AREA<br />
(Division 0/ HighwaY8 Photo)
CHAPTER X. COLORADO DESERT AREA<br />
Although the Colorado Desert Area is characteristically arid, it is<br />
rimmed by high mountains on the northwest, with peaks that may be<br />
described as Alpine in nature. Irrigation by surface water from the<br />
Colorado River, and by pumping from ground water in the Coachella<br />
Valley has transformed great acreages <strong>of</strong> desert lands into productive<br />
farmlands, making the Area one <strong>of</strong> the most outstanding agricultural<br />
regions in the <strong>State</strong>.<br />
LOCATION AND DESCRIPTION<br />
The Colorado Desert Area, designated Area No. 7 on Plate 2,<br />
embraces the portion <strong>of</strong> the Colorado River Basin that is within <strong>California</strong>,<br />
including the Salton Sea Basin and local sinks east <strong>of</strong> the South<br />
Coastal Area. It extends from the southern boundary <strong>of</strong> the Lahontan<br />
Area to the <strong>California</strong>-:\Iexico boundary. Large expanses are below sea<br />
level, the lowest point being Salton Sink with its lowest elevation 278 feet<br />
below sea level. The Area lies between latitudes 32Jo and 35!0 N., and<br />
extends about 180 miles north to south and about 150 miles east to west.<br />
The Colorado River, which forms the eastern boundary <strong>of</strong> Southern<br />
<strong>California</strong> and borders the Colorado Desert Area on the east, together<br />
with its great drainage basin <strong>of</strong> over 250.000 square miles reaching into<br />
seven states, is considered in Appendix E, "Colorado River. "<br />
STREAMS AND AREAS OF DRAINAGE BASINS<br />
Most <strong>of</strong> the run<strong>of</strong>f in the Colorado Desert Area is derived from the<br />
southern portion <strong>of</strong> the San Bernardino Mountains, from which Whitewater<br />
River drains into Salton Sea. Several minor streams drain from<br />
the San Jacinto and Peninsular Ranges toward Salton Sea. New and<br />
Alamo Rivers, old overflow channels <strong>of</strong> Colorado River, flow from the<br />
<strong>California</strong>-Mexico border through Imperial Valley to Salton Sea, but<br />
they now contribute no natural run<strong>of</strong>f, carrying only waste and other<br />
drainage from canals and irrigated lands <strong>of</strong> the Imperial Valley and the<br />
Mexicali Valley in Mexico. Streams directly tributary to Colorado River<br />
in this Area are small, with only sporadic flow. Table 76 lists areas <strong>of</strong><br />
drainage basins in the Colorado Desert Area.<br />
PREOPITATION<br />
Seasonal precipitation in the Colorado Desert Area is light, the<br />
seasonal average for stations with records extending ten years or longer,<br />
shown in Table 77, being 7.9 inches. For stations under 1,000 feet in elevation<br />
the seasonal average is 3.6 inches, and for those above 1,000 feet it is<br />
20.6 inches. Three-fourths <strong>of</strong> the seasonal precipitation occurs from<br />
December to April, inclusive, but local cloudbursts <strong>of</strong> high intensity are<br />
not infrequent from :May to November.<br />
Summers in the Colorado Desert Area are hot, with low relative<br />
humidity, and there is marked contrast between day and night temperatures<br />
during all seasons. Eighty-five percent <strong>of</strong> possible sunshine is<br />
( 525 )
526 WATER RESOURCES OF CALIFORNIA<br />
Number<br />
on<br />
Plate 2<br />
TABLE 76<br />
AREAS OF DRAINAGE BASINS, COLORADO DESERT AREA<br />
In Square Miles<br />
(Only Figures in Bold Face Type Are Carried Into "Totals, Colorado Desert Area")<br />
Stream or stream group basin<br />
Mountains Valley<br />
and and<br />
foothills mesa<br />
Totals<br />
1 Mojave Desert Group_______________________________ 5,833 2,T64. 8,59T<br />
2 Whitewater River Basin. ____________________________ l,OT4. 500 l,5T4.<br />
3 West Salton Sea Group_____________________________ 84 341 425<br />
4 Carrizo Creek Group___ . ____________________________ 969 489 1,458<br />
5 Coyote Wash Group________________________________ ,<br />
96 182 2T8<br />
6 Imperial Irrigation District Group. ___________________ 11 1,683 1,694<br />
7 East Salton Sea Group______________________________ 63T TTl 1,4.08<br />
Direct drainage to Colorado River<br />
8-1 Pilot Knob Group________________________________ 81 231 312<br />
8-2 Yuma Group____________________________________ 345 610 955<br />
8-3 Blythe Group____________________________________ 155 563 718<br />
8-4 Needles Group___________________________________ 644 1,667 2,311<br />
Colorado River direct_____________________________ 1,225 3,OT! 4,296<br />
TOTALS, COLORADO DESERT AREA IN<br />
CALIFORNIA___________________________ 9,929 9,801 19,T30<br />
normal. Prevailing winds are from the west, with highest velocities in<br />
the spring. Of the 20 precipitation stations in the Area that have unbroken<br />
records <strong>of</strong> 10 or more seasons, that at Indio has the longest record, being<br />
unbroken since 1878. The 20 stations now maintained are insufficient to<br />
cover adequately the 19,730 square miles in the Area.<br />
Maximum recorded seasonal precipitation in the Area occurred at<br />
Raywoods Flat, at an elevation <strong>of</strong> 7,200 feet in San Bernardino County,<br />
in 1936-37, and amounted to 68.34 inches. Ave:rage seasonal precipitation<br />
at this station is 39.22 inches. Palm Springs, at an elevation <strong>of</strong> 584 feet<br />
in Riverside County, recorded no precipitation during 1896-97, the<br />
seasonal average at this station being 5.77 inches. At Bagdad, at an elevation<br />
<strong>of</strong> 784 feet in San Bernardino County, there was no precipitation<br />
during 1917-18, and average seasonal precipitation is only 2.24 inches.<br />
Elevations <strong>of</strong> the 20 present stations range from 250 feet below sea level<br />
to 7,200 feet above.<br />
Continuous recorders are maintained at nine precipitation s,tations<br />
in the Area, as listed in Table 78, the first having been installed at Coachella<br />
in 1939. Records provided by these recorders are not <strong>of</strong> sufficient<br />
length to show satisfactorily rainfall intensities to be expected in the<br />
Area. Precipitation stations with records <strong>of</strong> less than 10 years are listed<br />
in Table 79. Data presented in Table 80, and on the bar diagrams <strong>of</strong><br />
Plate 88, "Distribution <strong>of</strong> Precipitation at Selected Stations, Colorado<br />
Desert Area," relate to monthly distribution <strong>of</strong> precipitation at four<br />
stations considered representative <strong>of</strong> the Area with respect to elevations<br />
and topography. At each <strong>of</strong> these stations the minimum recorded precipitation<br />
for every month <strong>of</strong> the year was zero.
WATER RESOURCES OF CALIFORNIA 527<br />
Mean seasonal precipitation on valley and mesa lands <strong>of</strong> the Colorado<br />
Desert Area for the period from 1897-98 to 1946-47 is estimated to have<br />
been 2,030,000 acre-feet, as shown in Table 81. Precipitation records are<br />
so scattered in this Area that this estimate is no more than a rough<br />
approximation. Although nearly half <strong>of</strong> the Colorado Desert Area is<br />
classed as valley or mesa land, rainfall upon it is generally so light that<br />
aggregate contribution from this source to the <strong>State</strong>'s water resources<br />
is <strong>of</strong> little practical significance.
530 WATER RESOURCES OF CALIFORNIA<br />
File<br />
number<br />
TABLE 79<br />
PRECIPITATION STATIONS WITH RECORDS OF LESS THAN 10 YEARS,<br />
COLORADO DESERT AREA<br />
Latitude Eleva- Period Type<br />
Station County and tion, <strong>of</strong> <strong>of</strong><br />
longitude feet record record<br />
------<br />
7-001 El Centro______ ------------- ImperiaL_______ 32" 47' 39 1942-47 A<br />
115° 34'<br />
7-002 Heber______________________ ImperiaL_______ 32° 44' -20 1906-14 B<br />
115° 28'<br />
7-003 Ogilby __________________ ImperiaL_______ 32° 49' 354 1897- C<br />
114° 50' 1903<br />
7-004 Picacho____________ Imperiae_______ 33° 01' 250 1896-98 B<br />
114° 37'<br />
7-005 Andreas Canyon______________ Riverside_______ 33° 45' 800 1920-22 B<br />
116° 33'<br />
7-006 Andreas Garden_______________ Riverside_______ 33° 47' 700 1920-22 B<br />
116° 33'<br />
7-007 Blythe Airport __________ Riverside_______ 33° 37' 385 1940-47 A<br />
114° 43'<br />
7-008 Coachella__________ ----- -- --- Riverside_______ 33° 41 ' -70 1940-47 A<br />
116° 10'<br />
7-009 Millard Canyon____ ---------- Riverside___ ____ 33° 57' 2,500 1919-22 B<br />
116° 48'<br />
7-010 Millard Forks____________ Riverside_______ 33° 59' 3,500 1919-22 B<br />
116° 47'<br />
7-011 Mission Valley____ Riverside_______ 34° 00' 1,700 1918-22 B<br />
116° 34'<br />
7-012 Palm Canyon____ ----------- Riverside_______ 33° 43' 1,400 1919-21 B<br />
116° 32'<br />
7-013 Whitewater Canyon______ Riverside_______ 33° 54' 1,500 1919-21 B<br />
116° 38'<br />
7-014 Whitewater Ranch____ Riverside_______ 33° 57' 1,200 1920-21 B<br />
lljlo 39'<br />
7-015 Los Florcs___ _________ ___ _____ San Bernardino 34° 04' 1,390 1944 A<br />
116° 39'<br />
7-016 Canebrake Canyon____________ San Diego______ 32° 52' 2,460 1945-47 A<br />
116° 20'<br />
TYPE OF RECORD<br />
A bbrev;ation Name<br />
A Hourly<br />
B Daily<br />
C Monthly
WATER RESOURCES OF CALIFORNIA 537<br />
FLOOD FLOWS<br />
Floods in streams and dry washes <strong>of</strong> the Colorado Desert Area are<br />
generally local in nature. While damage resulting from them has occasionally<br />
been severe, it has been mainly limited to highways and railroads,<br />
and to canals in the Imperial Valley. Principal cause <strong>of</strong> these<br />
local floods has been summer cloudbursts. Because <strong>of</strong> lack <strong>of</strong> available<br />
data, no studies <strong>of</strong> flood frequencies in the Area have been attempted<br />
during the present investigation. Flood flows in Colorado River are<br />
related to the entire Colorado River Basin and are discussed generally<br />
in Appendix E.<br />
As a matter <strong>of</strong> historical interest, a flood <strong>of</strong> great magnitude in the<br />
Colorado Desert Area resulted in 1905 and 1906 from an uncontrolled<br />
diversion from Colorado River into Imperial Valley. On May 17, 1904,<br />
the <strong>California</strong> Development Company, through a Mexican subsidiary,<br />
"La Sociedad de Reigos y Terrenos de la Baja Oalifornia," was granted<br />
a right by the Mexican Government to convey through Mexico, to the<br />
United <strong>State</strong>s, water diverted in the United <strong>State</strong>s or in Mexico and, in<br />
addition, a right to divert 10,000 second-feet <strong>of</strong> water from the Colorado<br />
River in Mexico for such purpose.<br />
Because <strong>of</strong> physical difficulty experienced in diverting water from<br />
the Colorado in the United <strong>State</strong>s, two dredger cuts were made from the<br />
river in Mexico to accomplish this diversion. The cuts extended to the<br />
Alamo Canal, also known as the Imperial Canal, and the first was immediately<br />
below, and the second about four miles below the International<br />
Boundary. Pending approval by the Mexican Government <strong>of</strong> the right to<br />
install control gates in these cuts, none was constructed, but water neverthe<br />
less was diverted into Alamo Canal. Unprecedented floods from<br />
Gila River in Arizona during the winter <strong>of</strong> 1904-05 made closing <strong>of</strong> the<br />
lower cut imperative, but efforts to do this were unavailing. This cut,<br />
originally 60 feet wide, had been greatly enlarged by the river, as had<br />
also the Alamo Canal below the cut. By August, 1905, the entire<br />
Colorado was running through the cut into Imperial Canal, and through<br />
Imperial Valley into Salton Sink. Throughout 1906 strenuous efforts to<br />
turn the river permanently back into its old channel toward the Gulf <strong>of</strong><br />
<strong>California</strong> were unsuccessful. Although the river had been confined to<br />
its old channel on November 4,1906, following completion <strong>of</strong> Hind Dam,<br />
a second break occurred on December 7th. On December 20th, at the<br />
request <strong>of</strong> President Theodore Roosevelt, the Southern Pacific Company<br />
started on a second closure. This was finally accomplished on February<br />
19, 1907, with completion <strong>of</strong> Clarke Dam, which permanently re-established<br />
the river in its previous channel. Estimated cost <strong>of</strong> twice turning<br />
back the river exceeded $2,000,000, and widespread damage, estimated<br />
to be more than $8,000,000, was caused by flooding. Of recent years, more<br />
than 40 years after the closure, the United <strong>State</strong>s paid the Southern<br />
Pacific Company over $1,000,000 as compensation for its expenditures<br />
in closing the break. Among principal flood losses were virtual destruction<br />
<strong>of</strong> 13,000 acres <strong>of</strong> agricultural land <strong>of</strong> which 3,000 acres was under<br />
cultivation at the time, extensive damage to the main line <strong>of</strong> the Southern<br />
Pacific Company, scouring <strong>of</strong> the channels <strong>of</strong> New and Alamo Rivers,<br />
and extensive destruction to portions <strong>of</strong> the town <strong>of</strong> Mexicali.
APPENDIX A<br />
RECLAMATION OF SEWAGE AND<br />
WASTE WATERS
APPENDIX B<br />
ALPHABETICAL LIST OF PRECIPITATION<br />
STATIONS IN CALIFORNIA
Table<br />
TABLE OF CONTENTS<br />
Page<br />
1. Alphabptieal List <strong>of</strong> Prp('ipitation Stations in <strong>California</strong> With<br />
Rp('ords <strong>of</strong> 10 Ypars or Long-t'r 561<br />
.) .\Iphabetit'al List <strong>of</strong> Prpl'ipitation Stations ill ('alifornia \\'ith<br />
RPI'(I)'d,; <strong>of</strong> Less Than 10 Ypars ______ ___ 580
APPENDIX C<br />
DESCRIPTION OF DRAINAGE BASINS
APPENDIX D<br />
GROUND-WATER STORAGE CAPACITY OF THE<br />
SACRAMENTO VALLEY, CALIFORNIA<br />
21.....27922<br />
. SUMMARY STATEMENT<br />
By J. f. Poland, G. H. Davis, f. H. Olmsted, and fred Kunkel<br />
GROU,",D WATER BRANCH<br />
WATER RESOURCES DIVISION<br />
UNITED STATES GEOLOGICAL SURVEY<br />
November, 1949
GROUND-WATER STORAGE CAPACITY OF THE<br />
SACRAMENTO VALLEY, CALIFORNIA<br />
By J. F. POLAND, G. H. DAVIS, F. H. OLMSTED and FRED KUNKEL<br />
Purpose and scope <strong>of</strong> the investigation<br />
In March, 1948, a cooperative agreement was made by the Geological<br />
Survey, United <strong>State</strong>s <strong>Department</strong> <strong>of</strong> the Interior, and the Division <strong>of</strong><br />
<strong>Water</strong> <strong>Resources</strong>, <strong>Department</strong> <strong>of</strong> Public Works, <strong>State</strong> <strong>of</strong> <strong>California</strong>,<br />
providing for an investigation <strong>of</strong>geologic features <strong>of</strong> ground-water basins<br />
in <strong>California</strong>.<br />
At the request <strong>of</strong> the Division <strong>of</strong> <strong>Water</strong> <strong>Resources</strong>, the first activity<br />
<strong>of</strong> the Geological Survey has been to make an estimate <strong>of</strong> the total groundwater<br />
storage capacity <strong>of</strong> the near-surface water-bearing deposits in the<br />
Sacramento VaHey. This valley has a surplus water supply-that is,<br />
there is more surface and ground water jointly available than is now used<br />
or than will be used in the valley in the future. The <strong>State</strong> desires to<br />
know the order <strong>of</strong> magnitude <strong>of</strong> the ground-water storage volume to<br />
assist in estimating the magnitude <strong>of</strong> the surplus.<br />
The investigation summarized here relates to· total ground-water<br />
storage capacity to a depth <strong>of</strong> 200 feet below the land surface. No attempt<br />
has been made to estimate usable storage capacity 1 because such an<br />
estimate would require detailed investigation <strong>of</strong> geologic and groundwater<br />
conditions far beyond the scope <strong>of</strong> and funds available for the<br />
present study. However, the work accomplished to date is a necessary<br />
first step in an estimate <strong>of</strong> usable storage capacity. Accordingly, there<br />
would be no duplication <strong>of</strong> effort if the more refined estimate <strong>of</strong> usable<br />
storage capacity should be undertaken at a later date.<br />
The area included in the estimate <strong>of</strong> storage capacity is shown on<br />
Plate 1. It extends southward from Red Bluff beyond Sacramento, terminating<br />
at the Cosumnes River on the southeast, apd at the northern edge<br />
<strong>of</strong> the Sacramento-San Joaquin Delta on the south.<br />
In addition to the estimate <strong>of</strong> underground storage capacity, the<br />
full report now in preparation will include a section on geology, describing<br />
the water-bearing deposits <strong>of</strong> the valley with respect to physical and<br />
hydrologic character, thickness, distribution, and structural features.<br />
The investigation is being made under the general direction <strong>of</strong> A. N.<br />
Sayre, geologist in charge <strong>of</strong> the Ground <strong>Water</strong> Branch, and under the<br />
immediate direction <strong>of</strong> J. F. Poland, District Geologist for <strong>California</strong>.<br />
The field work and interpretation have been carried on almost wholly by<br />
George H. Davis, Fred Kunkel, and Franklin H. Olmsted.<br />
1 Usable storage capacity is that reservoir capacity that can be shown to be economically<br />
capable <strong>of</strong> being dewatered during periods <strong>of</strong> deficient surface supply and<br />
capable <strong>of</strong> being resaturated, either naturally or artificially, during periods <strong>of</strong> excess<br />
surface supply. Obviously it must contain usable water, which may be defined as that<br />
having a satisfactory quality for irrigation and occurring in sufflcient quantity in the<br />
underground reservoir to be available without uneconomic-yield or drawdown.<br />
( 621 )
WATER RESOURCES OF CALIFORNIA 623<br />
records assembled are recent data collected from well drillers by the<br />
Geological Survey and cooperating agencies, but some material was<br />
obtained from publications <strong>of</strong> the Geological Survey, the Oalifornia<br />
Division <strong>of</strong> <strong>Water</strong> <strong>Resources</strong>, and the Oalifornia Division <strong>of</strong> Mines. Of<br />
the 6,000 well logs assembled by the Geological Survey, about 3,600 were<br />
collected by the survey, 2,000 by the Bureau <strong>of</strong> Reclamation, and 400<br />
by the Oalifornia Division <strong>of</strong> <strong>Water</strong> <strong>Resources</strong>. About 4,800 <strong>of</strong> these logs<br />
were located in the field: 3,200 by the Geological Survey, 900 by the<br />
Bureau <strong>of</strong> Reclamation, and 700 by the Oalifornia Division <strong>of</strong> <strong>Water</strong><br />
<strong>Resources</strong> in connection with their investigation in the Sutter-Yuba area.<br />
In the drillers' logs, gravel, sand, clay, and volcanic rocks are usually<br />
distinguished, and the more complete logs mention the color, coarseness,<br />
hardness, degree <strong>of</strong> cementation, and other easily identifiable characteristics<br />
<strong>of</strong> the sediments. In interpreting these logs, it must be remembered<br />
that different drillers attach different meanings to the various terms used<br />
for identifying sediments. •<br />
Peg Model<br />
A peg model <strong>of</strong> the Sacramento Valley, based on drillers' logs, was<br />
constructed to help in recognition <strong>of</strong> hydrologic units and geologic features.<br />
Each well log was represented by a wooden peg a quarter <strong>of</strong> an<br />
inch in diameter, mounted on a base map <strong>of</strong> the valley. A vertical scale<br />
<strong>of</strong> 50 feet to the inch and a horizontal scale <strong>of</strong> 4,000 feet to the inch were<br />
used on the model. Eight major lithologic types were recognized, and<br />
each was distinguished py a different color on the pegs. Three datum<br />
planes, the land-surface altitude as interpolated from topographic sheets,<br />
sea level, and 1,000 feet below sea level, were marked on each peg. Each<br />
peg in its respective location was set in a hole bored in a wooden table so<br />
that the top <strong>of</strong> the table represented 1,000 feet below sea level.<br />
At the scale used for the base map (4,000 feet to the inch) it was<br />
neither practical nor efficient to attempt to utilize all the well logs. Therefore,<br />
in places where wells were closely spaced, it was decided to select<br />
the deeper logs and not to make pegs for logs <strong>of</strong> wells closer to each other<br />
than about 1,500 feet. With this selection, about 3,000 well logs were<br />
utilized in the model. These same logs were used for the estimates <strong>of</strong><br />
specific yield and storage capacity described beyond.<br />
To estimate the storage capacity <strong>of</strong> the valley, it was necessary to<br />
subdivide the near-surface sediments into hydrologic units. The peg model<br />
has been <strong>of</strong> great value in making this subdivision. In addition, much<br />
was learned from the peg model about such geologic information as continuity<br />
<strong>of</strong> sand and gravel strata, depth to bedrock, and the extent and<br />
position <strong>of</strong> volcanic flows and <strong>of</strong> buried gravels <strong>of</strong> ancient stream courses.<br />
Selection <strong>of</strong> Depth Zones<br />
At the request <strong>of</strong> the <strong>California</strong> Division <strong>of</strong> <strong>Water</strong> <strong>Resources</strong>, the<br />
storage capacity <strong>of</strong> the water-bearing deposits <strong>of</strong> the Sacramento Valley<br />
has been estimated for three depth zones: 20 to 50 feet, 50 to 100 feet, and<br />
100 to 200 feet below the land surface. The only exception to this threezone<br />
treatment was for the area south <strong>of</strong> Marysville between the floodplain<br />
deposits <strong>of</strong> the Sacramento River on the west and the channel <strong>of</strong><br />
the 'Feather River on the east. The Oalifornia Division <strong>of</strong> <strong>Water</strong> Reilources<br />
reports that water <strong>of</strong> poor quality exists there at relatively shallow depths<br />
and that it is not generally practicable to draw down the water level to
APPENDIX E<br />
COLORADO RIVER
APPENDIX E<br />
COLORADO RIVER<br />
Diversions were first made from Colorado River for the irrigation <strong>of</strong><br />
lands in <strong>California</strong> in the 1870s. Over the years this irrigation has increased<br />
tremendously, so that the agricultural economy within <strong>California</strong><br />
dependent upon Colorado River is now <strong>of</strong> significant importance to the<br />
<strong>State</strong> and to the Nation. Furthermore, since completion <strong>of</strong> the Colorado<br />
River Aqueduct by the Metropolitan <strong>Water</strong> District <strong>of</strong> Southern <strong>California</strong><br />
in 1940, a present population <strong>of</strong> more than 4,000,000 in the SoutIl<br />
Coastal Area <strong>of</strong> <strong>California</strong> is dependent upon Colorado River as a source<br />
<strong>of</strong> supplemental water for domestic, industrial, and municipal purposes.<br />
Increasing diversions from Colorado River for irrigation <strong>of</strong> lands in<br />
Oalifornia, together with other diversions for upstream irrigation, were<br />
so great by the early 1920s as to cause deficiencies in supply during dry<br />
years. The urgent need for regulation <strong>of</strong> the river, both for augmentation<br />
<strong>of</strong> the supply during dry years and for control <strong>of</strong> floods, was apparent.<br />
However, preliminary to construction <strong>of</strong> works for river regulation it<br />
was essential that an understanding be reached as to division <strong>of</strong> the waters<br />
between the interests <strong>of</strong> the seven states into which Colorado River extends.<br />
The Colorado River-Compact, sig'ned in 1922 by commissioners representing<br />
the <strong>State</strong>s <strong>of</strong> Arizona, <strong>California</strong>, Colorado, Nevada, New Mexico,<br />
Utah, and Wyoming, and the United <strong>State</strong>s, apportioned the waters <strong>of</strong> the<br />
Colorado River System between the Upper and I-lower Basins <strong>of</strong> the river.<br />
As defined in the compact, the dividing point between the Upper and<br />
Lower Basins is Lee Ferry, a point on the main stream <strong>of</strong> Colorado River<br />
one mile below the mouth <strong>of</strong> Paria River in northern Arizona. In 1923<br />
the legislatures <strong>of</strong> all Colorado River Basin states, except Arizona,ratified<br />
the compact. The <strong>State</strong> <strong>of</strong> Arizona did not ratify the compact until 1944,<br />
when its legislature gave its approval.<br />
Initial legislative efforts in connection with further development on<br />
Colorado River were the so-called Kettner Bills, seeking authorization for<br />
construction <strong>of</strong> the All-American Canal, which were introduced in 1919<br />
and 1920, but failed to come to vote. The first <strong>of</strong> several bills providing<br />
for authorization <strong>of</strong> the Boulder Canyon Project was introduced in 1922<br />
by Congressman Phil D. Swing and Senator Hiram W. Johnson, and<br />
became known as the first Swing-Johnson Bill. The Boulder Canyon<br />
Project Act, as finally passed by the Congress in 1928, provided for construction,<br />
operation, and maintenance <strong>of</strong> a storage dam and power plant<br />
at Black Canyon or Boulder Canyon on the main stream <strong>of</strong> Colorado<br />
River, and construction <strong>of</strong> the All-American Canal to divert water from<br />
the river and convey it to Imperial and Coachella Valleys by a conduit<br />
within the United <strong>State</strong>s. The Secretary <strong>of</strong> the Interior was authorized<br />
to contract for the sale <strong>of</strong> water and power that would assure repaying<br />
the entire cost <strong>of</strong> the dam and power plant, with interest, together with<br />
operation and maintenance expenses, and repayment without interest <strong>of</strong><br />
the cost <strong>of</strong> the All-American Canal under provisions <strong>of</strong> the Reclamation<br />
( 635 )
WATER RESOURCES OF CALIFORXIA 645<br />
acre-feet guaranteed by the treaty. This quantity, which may be made<br />
up <strong>of</strong> any waters <strong>of</strong> the Colorado from any and all sources, whether<br />
direct river flow, return flow, or seepage, will be delivered by the United<br />
<strong>State</strong>s in the boundary portion <strong>of</strong> the river, except that until 1980<br />
Mexico may receive 500,000 acre-feet annually, and after that year<br />
375,000 ·acre-feet annually, through the All-American Canal as part <strong>of</strong><br />
the guaranteed quantity. Davis Dam has been built by the United <strong>State</strong>s<br />
to provide regulation <strong>of</strong> flow required to meet commitments <strong>of</strong> the Mexican<br />
treaty. The treaty provides that Mexico shall construct, at its expense,<br />
a main diversion structure below the point where the northernmost part<br />
<strong>of</strong> the international land boundary line intersects Colorado River. In<br />
complying with this provision, the Mexican Government has constructed<br />
Morelos Dam on Colorado River about five miles southwest <strong>of</strong> Yuma.<br />
Since February, 1942, all water delivered to the Alamo Canal through<br />
the Pilot K.nob Wasteway <strong>of</strong> the All-American Canal, plus water diverted<br />
from the Colorado into the Alamo Canal, has been used in Mexico.<br />
For the major part <strong>of</strong> its length between Hoover Dam and Havasu<br />
Lake created by Parker Dam, the Colorado flows in well confined canyon<br />
sections where there is little opportunity for meandering. There is, however,<br />
an exception to this general topography immediately upstream from<br />
Topock, where the river flows through an alluvial valley about 33 miles<br />
long and from two to five miles wide. In years past the river has meandered<br />
through this valley, with general aggradation <strong>of</strong> the valley floor.<br />
.As a result, the river now spreads over almost the full width <strong>of</strong> the lower<br />
half <strong>of</strong> this valley, forming a swamp through which water flows in a<br />
number <strong>of</strong> small channels, with resulting heavy water losses. The United<br />
<strong>State</strong>s Bureau <strong>of</strong> Reclamation has a channel rectification project under<br />
construction in this reach.<br />
Natural Flow <strong>of</strong> Colorado River Above Gila River<br />
Katural flow <strong>of</strong> Colorado River above Gila River was determined<br />
by deducting recorded flow <strong>of</strong> Gila River at Dome from that <strong>of</strong> Colorado<br />
River at Yuma, and correcting the resulting record for effects <strong>of</strong> upstream<br />
regulation, diversion, and irrigation consumptive uses on the main Colorado<br />
River and upstream tributaries. Records <strong>of</strong> flow <strong>of</strong> Colorado River<br />
at Yuma and <strong>of</strong> Gila River at Dome are available for the entire period<br />
from 1904-05 to 1947-48 used in the current study.<br />
Regulation, diversions, and irrigation consumptive uses in the Upper<br />
Basin <strong>of</strong> the Colorado were estimated as set forth in the discussion <strong>of</strong> the<br />
natural flow at Lee Ferry. Similarly, impairments to natural flow <strong>of</strong> the<br />
river in the Lower Basin were estimated by reaches above and below<br />
Hoover Dam.<br />
Irrigation diversions above Hoover Dam include those from the Virgin<br />
and Little Colorado Rivers, and Kanab Creek. Available records from<br />
the Bureau <strong>of</strong> Censns were used to estimate annual irrigated acreage<br />
segregated by stream systems. These acreages were then multiplied by<br />
estimated unit values <strong>of</strong> seasonal consumptive use, which were computed<br />
separately for each stream system.<br />
Diversions from the Colorado below Hoover Dam are mainly for<br />
irrigation. Records are available covering practically the entire period<br />
during which these diversions have been made. Consumptive use was<br />
estimated for the few periods or diversions for which no records were