PeRfoRMance hIghlIghts, FINANCIAL Revenue, DKK billion 70 60 50 40 30 20 10 0 2007 2008 2009 2010 <strong>2011</strong> Profit, DKK billion 14 12 10 8 6 4 2 0 DKK million Eur million <strong>2011</strong> 2010 2009 2008 2007 <strong>2011</strong> 2010 BusinEss pErfOrmanCE statement of comprehensive income Revenue: 56,842 54,616 49,569 60,642 41,342 7,630 7,333 Exploration & Production 10,469 8,264 6,416 7,322 4,486 1,405 1,109 Wind Power 4,312 2,952 1,676 1,453 1,201 579 397 Thermal Power 10,665 11,731 10,855 13,800 11,130 1,431 1,575 <strong>Energy</strong> Markets 33,689 31,516 28,889 37,357 20,263 4,522 4,232 Sales & Distribution 13,009 14,185 13,386 15,595 14,551 1,746 1,905 Other activities/eliminations (15,302) (14,032) (11,653) (14,885) (10,289) (2,053) (1,884) EBITDA: 13,770 14,135 9,311 13,428 9,323 1,848 1,898 Exploration & Production 5,684 5,051 3,264 4,261 2,366 763 678 Wind Power 1,799 1,730 609 677 605 241 233 Thermal Power 2,255 2,228 388 2,388 3,096 303 299 <strong>Energy</strong> Markets 1,963 2,959 2,735 4,352 1,583 263 398 Sales & Distribution 2,027 2,036 2,239 1,827 1,961 272 273 Other activities/eliminations 42 131 76 (77) (288) 6 18 EBITDA adjusted for special hydrocarbon tax 12,254 13,118 8,842 12,681 9,301 1,644 1,761 EBIT 6,100 8,120 4,228 7,809 4,500 818 1,090 Adjusted operating profi t 4,444 6,985 3,658 6,842 4,314 596 938 Profi t for the year 2,882 4,499 1,492 4,669 3,046 386 604 Key ratios Financial gearing x 0.41 0.43 0.60 0.33 0.35 0.41 0.43 Adjusted net debt / EBITDA Adjusted net debt / Cash fl ows from x 1.9 1.9 3.3 1.4 2.0 1.9 1.9 operating activities x 2.0 1.8 3.3 1.9 2.1 2.0 1.8 Return on capital employed (ROCE) % 5.7 9.6 5.5 11.6 7.4 5.7 9.6 Adjusted return on capital employed % 9.2 15.1 7.7 16.1 10.1 9.2 15.1 ifrs statement of comprehensive income Revenue1 : 58,437 54,598 49,262 60,777 41,625 7,845 7,331 Exploration & Production 9,931 8,224 6,579 7,114 4,409 1,333 1,104 Wind Power 4,520 2,947 1,676 1,453 1,201 607 396 Thermal Power 10,231 11,330 10,818 13,890 11,198 1,373 1,521 <strong>Energy</strong> Markets 36,211 31,764 28,201 38,087 20,262 4,861 4,265 Sales & Distribution 13,178 14,185 13,386 15,595 14,552 1,769 1,905 Other activities/eliminations (15,634) (13,852) (11,398) (15,362) (9,996) (2,098) (1,860) 4 manaGEmEnt’s rEviEw – <strong>DONG</strong> ENERGY GROUP <strong>ANNUAL</strong> <strong>ANNUAL</strong> <strong>REPORT</strong> <strong>REPORT</strong> <strong>2011</strong> <strong>2011</strong> Profit after tax EBITDA Likvider Bindende lånefaciliteter 2007 2008 2009 2010 <strong>2011</strong> EBITDA Resultat efter s
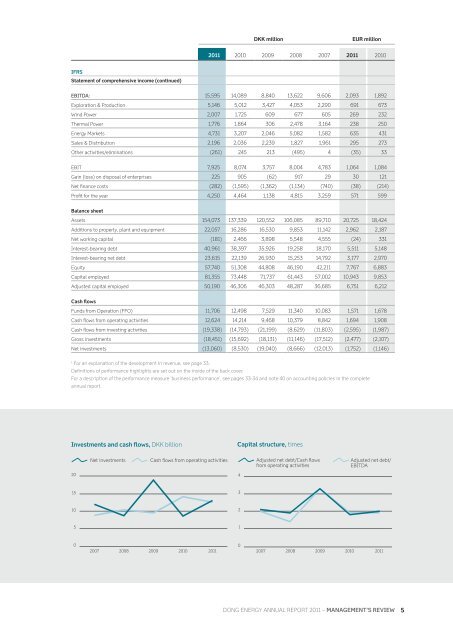
ifrs statement of comprehensive income (continued) Investments and cash flows, DKK billion 20 15 10 5 0 Net investments Cash flows from operating activities 2007 2008 2009 2010 <strong>2011</strong> Capital structure, times 4 3 2 1 0 DKK million Eur million <strong>2011</strong> 2010 2009 2008 2007 <strong>2011</strong> 2010 EBITDA: 15,595 14,089 8,840 13,622 9,606 2,093 1,892 Exploration & Production 5,146 5,012 3,427 4,053 2,290 691 673 Wind Power 2,007 1,725 609 677 605 269 232 Thermal Power 1,776 1,864 306 2,478 3,164 238 250 <strong>Energy</strong> Markets 4,731 3,207 2,046 5,082 1,582 635 431 Sales & Distribution 2,196 2,036 2,239 1,827 1,961 295 273 Other activities/eliminations (261) 245 213 (495) 4 (35) 33 EBIT 7,925 8,074 3,757 8,004 4,783 1,064 1,084 Gain (loss) on disposal of enterprises 225 905 (62) 917 29 30 121 Net fi nance costs (282) (1,595) (1,362) (1,134) (740) (38) (214) Profi t for the year 4,250 4,464 1,138 4,815 3,259 571 599 Balance sheet Assets 154,073 137,339 120,552 106,085 89,710 20,725 18,424 Additions to property, plant and equipment 22,057 16,286 16,530 9,853 11,142 2,962 2,187 Net working capital (181) 2,466 3,898 5,548 4,555 (24) 331 Interest-bearing debt 40,961 38,397 35,926 19,258 18,170 5,511 5,148 Interest-bearing net debt 23,615 22,139 26,930 15,253 14,792 3,177 2,970 Equity 57,740 51,308 44,808 46,190 42,211 7,767 6,883 Capital employed 81,355 73,448 71,737 61,443 57,002 10,943 9,853 Adjusted capital employed 50,190 46,306 46,303 48,287 36,685 6,751 6,212 Cash fl ows Funds from Operation (FFO) 11,706 12,498 7,529 11,340 10,083 1,571 1,678 Cash fl ows from operating activities 12,624 14,214 9,468 10,379 8,842 1,694 1,908 Cash fl ows from investing activities (19,338) (14,793) (21,199) (8,629) (11,803) (2,595) (1,987) Gross investments (18,451) (15,692) (18,131) (11,146) (17,512) (2,477) (2,107) Net investments (13,060) (8,530) (19,040) (8,666) (12,013) (1,752) (1,146) 1 For an explanation of the development in revenue, see page 33. Defi nitions of performance highlights are set out on the inside of the back cover. For a description of the performance measure ’business performance’, see pages 33-34 and note 40 on accounting policies in the complete annual report. Adjusted net debt/Cash flows from operating activities Pengestrømme fra driftsaktivitet Nettoinvesteringer 2007 2008 2009 Adjusted net debt/ EBITDA <strong>DONG</strong> ENERGY <strong>DONG</strong> ENERGY GROUP <strong>ANNUAL</strong> <strong>REPORT</strong> <strong>2011</strong> – manaGEmEnt’s rEviEw 5 2010 <strong>2011</strong> Justeret n Justeret n
- Page 1 and 2: MOVING ENERGY FORWARD ANNUAL REPORT
- Page 3 and 4: More reliable and clean energy DONG
- Page 5 and 6: More reliable and clean energy Mode
- Page 7: Q3 17 August signing of Eur 1.3 bil
- Page 11 and 12: un Global Compact principle Climate
- Page 13 and 14: Spearheading the development of the
- Page 15 and 16: Waste is a valuable resource It is
- Page 17 and 18: DONG Energy involves local operator
- Page 19 and 20: The ambitious business strategy mea
- Page 21 and 22: DONG Energy contributes to green gr
- Page 23 and 24: The photo shows the Siri platform i
- Page 25 and 26: The photo shows the construction of
- Page 27 and 28: The photo shows one of the Group’
- Page 29 and 30: Strong market insight from experien
- Page 31 and 32: The photo shows a meter technician
- Page 33 and 34: monthly average 2011 2010 ∆ Oil,
- Page 35 and 36: Net finance costs amounted to DKK 0
- Page 37 and 38: New presentation of profit for the
- Page 39 and 40: Non-financial performance The Group
- Page 41 and 42: volumes Generation from wind and hy
- Page 43 and 44: was brought back online in October
- Page 45 and 46: Further information on DONG Energy
- Page 47 and 48: DONG Energy has a diversified loan
- Page 49 and 50: Market and credit risks The Group
- Page 51 and 52: isk and risk policy Exposure and he
- Page 53 and 54: isk and risk policy Exposure and he
- Page 55 and 56: Environment As an energy company, D
- Page 57 and 58: Under Danish legislation, the Group
- Page 59 and 60:
information and communication DONG
- Page 61 and 62:
lars nØrBy JOHansEn Deputy Chairma
- Page 63 and 64:
pOul arnE niElsEn b. 1944. Joined t
- Page 65 and 66:
The Board of Directors and the Exec
- Page 67 and 68:
notes to the statement of cash flow
- Page 69 and 70:
DKK million Note Business perfor ma
- Page 71 and 72:
Equity and liabilities DKK million
- Page 73 and 74:
DKK million Share capital Hedging r
- Page 75 and 76:
DKK million Note 2011 2010 suppleme
- Page 77 and 78:
02 Critical accounting estimates an
- Page 79 and 80:
The excess of the cost of the acqui
- Page 81 and 82:
• wind power: Development, constr
- Page 83 and 84:
Geographical breakdown 2011 DKK mil
- Page 85 and 86:
econciliations DKK million 2011 201
- Page 87 and 88:
emuneration of Board of Directors,
- Page 89 and 90:
08 Fee to auditor appointed at the
- Page 91 and 92:
13 Income tax expense DKK million 2
- Page 93 and 94:
DKK million Goodwill Cost at 1 Janu
- Page 95 and 96:
The main criteria used for determin
- Page 97 and 98:
DKK million Land and Impairment tes
- Page 99 and 100:
17 Associates and other securities
- Page 101 and 102:
19 Receivables DKK million 2011 201
- Page 103 and 104:
20 Construction contracts DKK milli
- Page 105 and 106:
Hybrid capital due 3005 Hybrid capi
- Page 107 and 108:
Change in temporary differences in
- Page 109 and 110:
25 Loans and borrowings DKK million
- Page 111 and 112:
27 Income tax receivable and payabl
- Page 113 and 114:
29 Disposal of enterprises DKK mill
- Page 115 and 116:
Other capital transactions with non
- Page 117 and 118:
Risk Price change Effect on profi t
- Page 119 and 120:
Categories of fi nancial instrument
- Page 121 and 122:
securities 2011 DKK million Nominal
- Page 123 and 124:
trading portfolio, economic hedging
- Page 125 and 126:
Hedging of net investments in forei
- Page 127 and 128:
35 Lease commitments 2011 DKK milli
- Page 129 and 130:
As a condition for approval of its
- Page 131 and 132:
39 Events after the reporting perio
- Page 133 and 134:
Regulated companies that operate ac
- Page 135 and 136:
do not satisfy the criteria for hed
- Page 137 and 138:
translation reserve The translation
- Page 139 and 140:
eporting enterprise operates. Trans
- Page 141 and 142:
CO 2 emissions allowances Allocated
- Page 143 and 144:
Deferred tax is measured using the
- Page 145 and 146:
Definitions of performance highligh
- Page 147 and 148:
significant licences and hydrocarbo
- Page 149 and 150:
42 Company overview Segment/company
- Page 151 and 152:
Segment/company Type 1 Registered o
- Page 153 and 154:
Segment/company Type 1 Registered o
- Page 155 and 156:
DONG ENERGY ANNUAL REPORT 2011 - CO
- Page 157 and 158:
Accounting policies for data collec
- Page 159 and 160:
significant environmental incidents
- Page 161 and 162:
fInancIal stateMents 2011 PARENT CO
- Page 163 and 164:
DKK million Note 2011 2010 profit f
- Page 165 and 166:
Equity and liabilities DKK million
- Page 167 and 168:
DKK million Share capital Hedging r
- Page 169 and 170:
01 Basis of reporting The parent co
- Page 171 and 172:
04 Staff costs DKK million 2011 201
- Page 173 and 174:
06 Finance income DKK million 2011
- Page 175 and 176:
09 Property, plant and equipment DK
- Page 177 and 178:
12 Equity Share capital composition
- Page 179 and 180:
14 Loans and borrowings DKK million
- Page 181 and 182:
18 Financial risks DONG Energy A/S
- Page 183 and 184:
19 Financial instruments maturity a
- Page 185 and 186:
fair value hierarchy of financial i
- Page 187 and 188:
22 Related party transactions tradi
- Page 189 and 190:
Independent Auditor’s Report To t
- Page 191 and 192:
coMPany announceMents IN 2011 Compa
- Page 193 and 194:
glossaRy relatively low (off-peak).