ANNUAL REPORT 2011 - DONG Energy
ANNUAL REPORT 2011 - DONG Energy
ANNUAL REPORT 2011 - DONG Energy

Create successful ePaper yourself
Turn your PDF publications into a flip-book with our unique Google optimized e-Paper software.
Market and credit risks<br />
The Group’s net exposure to market risks is illustrated below.<br />
In the long term, the Group’s market risks are determined<br />
by its strategic choices and associated asset mix.<br />
<strong>DONG</strong> <strong>Energy</strong> mitigates its structural risks through, among<br />
other things, its technical and geographical diversification<br />
and the transition to greener electricity and heat generation,<br />
as described in the chapter Wind and biomass<br />
growth. Coupled with balancing of the oil and gas portfolio,<br />
this provides a diversified portfolio of assets with different<br />
risk profiles.<br />
To further reduce the fluctuations in the Group’s cash<br />
flows in the short and medium terms, price hedging contracts<br />
are entered into within the risk management time<br />
frame (up to five years). At the short end of the time frame,<br />
we want a high level of hedging to achieve a high degree of<br />
certainty with regard to cash flows, while the hedging level is<br />
lower in subsequent years. This approach is chosen partly<br />
because the underlying longer-term exposure is subject to<br />
greater uncertainty, and partly because the financial and<br />
physical markets are less liquid in the longer term.<br />
Overall, the diversification of the structural risk and management<br />
of the Group’s cash flows in the short and medium<br />
terms has a positive effect on <strong>DONG</strong> <strong>Energy</strong>’s capital structure<br />
target, as the fluctuations in earnings from the different<br />
activities are largely independent of each other and can therefore<br />
be assumed to balance each other out to some extent.<br />
Hedging strategy<br />
High<br />
Hedging percentage<br />
Low<br />
Commercial activities<br />
Purchase and production<br />
• Oil and gas production<br />
• Long-term wholesale<br />
gas contracts<br />
• Thermal electricity<br />
generation<br />
• Renewable generation<br />
Sale<br />
• Retail customers<br />
(gas and electricity)<br />
• Wholesale customers<br />
(gas and electricity)<br />
Up to 5 years<br />
Risk management principle<br />
Transfer of exposure<br />
Asset backed<br />
optimisation<br />
Time<br />
• Managing contract<br />
volumes and optimising<br />
contracts<br />
• Optimising physical<br />
and financial exposures<br />
<strong>DONG</strong> <strong>Energy</strong>’s principle for managing market risks is<br />
shown below. Where possible, all of the Group’s exposures<br />
from production and purchase and sales contracts within<br />
the management time frame are combined in the activity<br />
Asset-backed optimisation, where they are consolidated<br />
and optimised together. The consolidated exposure is then<br />
hedged via <strong>DONG</strong> <strong>Energy</strong>’s trading function (Market trading),<br />
which trades exposures in the market within given<br />
risk parameters.<br />
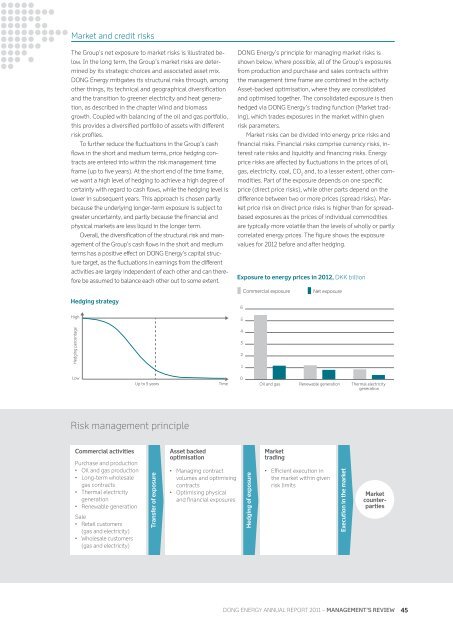
Market risks can be divided into energy price risks and<br />
financial risks. Financial risks comprise currency risks, interest<br />
rate risks and liquidity and financing risks. <strong>Energy</strong><br />
price risks are affected by fluctuations in the prices of oil,<br />
gas, electricity, coal, CO and, to a lesser extent, other com-<br />
2<br />
modities. Part of the exposure depends on one specific<br />
price (direct price risks), while other parts depend on the<br />
difference between two or more prices (spread risks). Market<br />
price risk on direct price risks is higher than for spreadbased<br />
exposures as the prices of individual commodities<br />
are typically more volatile than the levels of wholly or partly<br />
correlated energy prices. The figure shows the exposure<br />
values for 2012 before and after hedging.<br />
Exposure to energy prices in 2012, DKK billion<br />
6<br />
5<br />
4<br />
3<br />
2<br />
1<br />
0<br />
Commercial exposure Net exposure<br />
Hedging of exposure<br />
Oil and gas<br />
Market<br />
trading<br />
Renewable generation<br />
• Efficient execution in<br />
the market within given<br />
risk limits<br />
Execution in the market<br />
Thermal electricity<br />
generation<br />
Market<br />
counterparties<br />
<strong>DONG</strong> ENERGY <strong>DONG</strong> ENERGY GROUP <strong>ANNUAL</strong> <strong>REPORT</strong> <strong>2011</strong> – manaGEmEnt’s rEviEw 45<br />
Efter afdæ<br />
Før afdæk<br />
Husk kategorier i 3 dæk