ANNUAL REPORT 2011 - DONG Energy
ANNUAL REPORT 2011 - DONG Energy
ANNUAL REPORT 2011 - DONG Energy

You also want an ePaper? Increase the reach of your titles
YUMPU automatically turns print PDFs into web optimized ePapers that Google loves.
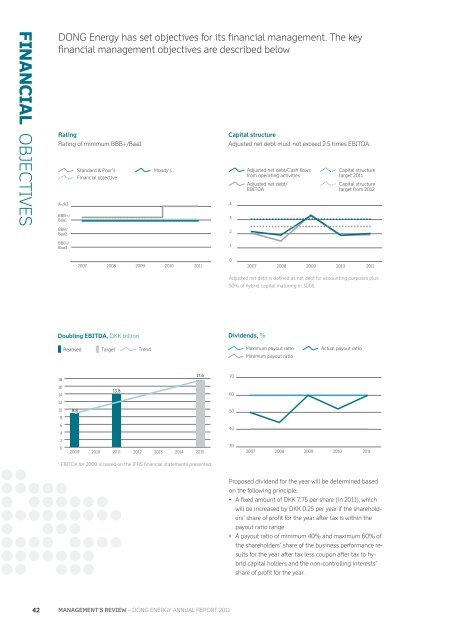
fInancIal OBJECTIVES<br />
<strong>DONG</strong> <strong>Energy</strong> has set objectives for its financial management. The key<br />
financial management objectives are described below<br />
rating<br />
Rating of minimum BBB+/Baa1<br />
A-/A3<br />
A-/A3 BBB+/<br />
Baa1<br />
BBB+/<br />
BBB/<br />
Baa1<br />
Baa2<br />
BBB/<br />
BBB-/<br />
Baa2<br />
Baa3<br />
BBB-/<br />
Baa3<br />
Standard & Poor's<br />
Financial objective<br />
Standard & Poor's<br />
Financial objective<br />
2007<br />
2008<br />
Doubling EBITDA, DKK billion<br />
2009<br />
Doubling Realised EBITDA, Target DKK billionTrend<br />
18<br />
16<br />
14<br />
12<br />
10<br />
8<br />
6<br />
4<br />
2<br />
0<br />
2009 2010 <strong>2011</strong> 2012<br />
1<br />
Realised Target Trend<br />
18<br />
16<br />
14<br />
12<br />
10<br />
8<br />
6<br />
4<br />
2<br />
8.8<br />
8.8<br />
13.8<br />
13.8<br />
0<br />
2009 1<br />
2007<br />
2010<br />
2008<br />
<strong>2011</strong><br />
2009<br />
2012<br />
Moody's<br />
Moody's<br />
2013<br />
2010<br />
2010<br />
2014<br />
<strong>2011</strong><br />
<strong>2011</strong><br />
17.6<br />
2015<br />
1 EBITDA for 2009 is based on the IFRS fi nancial statements presented.<br />
Capital structure<br />
Adjusted net debt must not exceed 2.5 times EBITDA.<br />
Capital structure<br />
4<br />
3<br />
2<br />
1<br />
0<br />
Dividends, %<br />
42<br />
manaGEmEnt’s rEviEw – <strong>DONG</strong> ENERGY GROUP <strong>ANNUAL</strong> <strong>ANNUAL</strong> <strong>REPORT</strong> <strong>REPORT</strong> <strong>2011</strong> <strong>2011</strong><br />
2013<br />
2014<br />
17.6<br />
2015<br />
70<br />
60<br />
50<br />
40<br />
30<br />
Adjusted net debt/Cash flows<br />
Capital structure<br />
from operating activities<br />
target <strong>2011</strong><br />
Adjusted net debt/ Finansiel målsætning Capital structure<br />
EBITDA<br />
target from 2012<br />
Finansiel Moody's målsætning<br />
Moody's Standard & Poor's<br />
Standard & Poor's<br />
2007<br />
Maximum payout ratio Actual payout ratio<br />
Minimum payout ratio<br />
EBITDA Likvider<br />
EBITDA Likvider Bindende lånefaciliteter<br />
Bindende lånefaciliteter<br />
2007<br />
2008<br />
2008<br />
2009<br />
2009<br />
2010<br />
2010<br />
<strong>2011</strong><br />
Adjusted net debt is defi ned as net debt for accounting purposes plus<br />
50% of hybrid capital maturing in 3005.<br />
<strong>2011</strong><br />
Proposed dividend for the year will be determined based<br />
on the following principle:<br />
• A fixed amount of DKK 7.75 per share (in <strong>2011</strong>), which<br />
will be increased by DKK 0.25 per year if the shareholders’<br />
share of profit for the year after tax is within the<br />
payout ratio range<br />
• A payout ratio of minimum 40% and maximum 60% of<br />
the shareholders’ share of the business performance results<br />
for the year after tax less coupon after tax to hybrid<br />
capital holders and the non-controlling interests’<br />
share of profit for the year.<br />
Kap<br />
Kap<br />
Jus<br />
Jus<br />
Maximum payo<br />
Minimum payo<br />
Actual payout-r