ANNUAL REPORT 2011 - DONG Energy
ANNUAL REPORT 2011 - DONG Energy
ANNUAL REPORT 2011 - DONG Energy

Create successful ePaper yourself
Turn your PDF publications into a flip-book with our unique Google optimized e-Paper software.
volumes<br />
Generation from wind and hydro was 11% ahead at 4.4<br />
TWh in <strong>2011</strong>. Generation from offshore wind farms increased<br />
due to the start-up of production at Walney 1, more<br />
turbines in operation at Gunfleet Sands and higher output<br />
from Horns Rev 2. Generation from onshore wind farms in<br />
Poland and Denmark also increased, while hydro output in<br />
Sweden was less than in 2010.<br />
Generation from wind and hydro represented 22% of<br />
the Group’s overall electricity generation in <strong>2011</strong> compared<br />
with 20% in 2010.<br />
financial performance<br />
Revenue was up DKK 1.4 billion at DKK 4.3 billion in <strong>2011</strong>.<br />
Around 2/3 of revenue came from government revenue<br />
schemes, the key elements of which were fixed tariffs (primarily<br />
Denmark) and guaranteed minimum prices for<br />
green certificates (primarily the UK). The rest of revenue in<br />
<strong>2011</strong> was sold at market prices, but as a large portion had<br />
been hedged at fixed prices, the development in the electricity<br />
price only had limited effect on revenue.<br />
EBITDA was DKK 0.1 billion ahead at DKK 1.8 billion in<br />
<strong>2011</strong>, driven by higher revenue, whereas higher costs due<br />
to the higher operating activity and building up of the<br />
business area had an adverse impact on EBITDA.<br />
EBIT amounted to DKK 0.9 billion and was marginally<br />
lower than in 2010, as the higher EBITDA was offset by<br />
higher depreciation on the new wind farms.<br />
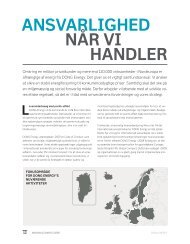
Revenue <strong>2011</strong><br />
18%<br />
47%<br />
56.8<br />
DKK billion<br />
14%<br />
6%<br />
15%<br />
Exploration & Production<br />
Wind Power<br />
Thermal Power<br />
<strong>Energy</strong> Markets<br />
Sales & Distribution<br />
Thermal Power<br />
performance highlights <strong>2011</strong> 2010<br />
Volumes<br />
Electricity generation,<br />
thermal TWh 12.6 15.3<br />
Heat generation PJ 42.6 53.2<br />
Financial performance<br />
Revenue DKK million 10,665 11,731<br />
EBITDA DKK million 2,255 2,228<br />
EBIT<br />
Adjusted operating<br />
DKK million 752 557<br />
profi t DKK million 720 511<br />
Gross investments DKK million (714) (3,853)<br />
Capital employed<br />
Capital employed DKK million 17,882 19,085<br />
PPE under construction DKK million<br />
Production assets<br />
transferred from PPE<br />
under construction in<br />
(214) (3,596)<br />
the past six months DKK million (3,883) (5,345)<br />
Adjusted capital<br />
employed DKK million 13,785 10,144<br />
Environment<br />
EU ETS CO2 emissions<br />
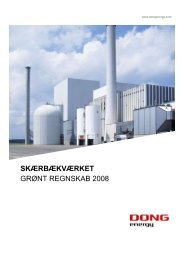
EBITDA <strong>2011</strong><br />
15%<br />
14%<br />
17%<br />
million<br />
tonnes 9.5 11.1<br />
volumes<br />
Both electricity and heat generation were lower in <strong>2011</strong><br />
than the previous year due to a milder winter. Electricity<br />
generation was thus 12.6 TWh, down 18% on 2010, while<br />
heat generation was down 20% at 42.6 PJ.<br />
13.8<br />
DKK billion<br />
41%<br />
13%<br />
Exploration & Production<br />
Wind Power<br />
Thermal Power<br />
<strong>Energy</strong> Markets<br />
Sales & Distribution<br />
<strong>DONG</strong> ENERGY <strong>DONG</strong> ENERGY GROUP <strong>ANNUAL</strong> <strong>REPORT</strong> <strong>2011</strong> – manaGEmEnt’s rEviEw 37