ANNUAL REPORT 2011 - DONG Energy
ANNUAL REPORT 2011 - DONG Energy
ANNUAL REPORT 2011 - DONG Energy

Create successful ePaper yourself
Turn your PDF publications into a flip-book with our unique Google optimized e-Paper software.
monthly average <strong>2011</strong> 2010 ∆<br />
Oil, Brent USD/bbl 111 80 40%<br />
Gas, TTF EUR/MWh 23 17 31%<br />
Gas, NBP EUR/MWh 22 17 31%<br />
Gas/oil spread EUR/MWh (3.2) (3.5) 9%<br />
Electricity,<br />
Nord Pool system EUR/MWh 47 53 (11%)<br />
Electricity, Nord<br />
Pool, DK avg. EUR/MWh 49 52 (6%)<br />
Electricity, EEx EUR/MWh 51 44 15%<br />
Green dark<br />
spread, DK 1 EUR/MWh 5 14 15%<br />
Source: Nord Pool, EEx, Platts, Argus and BAFA.<br />
1 Based on average prices in DK1 and DK2.<br />
was being sustained by the indirect effects of the earthquake<br />
in Japan, including the phasing out of nuclear<br />
power stations in Germany, and the interruption of gas<br />
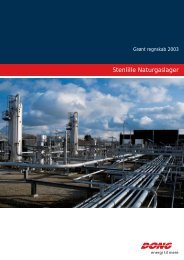
production in Libya. The European natural gas markets<br />
were generally well supplied in <strong>2011</strong>, which was part of the<br />
reason why gas hub prices remained significantly lower<br />
than the oil-indexed gas prices. This price spread had an<br />
adverse effect on earnings from gas trading. By contrast,<br />
the rising oil and gas prices had a positive effect on<br />
earnings from oil and gas production.<br />
Electricity prices and green dark spread<br />
The average electricity price in the two Danish price areas,<br />
DK1 and DK2, was EUR 49/MWh in <strong>2011</strong>, a decrease of 6%<br />
on 2010. The hydrological balance was low at the start of<br />
<strong>2011</strong>, and the year began with a cold, dry winter. It ended<br />
Gas, EUR/MWh<br />
26<br />
24<br />
22<br />
20<br />
18<br />
16<br />
14<br />
12<br />
10<br />
Source: Argus<br />
Gas (TTF) Gas (NBP)<br />
2010<br />
<strong>2011</strong><br />
with a high hydrological balance and a mild, wet autumn<br />
and winter. Consequently, electricity prices were relatively<br />
high at the start of the year, following which they dropped<br />
to a lower level.<br />
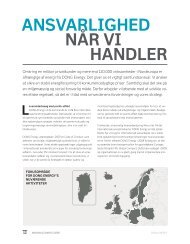
Due to the high hydrological balance of almost 10 TWh<br />
above the normal level, the Nord Pool electricity price was<br />
significantly lower than the German EEx electricity price<br />
from September, helping drive Danish electricity prices<br />
down. At the same time, higher electricity generation from<br />
wind farms in the North Sea put downward pressure on<br />
and led to higher fluctuations in the electricity price.<br />
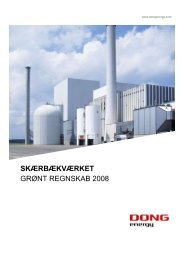
The green dark spread in Denmark showed a downward<br />
trend throughout <strong>2011</strong>, from approx. EUR 7/MWh at the<br />
start of the year to around EUR 0/MWh in autumn, after<br />
which it increased slightly again. The sharp decrease in the<br />
CO price from the middle of the year had a positive effect<br />
2<br />
on the spread at the end of <strong>2011</strong>. It averaged EUR 5/MWh,<br />
EUR 9/MWh less than in 2010.<br />
Hydrological balance, TWh<br />
20<br />
10<br />
0<br />
-10<br />
-20<br />
-30<br />
-40<br />
-50<br />
2010 <strong>2011</strong><br />
Range 2003-2010<br />
Q1<br />
Q2<br />
Source: SKM Market Predictor<br />
80<br />
70<br />
60<br />
50<br />
40<br />
30<br />
20<br />
10<br />
0<br />
-10<br />
GlOssary<br />
Reference is made to the glossary on<br />
pages 127-128 188-189 for definitions of terms.<br />
Gas (NBP)<br />
Gas (TTF)<br />
2010<br />
Median 2003-2010<br />
Electricity and green dark spread (GDS), EUR/MWh<br />
Electricity (Nord Pool, DK)<br />
Source: Nord Pool, Argus and ECX<br />
Q3<br />
<strong>2011</strong><br />
Q4<br />
GDS (Nord Pool, DK)<br />
<strong>DONG</strong> ENERGY <strong>DONG</strong> ENERGY GROUP <strong>ANNUAL</strong> <strong>REPORT</strong> <strong>2011</strong> – manaGEmEnt’s rEviEw 29<br />
2010<br />
<strong>2011</strong><br />
Median 2<br />
GDS (Nord P<br />
El (Nord Poo