ANNUAL REPORT 2011 - DONG Energy
ANNUAL REPORT 2011 - DONG Energy
ANNUAL REPORT 2011 - DONG Energy

You also want an ePaper? Increase the reach of your titles
YUMPU automatically turns print PDFs into web optimized ePapers that Google loves.
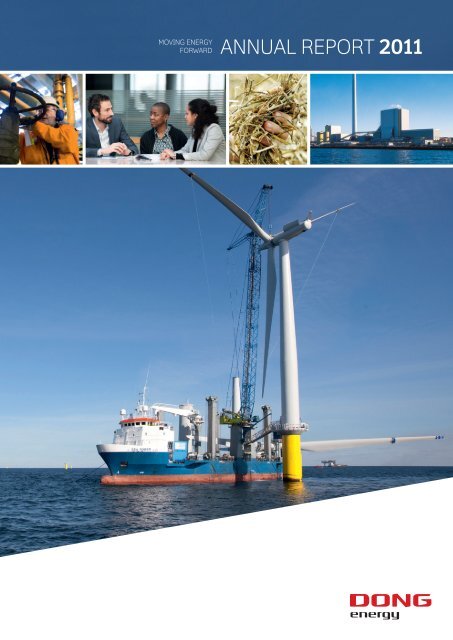
MOVING ENERGY<br />
FORWARD<br />
<strong>ANNUAL</strong> <strong>REPORT</strong> <strong>2011</strong>
at a glance Results <strong>2011</strong> MaRket shaRes<br />
One of the leading energy groups in Northern Europe<br />
<strong>DONG</strong> <strong>Energy</strong> is one of the leading energy<br />
groups in Northern Europe. We are headquartered<br />
in Denmark. Our business is based<br />
on procuring, producing, distributing and<br />
trading in energy and related products in<br />
Northern Europe. At the end of <strong>2011</strong>,<br />
<strong>DONG</strong> <strong>Energy</strong> employed 6,098 people.<br />
rEvEnuE<br />
DKK<br />
56.8BN<br />
CasH flOws frOm<br />
OpEratiOns DKK<br />
12.6BN<br />
Offshore wind in operation<br />
Denmark .......................................45%<br />
UK .....................................................21%<br />
Electricity generation<br />
Denmark .......................................54%<br />
Heat generation<br />
Denmark .......................................35%<br />
Electricty sales<br />
Denmark ......................................20%<br />
Netherlands .......................................1%<br />
EBitDa<br />
DKK<br />
13.8BN<br />
nEt invEstmEnts<br />
DKK<br />
13.1BN<br />
Gas sales<br />
Denmark ......................................29%<br />
Sweden ..........................................22%<br />
Netherlands .......................................1%<br />
Electricity distribution<br />
Denmark ......................................28%<br />
Gas distribution<br />
Denmark ......................................29%<br />
Owners at 31.12.<strong>2011</strong><br />
The Danish State 76.49%<br />
SEAS-NVE Holding 10.88%<br />
Syd Energi Net 6.95%<br />
Others 5.68%<br />
prOfit fOr<br />
tHE yEar DKK<br />
2.9BN<br />
ratinG<br />
a-/Baa1
More reliable and clean energy<br />
<strong>DONG</strong> <strong>Energy</strong> works concertedly to produce more energy and to reduce<br />
emissions of CO 2 . Production of oil and gas is being increased to meet<br />
the growing demand for energy. Many new wind turbines are also being<br />
brought on stream. And we plan to convert our Danish power stations to<br />
more green generation through increased use of biomass. The financial<br />
statements show that it is possible to meet both the challenges in the<br />
energy area and achieve satisfactory financial results.<br />
Doubling EBITDA, DKK billion<br />
18<br />
16<br />
14<br />
12<br />
10<br />
8<br />
6<br />
4<br />
2<br />
0<br />
Realised Target Trend<br />
8.8<br />
2009<br />
2010<br />
13.8<br />
<strong>2011</strong><br />
2012<br />
2013<br />
2014<br />
17.6<br />
2015<br />
<strong>DONG</strong> <strong>Energy</strong>’s strategic directions<br />
Wind and biomass growth<br />
Growth in the production<br />
and sourcing of oil and gas<br />
Halving CO 2 emissions, g CO 2 per kWh<br />
650<br />
EBITDA Likvider 613<br />
600<br />
590<br />
Bindende lånefaciliteter 574<br />
550<br />
500<br />
450<br />
400<br />
350<br />
300<br />
638<br />
2006<br />
Realised Target<br />
2008<br />
2010<br />
524<br />
486<br />
2012<br />
Robustness via the<br />
integrated business model<br />
Development of the flexible<br />
energy system of the future<br />
2014<br />
2016<br />
2018<br />
320<br />
2020<br />
why wheRe to how<br />
524<br />
Mål<br />
Realiseret
contents<br />
manaGEmEnt’s rEviEw<br />
1 Letter from the Chairman and the CEO<br />
2 Selected highlights in <strong>2011</strong><br />
4 Performance highlights, financial<br />
6 Performance highlights, non-financial<br />
6 CSR report<br />
8 Market conditions<br />
9 Business and strategy<br />
18 Business areas at a glance<br />
financial performance and outlook:<br />
28 Consolidated results<br />
36 Review of business areas’ performance<br />
40 Financial outlook for 2012<br />
42 Financial objectives<br />
43 <strong>DONG</strong> <strong>Energy</strong> and the capital market<br />
44 Risk and risk management<br />
management information:<br />
52 Corporate governance<br />
54 Internal control and risk management<br />
56 Board of Directors<br />
60 Executive Board<br />
COnsOliDatED finanCial statEmEnts<br />
64 Statement of comprehensive income<br />
66 Balance sheet<br />
68 Statement of changes in equity<br />
70 Statement of cash flows<br />
72 Notes to the consolidated financial statements<br />
COnsOliDatED nOn-finanCial<br />
statEmEnts<br />
152 Accounting policies for non-financial data<br />
parEnt COmpany finanCial<br />
statEmEnts<br />
158 Statement of comprehensive income<br />
160 Balance sheet<br />
162 Statement of changes in equity<br />
164 Statement of cash flows<br />
165 Notes to the financial statements<br />
manaGEmEnt statEmEnt,<br />
inDEpEnDEnt auDitOr’s rEpOrt anD<br />
assuranCE statEmEnt<br />
61 Statement by the Executive Board and the Board<br />
of Directors<br />
185 Independent auditor’s report, financial<br />
statements<br />
186 Assurance statement, non-financial statements<br />
aDDitiOnal infOrmatiOn<br />
187 Company announcements published in <strong>2011</strong><br />
188 Glossary<br />
Inside front cover <strong>DONG</strong> <strong>Energy</strong> at a glance<br />
furtHEr infOrmatiOn<br />
Media Relations<br />
Karsten Anker Petersen<br />
+45 99 55 96 62<br />
Investor Relations<br />
Morten Hultberg Buchgreitz<br />
+45 99 55 97 50<br />
www.dongenergy.com<br />
Front and back cover photo<br />
Establishment of the Horns Rev 2 offshore wind farm<br />
Language<br />
The report has been prepared in Danish and<br />
in English. In the event of any discrepancies between<br />
the Danish and the English reports, the<br />
Danish version shall prevail.<br />
Design: Bysted/<strong>DONG</strong> <strong>Energy</strong>
More reliable and clean energy<br />
Modern society is using more and more energy. At the<br />
same time, we want to slow down the impact on the environment<br />
to which traditional energy production contributes.<br />
This is the dual challenge that we are facing.<br />
<strong>DONG</strong> <strong>Energy</strong> sees it as its task to work concertedly on<br />
both fronts. On a sound business basis, of course.<br />
We are producing more energy by increasing our production<br />
of oil and gas, which will remain necessary sources<br />
of energy for many years to come. At the same time, <strong>DONG</strong><br />
<strong>Energy</strong> is a world leader in wind energy, and we are currently<br />
bringing row after row of new offshore wind turbines<br />
on stream.<br />
At the same time, we are planning to convert our Danish<br />
power stations to more green generation. Consumption of<br />
coal is being reduced markedly while consumption of various<br />
forms of biofuel will be increased. Pollution with CO2 and other harmful substances is being reduced, and we are<br />
thus producing the necessary energy more responsibly.<br />
The aim is to deliver reliable and clean energy that meets<br />
the requirements of modern society. The ability to achieve<br />
satisfactory financial results at the same time is reflected<br />
in <strong>DONG</strong> <strong>Energy</strong>’s financial statements. We are thus well<br />
on the way towards our business target to double operating<br />
income in 2015 compared with 2009.<br />
In the context of the global challenge, <strong>DONG</strong> <strong>Energy</strong>’s<br />
initiatives may seem modest. But every effort counts.<br />
And our rapid transition is equipping us well for the future<br />
while also demonstrating that it is possible to deliver more<br />
energy and more green energy on a sound commercial<br />
basis.<br />
9 March 2012<br />
fritz H. schur anders Eldrup<br />
Chairman of the Board of Directors CEO<br />
<strong>DONG</strong> ENERGY <strong>DONG</strong> ENERGY GROUP <strong>ANNUAL</strong> <strong>REPORT</strong> <strong>2011</strong> – manaGEmEnt’s rEviEw 1
selected HIGHLIGHTS IN <strong>2011</strong><br />
2<br />
Q1 Q2<br />
13 January<br />
new hybrid capital bonds issued<br />
<strong>DONG</strong> <strong>Energy</strong> has successfully issued new hybrid capital<br />
with a coupon rate of 7.75% for EUR 700 million due in<br />
3010 and repurchased EUR 500 million of the existing<br />
hybrid capital due in 3005. The capital base was strengthened<br />
by DKK 1.3 billion.<br />
24 February<br />
Construction of the offshore wind farm<br />
Borkum riffgrund 1<br />
Decision to build the offshore wind farm Borkum Riffgrund<br />
1 in the German sector of the North Sea. The total investment<br />
will be approximately EUR 1.25 billion. The farm will<br />
have a total capacity of 320 MW and will supply power<br />
from 2014.<br />
28 March<br />
pensionDanmark and pKa to become co-owners of<br />
anholt offshore wind farm<br />
A consortium consisting of PensionDanmark and PKA has<br />
signed an agreement with <strong>DONG</strong> <strong>Energy</strong> on the acquisition<br />
of 50% of Anholt offshore wind farm for approximately<br />
DKK 6 billion.<br />
Note: Only selected highlights in <strong>2011</strong> are listed. A complete list of<br />
company announcements is available on page 126. 187.<br />
16 June<br />
manaGEmEnt’s rEviEw – <strong>DONG</strong> ENERGY GROUP <strong>ANNUAL</strong> <strong>ANNUAL</strong> <strong>REPORT</strong> <strong>REPORT</strong> <strong>2011</strong> <strong>2011</strong><br />
Construction of west of Duddon sands offshore<br />
wind farm<br />
Decision to build the offshore wind farm West of Duddon<br />
Sands in the Irish Sea in a 50/50 partnership between<br />
<strong>DONG</strong> <strong>Energy</strong> and ScottishPower Renewables with<br />
expected commissioning in 2014. The total investment is<br />
expected to be GBP 1.6 billion.<br />
20 June<br />
Divestment of Oil terminals<br />
<strong>DONG</strong> <strong>Energy</strong> and the Canadian energy infrastructure<br />
business Inter Pipeline Fund agreed that Inter Pipeline<br />
Fund will take over <strong>DONG</strong> <strong>Energy</strong> Oil Terminals.<br />
The price was DKK 2.6 billion and the transaction was<br />
completed in January 2012.
Q3<br />
17 August<br />
signing of Eur 1.3 billion credit facility<br />
<strong>DONG</strong> <strong>Energy</strong> has signed a EUR 1.3 billion 5-year revolving<br />
credit facility which includes two 1 year extension options.<br />
26 August<br />
DOnG <strong>Energy</strong> co-founder of bioenergy consortium<br />
in måbjerg<br />
Together with local players, <strong>DONG</strong> <strong>Energy</strong> established a<br />
green energy consortium, Måbjerg <strong>Energy</strong> Concept. Over<br />
15 months, the consortium will determine whether a number<br />
of bioenergy projects are feasible and will be profitable.<br />
31 August<br />
acquisition of noreco’s interest in the siri field<br />
<strong>DONG</strong> <strong>Energy</strong> made an agreement to acquire Noreco’s<br />
interest in the Siri field in the Danish North Sea for DKK 70<br />
million. The transaction was completed at the end of <strong>2011</strong><br />
and <strong>DONG</strong> <strong>Energy</strong> is now the sole owner of the field.<br />
01 September<br />
marubeni Corporation co-owner of Gunfleet sands<br />
offshore wind farm<br />
Marubeni Corporation has entered into an agreement<br />
with <strong>DONG</strong> <strong>Energy</strong> whereby Marubeni acquires a 49.9%<br />
stake in the 172 MW Gunfleet Sands offshore wind farm.<br />
Marubeni paid a cash consideration of approximately<br />
GBP 210 million for the stake.<br />
Q4<br />
18 October<br />
acquisition of uK shell Gas Direct<br />
<strong>DONG</strong> <strong>Energy</strong> and Shell UK signed an agreement for<br />
<strong>DONG</strong> <strong>Energy</strong> to acquire the gas sales company Shell<br />
Gas Direct for GBP 30 million. The transaction has subsequently<br />
been approved by the EU competition authorities.<br />
27 October<br />
vestas and DOnG <strong>Energy</strong> enter into agreement on<br />
testing of new 7 mw offshore wind turbine<br />
Vestas and <strong>DONG</strong> <strong>Energy</strong> have entered into cooperation on<br />
testing of Vestas’ new V164-7.0 MW offshore wind turbine at<br />
<strong>DONG</strong> <strong>Energy</strong>’s demonstration site in the waters off Frederikshavn.<br />
<strong>DONG</strong> <strong>Energy</strong>’s total investment in the establishment<br />
of the test site will amount to around DKK 240 million.<br />
04 November<br />
acquisition of rights to further develop<br />
Borkum riffgrund west 1<br />
<strong>DONG</strong> <strong>Energy</strong> acquired the rights to further develop the<br />
offshore wind project Borkum Riffgrund West 1 from Energie-kontor<br />
AG for approximately EUR 30 million.<br />
16 December<br />
acquisition of stake in the first two projects in smart<br />
winds Hornsea zone<br />
<strong>DONG</strong> <strong>Energy</strong> acquired a 33.3% stake in the first two offshore<br />
wind farm projects in the Hornsea Zone from SMart<br />
Wind. The purchase price is approximately GBP 15 million<br />
with an option to acquire the remaining 66.7% of the<br />
shares at a fixed market price. <strong>DONG</strong> <strong>Energy</strong> also acquired<br />
an option over an additional 1 GW from the Hornsea Zone.<br />
<strong>DONG</strong> ENERGY <strong>DONG</strong> ENERGY GROUP <strong>ANNUAL</strong> <strong>REPORT</strong> <strong>2011</strong> – manaGEmEnt’s rEviEw 3
PeRfoRMance hIghlIghts, FINANCIAL<br />
Revenue, DKK billion<br />
70<br />
60<br />
50<br />
40<br />
30<br />
20<br />
10<br />
0<br />
2007<br />
2008<br />
2009<br />
2010<br />
<strong>2011</strong><br />
Profit, DKK billion<br />
14<br />
12<br />
10<br />
8<br />
6<br />
4<br />
2<br />
0<br />
DKK million Eur million<br />
<strong>2011</strong> 2010 2009 2008 2007 <strong>2011</strong> 2010<br />
BusinEss pErfOrmanCE<br />
statement of comprehensive income<br />
Revenue: 56,842 54,616 49,569 60,642 41,342 7,630 7,333<br />
Exploration & Production 10,469 8,264 6,416 7,322 4,486 1,405 1,109<br />
Wind Power 4,312 2,952 1,676 1,453 1,201 579 397<br />
Thermal Power 10,665 11,731 10,855 13,800 11,130 1,431 1,575<br />
<strong>Energy</strong> Markets 33,689 31,516 28,889 37,357 20,263 4,522 4,232<br />
Sales & Distribution 13,009 14,185 13,386 15,595 14,551 1,746 1,905<br />
Other activities/eliminations (15,302) (14,032) (11,653) (14,885) (10,289) (2,053) (1,884)<br />
EBITDA: 13,770 14,135 9,311 13,428 9,323 1,848 1,898<br />
Exploration & Production 5,684 5,051 3,264 4,261 2,366 763 678<br />
Wind Power 1,799 1,730 609 677 605 241 233<br />
Thermal Power 2,255 2,228 388 2,388 3,096 303 299<br />
<strong>Energy</strong> Markets 1,963 2,959 2,735 4,352 1,583 263 398<br />
Sales & Distribution 2,027 2,036 2,239 1,827 1,961 272 273<br />
Other activities/eliminations 42 131 76 (77) (288) 6 18<br />
EBITDA adjusted for special hydrocarbon tax 12,254 13,118 8,842 12,681 9,301 1,644 1,761<br />
EBIT 6,100 8,120 4,228 7,809 4,500 818 1,090<br />
Adjusted operating profi t 4,444 6,985 3,658 6,842 4,314 596 938<br />
Profi t for the year 2,882 4,499 1,492 4,669 3,046 386 604<br />
Key ratios<br />
Financial gearing x 0.41 0.43 0.60 0.33 0.35 0.41 0.43<br />
Adjusted net debt / EBITDA<br />
Adjusted net debt / Cash fl ows from<br />
x 1.9 1.9 3.3 1.4 2.0 1.9 1.9<br />
operating activities x 2.0 1.8 3.3 1.9 2.1 2.0 1.8<br />
Return on capital employed (ROCE) % 5.7 9.6 5.5 11.6 7.4 5.7 9.6<br />
Adjusted return on capital employed % 9.2 15.1 7.7 16.1 10.1 9.2 15.1<br />
ifrs<br />
statement of comprehensive income<br />
Revenue1 : 58,437 54,598 49,262 60,777 41,625 7,845 7,331<br />
Exploration & Production 9,931 8,224 6,579 7,114 4,409 1,333 1,104<br />
Wind Power 4,520 2,947 1,676 1,453 1,201 607 396<br />
Thermal Power 10,231 11,330 10,818 13,890 11,198 1,373 1,521<br />
<strong>Energy</strong> Markets 36,211 31,764 28,201 38,087 20,262 4,861 4,265<br />
Sales & Distribution 13,178 14,185 13,386 15,595 14,552 1,769 1,905<br />
Other activities/eliminations (15,634) (13,852) (11,398) (15,362) (9,996) (2,098) (1,860)<br />
4<br />
manaGEmEnt’s rEviEw – <strong>DONG</strong> ENERGY GROUP <strong>ANNUAL</strong> <strong>ANNUAL</strong> <strong>REPORT</strong> <strong>REPORT</strong> <strong>2011</strong> <strong>2011</strong><br />
Profit after tax EBITDA<br />
Likvider<br />
Bindende lånefaciliteter<br />
2007<br />
2008<br />
2009<br />
2010<br />
<strong>2011</strong><br />
EBITDA<br />
Resultat efter s
ifrs<br />
statement of comprehensive income (continued)<br />
Investments and cash flows, DKK billion<br />
20<br />
15<br />
10<br />
5<br />
0<br />
Net investments Cash flows from operating activities<br />
2007<br />
2008<br />
2009<br />
2010<br />
<strong>2011</strong><br />
Capital structure, times<br />
4<br />
3<br />
2<br />
1<br />
0<br />
DKK million Eur million<br />
<strong>2011</strong> 2010 2009 2008 2007 <strong>2011</strong> 2010<br />
EBITDA: 15,595 14,089 8,840 13,622 9,606 2,093 1,892<br />
Exploration & Production 5,146 5,012 3,427 4,053 2,290 691 673<br />
Wind Power 2,007 1,725 609 677 605 269 232<br />
Thermal Power 1,776 1,864 306 2,478 3,164 238 250<br />
<strong>Energy</strong> Markets 4,731 3,207 2,046 5,082 1,582 635 431<br />
Sales & Distribution 2,196 2,036 2,239 1,827 1,961 295 273<br />
Other activities/eliminations (261) 245 213 (495) 4 (35) 33<br />
EBIT 7,925 8,074 3,757 8,004 4,783 1,064 1,084<br />
Gain (loss) on disposal of enterprises 225 905 (62) 917 29 30 121<br />
Net fi nance costs (282) (1,595) (1,362) (1,134) (740) (38) (214)<br />
Profi t for the year 4,250 4,464 1,138 4,815 3,259 571 599<br />
Balance sheet<br />
Assets 154,073 137,339 120,552 106,085 89,710 20,725 18,424<br />
Additions to property, plant and equipment 22,057 16,286 16,530 9,853 11,142 2,962 2,187<br />
Net working capital (181) 2,466 3,898 5,548 4,555 (24) 331<br />
Interest-bearing debt 40,961 38,397 35,926 19,258 18,170 5,511 5,148<br />
Interest-bearing net debt 23,615 22,139 26,930 15,253 14,792 3,177 2,970<br />
Equity 57,740 51,308 44,808 46,190 42,211 7,767 6,883<br />
Capital employed 81,355 73,448 71,737 61,443 57,002 10,943 9,853<br />
Adjusted capital employed 50,190 46,306 46,303 48,287 36,685 6,751 6,212<br />
Cash fl ows<br />
Funds from Operation (FFO) 11,706 12,498 7,529 11,340 10,083 1,571 1,678<br />
Cash fl ows from operating activities 12,624 14,214 9,468 10,379 8,842 1,694 1,908<br />
Cash fl ows from investing activities (19,338) (14,793) (21,199) (8,629) (11,803) (2,595) (1,987)<br />
Gross investments (18,451) (15,692) (18,131) (11,146) (17,512) (2,477) (2,107)<br />
Net investments (13,060) (8,530) (19,040) (8,666) (12,013) (1,752) (1,146)<br />
1 For an explanation of the development in revenue, see page 33.<br />
Defi nitions of performance highlights are set out on the inside of the back cover.<br />
For a description of the performance measure ’business performance’, see pages 33-34 and note 40 on accounting policies in the complete<br />
annual report.<br />
Adjusted net debt/Cash flows<br />
from operating activities<br />
Pengestrømme fra driftsaktivitet<br />
Nettoinvesteringer<br />
2007<br />
2008<br />
2009<br />
Adjusted net debt/<br />
EBITDA<br />
<strong>DONG</strong> ENERGY <strong>DONG</strong> ENERGY GROUP <strong>ANNUAL</strong> <strong>REPORT</strong> <strong>2011</strong> – manaGEmEnt’s rEviEw 5<br />
2010<br />
<strong>2011</strong><br />
Justeret n<br />
Justeret n
PeRfoRMance hIghlIghts, NON-FINANCIAL<br />
volumes<br />
<strong>2011</strong> 2010 2009 2008 2007<br />
Production:<br />
Oil and gas production million boe 26.4 24.4 24.0 18.5 11.3<br />
- oil million boe 9.3 9.0 8.5 10.0 9.1<br />
- gas million boe 17.1 15.4 15.5 8.5 2.2<br />
Electricity generation TWh 20.4 20.2 18.1 18.5 20.5<br />
- thermal TWh 16.0 16.2 15.3 16.0 17.3<br />
- wind and hydro TWh 4.4 4.0 2.8 2.6 3.2<br />
Heat generation<br />
Sales and distribution:<br />
PJ 42.6 53.2 46.7 46.4 47.3<br />
Gas sales (excl. own consumption at power stations) TWh 115.6 108.5 94.0 99.4 78.8<br />
Electricity sales TWh 9.9 10.4 10.7 10.9 10.9<br />
Gas distribution TWh 9.9 11.4 10.0 10.3 10.2<br />
Electricity distribution TWh 8.8 9.1 9.2 9.4 9.3<br />
Oil transportation, Denmark million bbl 72 78 85 91 100<br />
Environment<br />
EU ETS CO emissions 2 million tonnes of CO2 10.8 11.8 11.9 12.6 13.8<br />
CO emissions per energy unit generated<br />
2<br />
(electricity and heat) 1 g/kWh 486 524 574 590 613<br />
Green proportion of electricity and heat generation 1 % 29 30 27 25 24<br />
Nitrogen oxides (NO ) x g/kWh 0.36 0.38 0.50 0.61 -<br />
Sulphur dioxide (SO ) 2 g/kWh 0.06 0.07 0.14 0.19 -<br />
Gas fl aring (offshore and at gas storage facility) million Nm3 9.0 33.0 7.3 8.6 9.7<br />
Oil discharged to sea from production platforms tonnes 16 8 18 24 23<br />
Reinjection of produced water on production platforms % 68 78 49 51 56<br />
Recycling of waste in administration % 48 32 31 10 45<br />
Recycling of waste in facilities % 59 57 57 52 45<br />
Signifi cant environmental incidents number 5 6 5 1 2<br />
working conditions<br />
Full time equivalents (FTE) number 6,098 5,874 5,865 5,644 5,042<br />
Average age years 42 43 43 43 43<br />
Employee turnover % 12 12 11 12 14<br />
Lost time injuries number 74 93 129 112 112<br />
Lost time injury frequency<br />
per one million hours<br />
(LTIF)<br />
worked 4.1 4.6 6.8 7.5 10.4<br />
Fatalities number 3 3 1 1 0<br />
1 Measured on a proportionate basis for all activities and consequently includes associates and non-consolidated enterprises.<br />
The accounting policies are set out in the complete annual report on pages 152-155.<br />
CSR report<br />
Being responsible and responsive are core values in <strong>DONG</strong><br />
<strong>Energy</strong>. The Group believes that no company can achieve<br />
lasting success without ethical integrity, environmental<br />
stewardship and the development of positive relationships<br />
with the people, communities and organisations affected<br />
by its activities.<br />
In <strong>2011</strong>, the Board of Directors adopted a responsibility<br />
policy that sets out the overall principles for the Group’s<br />
6<br />
manaGEmEnt’s rEviEw – <strong>DONG</strong> ENERGY GROUP <strong>ANNUAL</strong> <strong>ANNUAL</strong> <strong>REPORT</strong> <strong>REPORT</strong> <strong>2011</strong> <strong>2011</strong><br />
work on responsibility. Furthermore, <strong>DONG</strong> <strong>Energy</strong> adheres<br />
to the ten principles of the UN Global Compact and follows<br />
the guidelines set out in the Global Reporting Initiative.<br />
The <strong>DONG</strong> <strong>Energy</strong> Group’s policies, actions and results<br />
can be seen on the following page.<br />
Further information can be found on the responsibility<br />
page at dongenergy.com.
un Global<br />
Compact<br />
principle<br />
Climate and<br />
environment<br />
(principles 7-9)<br />
labour rights<br />
(principles 3-6)<br />
Human rights<br />
(principles 1-2)<br />
anti-corruption<br />
(principle 10)<br />
in line with the responsibility<br />
policy,<br />
DOnG <strong>Energy</strong> is committed<br />
to actions and implementation <strong>2011</strong> targets<br />
Reducing greenhouse<br />
gas emissions<br />
Minimising local environmental<br />
impacts<br />
Ensuring the safety<br />
of employees and<br />
suppliers<br />
Ensuring the longterm<br />
availability of<br />
suffi cient numbers of<br />
skilled employees<br />
Ensuring responsible<br />
supply chain<br />
management<br />
Preventing fraud and<br />
corruption<br />
<strong>DONG</strong> <strong>Energy</strong> is committed to reducing its CO 2<br />
emissions from electricity and heat<br />
generation. Key initiatives include:<br />
• New investments in offshore wind farms<br />
• Increased use of biomass in energy<br />
production<br />
• Continued phasing-out of coal-fi red units<br />
<strong>DONG</strong> <strong>Energy</strong> continuously aims to increase<br />
energy effi ciency, partly through optimisation of<br />
production processes<br />
<strong>DONG</strong> <strong>Energy</strong> strives to limit local air pollution<br />
from SO 2 and NO x emissions from electricity<br />
and heat generation by, among other things,<br />
installing environmental facilities for fl ue gas<br />
treatment and taking the most obsolete power<br />
station units out of service<br />
<strong>DONG</strong> <strong>Energy</strong> increased its recycling of waste<br />
from facilities and administration in <strong>2011</strong> still<br />
further through continuous improvement and<br />
monitoring of waste handling<br />
Safety is the top priority in <strong>DONG</strong> <strong>Energy</strong>. In<br />
<strong>2011</strong>, the Group continued its efforts to develop<br />
a strong safety culture focusing on risk assessment<br />
and proactive prevention as well as followup<br />
on all incidents<br />
<strong>DONG</strong> <strong>Energy</strong> has a strategic focus on recruitment<br />
and retention of skilled employees and<br />
long-term development of talent. Initiatives in<br />
<strong>2011</strong> included:<br />
• Implementation of a diversity policy<br />
• Follow-up on the results of the employee survey<br />
‘People Matter’ 2010<br />
<strong>DONG</strong> <strong>Energy</strong> is committed to countering any<br />
abuse of human rights from the Group’s as well<br />
as its suppliers’ activities. In <strong>2011</strong>, the Group<br />
became a founding member of ‘Better Coal’,<br />
which aims to advance CSR issues in the coal<br />
supply chain<br />
In <strong>2011</strong>, <strong>DONG</strong> <strong>Energy</strong> conducted a comprehensive<br />
analysis of selected management systems<br />
and business practices, which will help support<br />
the Group’s future efforts to prevent corruption<br />
• 320g/kWh<br />
by 2020<br />
• 100g/kWh<br />
by 2040<br />
10% improvement<br />
in energy<br />
effi ciency by 2015<br />
(compared with<br />
2010)<br />
By 2020 compared<br />
with 1990:<br />
• 95% reduction<br />
in SO 2<br />
• 90%reduction<br />
in NO x<br />
65% of waste<br />
from facilities and<br />
50% of waste<br />
from administration<br />
must be recycled<br />
by 2012<br />
No fatalities and<br />
LTIF of 5.2 in<br />
<strong>2011</strong>.<br />
The LTIF target<br />
for 2012 is 4.1<br />
Image and leadership<br />
are<br />
focus areas for<br />
<strong>2011</strong>/2012<br />
Updated supply<br />
chain audit strategy<br />
to be implemented<br />
in 2012<br />
Continue to raise<br />
awareness of<br />
policy on good<br />
business conduct<br />
as well as the<br />
Group’s whistleblower<br />
system<br />
status at<br />
31.11.<strong>2011</strong><br />
486g CO 2 /kWh<br />
Target was new<br />
for <strong>2011</strong>. Status<br />
will be presented<br />
in 2012<br />
annual report<br />
• SO 2 99%<br />
• NO x 89%<br />
59% of waste<br />
from facilities<br />
and 48% of<br />
waste from<br />
administration<br />
recycled in <strong>2011</strong><br />
Three fatalities<br />
and LTIF of 4.1<br />
According to<br />
‘People Matter’<br />
<strong>2011</strong>, the following<br />
aspects<br />
have improved<br />
compared with<br />
2010:<br />
• Satisfaction<br />
and<br />
motivation<br />
• Perception of<br />
image<br />
• Employment<br />
security<br />
Follow-up audit<br />
in Colombia<br />
completed in<br />
December <strong>2011</strong><br />
No data for <strong>2011</strong><br />
as improved<br />
methodology for<br />
collecting data<br />
on training on<br />
good business<br />
conduct is in<br />
progress<br />
<strong>DONG</strong> ENERGY <strong>DONG</strong> ENERGY GROUP <strong>ANNUAL</strong> <strong>REPORT</strong> <strong>2011</strong> – manaGEmEnt’s rEviEw 7<br />
coRPoRate socIal ResPonsIBIlIty
MaRket CONDITIONS<br />
<strong>Energy</strong> markets are affected by the economic climate, political priorities<br />
and natural phenomena<br />
<strong>2011</strong> started on an optimistic note, with signs of improvements<br />
in the European economies following the financial<br />
and economic crises that struck Europe from mid-2008.<br />
Over the summer and autumn, the optimism was replaced<br />
by economic uncertainty in the shape of the debt<br />
crisis in Europe, large government budget deficits, the<br />
weakening of the euro against the US dollar, limited economic<br />
growth and the resulting lower demand for energy.<br />
At the same time, the challenges in relation to global<br />
warming remain high on the political agenda. However,<br />
this has not had any visible effect on the pricing of CO2 emissions allowances, as efforts to achieve global endorsement<br />
of targets for reducing CO emissions have yet<br />
2<br />
to succeed. Since summer <strong>2011</strong>, it has become more likely<br />
that there will be an oversupply of CO emissions allow-<br />
2<br />
ances in Europe, and the prices of allowances were at the<br />
lowest level to date at the end of <strong>2011</strong>.<br />
In Europe, there is still the will to support green investments.<br />
In both the UK and Germany, initiatives were undertaken<br />
in <strong>2011</strong> to strengthen renewable energy.<br />
The European energy sector faces large investments in<br />
renewable energy and infrastructure. However, access to<br />
capital has become more difficult as a consequence of the<br />
debt crisis and the beleaguered financial sector. As an alter-<br />
Biomass must be sustainable<br />
Coal is on the way out of <strong>DONG</strong> <strong>Energy</strong>’s power stations.<br />
The plan is for wood pellets, in particular, to replace coal.<br />
Wood pellets can be produced in several different ways.<br />
If they are produced sustainably, they reduce CO 2 emissions<br />
without harming biodiversity. To ensure a sustainable<br />
production of wood pellets, <strong>DONG</strong> <strong>Energy</strong> will make<br />
further requirements of wood pellet producers.<br />
There are currently no general standards for sustainability<br />
in relation to solid biomass. Therefore, <strong>DONG</strong> <strong>Energy</strong> has<br />
worked with other European energy companies to draw up<br />
sustainability criteria for the production of wood pellets.<br />
The criteria are designed to ensure that the wood pellets<br />
8<br />
manaGEmEnt’s rEviEw – <strong>DONG</strong> ENERGY GROUP <strong>ANNUAL</strong> <strong>ANNUAL</strong> <strong>REPORT</strong> <strong>REPORT</strong> <strong>2011</strong> <strong>2011</strong><br />
native, other sources are therefore increasingly being used,<br />
such as pension funds and other institutional investors.<br />
The prices of oil and gas fell sharply in 2008-09 in the<br />
wake of the financial and economic crises. There was no<br />
corresponding trend in <strong>2011</strong>, when oil and gas prices remained<br />
at a higher level (USD 111/bbl on average in <strong>2011</strong><br />
against USD 62/bbl in 2009 for oil and EUR 23/MWh<br />
against EUR 12/MWh for gas). The wider spread between<br />
oil and gas prices, with relatively higher oil prices (decoupling),<br />
which arose in spring 2009, continues to prevail.<br />
The accident at the Fukushima nuclear power station in<br />
connection with the earthquake in Japan in March <strong>2011</strong> led<br />
to a change in the approach to nuclear power in several<br />
countries. In Germany, several older nuclear power stations<br />
were immediately shut down and a decision was<br />
taken to phase out the remaining stations faster than<br />
originally planned.<br />
Despite this, there is still surplus capacity for the<br />
generation of electricity in Europe, and demand is lower<br />
than before the financial crisis. The surplus capacity is not<br />
expected to be reduced until a number of the most polluting<br />
coal-fired power stations in Europe are phased out in<br />
the coming 3-8 years.<br />
that <strong>DONG</strong> <strong>Energy</strong> uses continue to reduce CO 2 emissions<br />
and preserve biodiversity.<br />
“With wood pellets, Danish power stations can deliver<br />
green electricity and heat to supplement the more variable<br />
wind energy. I hope that the European authorities will be<br />
inspired by the criteria that <strong>DONG</strong> <strong>Energy</strong> and our partners<br />
have established and will develop pan-European standards<br />
for sustainability for biomass. That would enable us to talk<br />
to the producers of wood pellets with even greater conviction<br />
so we can ensure that the wood pellets we use in Europe<br />
continue to be sustainable,” says Thomas Dalsgaard,<br />
Executive Vice President of Thermal Power.
Spearheading the development<br />
of the energy of the future<br />
The strategy will push <strong>DONG</strong> <strong>Energy</strong> to the forefront in the transition<br />
to the energy of the future<br />
<strong>DONG</strong> <strong>Energy</strong>’s ambitious business strategy takes as its<br />
starting point some of the world’s biggest challenges in the<br />
energy market, as <strong>DONG</strong> <strong>Energy</strong> aims to create value by delivering<br />
ever cleaner and more reliable energy with no emissions<br />
of CO . 2<br />
The global population passed the seven billion mark in <strong>2011</strong><br />
and this number will continue to grow. As the growing global<br />
population strives to secure a share in the world’s prosperity,<br />
the world’s energy needs will grow. These two challenges also<br />
present the world with a third challenge: to reduce emissions of<br />
CO so that man-made climate change can be reduced.<br />
2<br />
By 2020, <strong>DONG</strong> <strong>Energy</strong> wants to halve its CO emissions<br />
2<br />
from electricity and heat generation compared with 2006.<br />
At the same time, <strong>DONG</strong> <strong>Energy</strong> wants to double EBITDA<br />
by 2015 compared with 2009 by means of organic investments.<br />
The Group is well on the way to achieving these targets.<br />
The investments will increase <strong>DONG</strong> <strong>Energy</strong>’s production<br />
of energy and are being made primarily in the two business<br />
areas in which <strong>DONG</strong> <strong>Energy</strong> has the greatest competitive<br />
edge and strong capabilities: design, construction and<br />
operation of offshore wind farms, and oil and gas exploration<br />
and production.<br />
To retain its ability to gauge, at an early stage, the<br />
changes in the market and society that are of importance to<br />
<strong>DONG</strong> <strong>Energy</strong>’s strategic priorities, the Group works concertedly<br />
on innovation to retain its lead.<br />
The four main strategic directions<br />
<strong>DONG</strong> <strong>Energy</strong> pursues four main strategic directions to achieve<br />
the Group’s ambitious objectives. They are illustrated below<br />
and will be explained in further detail on the following pages.<br />
<strong>DONG</strong> <strong>Energy</strong>’s strategic directions<br />
Wind and biomass growth<br />
Growth in the production<br />
and sourcing of oil and gas<br />
Halving CO 2 emissions, g CO 2 per kWh<br />
650<br />
600<br />
550<br />
500<br />
450<br />
400<br />
350<br />
300<br />
2006<br />
Doubling EBITDA, DKK billion<br />
18<br />
16<br />
14<br />
12<br />
10<br />
8<br />
6<br />
4<br />
2<br />
0<br />
Realised Target<br />
638<br />
613<br />
590<br />
Realised Target Trend<br />
8.8<br />
2009<br />
2008<br />
2010<br />
574<br />
2010<br />
524<br />
486<br />
13.8<br />
<strong>2011</strong><br />
2012<br />
Robustness via the<br />
integrated business model<br />
Development of the flexible<br />
energy system of the future<br />
<strong>DONG</strong> ENERGY <strong>DONG</strong> ENERGY GROUP <strong>ANNUAL</strong> <strong>REPORT</strong> <strong>2011</strong> – manaGEmEnt’s rEviEw 9<br />
2012<br />
2014<br />
2013<br />
2016<br />
2014<br />
2018<br />
17.6<br />
2015<br />
320<br />
2020<br />
BusIness AND STRATEGY<br />
524<br />
Mål<br />
Realisere<br />
EBITDA Likvider<br />
Bindende
e<br />
fremog<br />
gas<br />
BusIness AND STRATEGY<br />
By 2020, the target is to halve <strong>DONG</strong> <strong>Energy</strong>’s CO 2 emis-<br />
sions per kWh generated compared with 2006, and CO 2<br />
emissions should be reduced to 100 g/kWh by 2040.<br />
These ambitious targets will be achieved by radical<br />
conversion of <strong>DONG</strong> <strong>Energy</strong>’s electricity generation from<br />
fossil to renewable energy. <strong>DONG</strong> <strong>Energy</strong> continues to develop<br />
offshore wind farms in Denmark, the UK and Germany,<br />
and the plan is for coal-fired power stations to be<br />
converted to biomass. <strong>DONG</strong> <strong>Energy</strong> has also made investments<br />
in power stations that use gas, which emits significantly<br />
less CO than coal. This is the best alternative,<br />
2<br />
among fossil fuels, for safeguarding reliable energy supply.<br />
<strong>DONG</strong> <strong>Energy</strong> operates gas-fired power stations in Denmark,<br />
the UK, Norway and the Netherlands.<br />
The transition to greener energy generation entails<br />
greater technological and geographical diversification. <strong>DONG</strong><br />
<strong>Energy</strong> wants to maintain its position as the market-leading<br />
energy producer in Denmark, while reducing its dependence<br />
on the Danish market by increasing its presence in the markets<br />
in northwestern Europe. In 2006, 91% of the Group’s<br />
electricity generation capacity was located in Denmark. The<br />
Danish proportion was reduced to 67% in <strong>2011</strong> and is expected<br />
to account for just over half of capacity in 2015.<br />
Renewable and thermal energy generation capacity, MW<br />
Coal<br />
7,000<br />
6,000<br />
5,000<br />
4,000<br />
3,000<br />
2,000<br />
1,000<br />
0<br />
Oil<br />
2006<br />
Gas<br />
Robusthed gennem den<br />
integrerede forretningsmodel<br />
Wind and biomass growth<br />
Udvikling af fremtidens<br />
fleksible energisystem<br />
<strong>DONG</strong> <strong>Energy</strong> wants to change the Group via organic growth by means<br />
of investments in green energy from offshore wind farms and conversion of<br />
power stations to biomass<br />
Biomass<br />
<strong>2011</strong><br />
Waste<br />
Wind<br />
2015<br />
estimate<br />
Hydro<br />
10<br />
manaGEmEnt’s rEviEw – <strong>DONG</strong> ENERGY GROUP <strong>ANNUAL</strong> <strong>ANNUAL</strong> <strong>REPORT</strong> <strong>REPORT</strong> <strong>2011</strong> <strong>2011</strong><br />
more renewable energy<br />
Efficient utilisation of <strong>DONG</strong> <strong>Energy</strong>’s unique capabilities<br />
in the area of offshore wind has meant that <strong>DONG</strong> <strong>Energy</strong><br />
is the global market leader in the design, construction and<br />
operation of offshore wind farms.<br />
The electricity generation capacity from wind continues<br />
to rise. Together with electricity generation from power stations<br />
based on biomass and waste, plus hydro power, renewable<br />
energy accounted for 31% of <strong>DONG</strong> <strong>Energy</strong>’s total<br />
electricity generation capacity in <strong>2011</strong>.<br />
The use of coal has been reduced and, compared with<br />
2006, the coal-fired power stations’ proportion of total capacity<br />
for energy production was halved to 24% at the end<br />
of <strong>2011</strong>. <strong>DONG</strong> <strong>Energy</strong> had five coal-fired power station units<br />
fewer than in 2006. At the end of <strong>2011</strong>, gas-fired capacity accounted<br />
for 31% of total electricity generation capacity.<br />
Global market leader in offshore wind farms<br />
The first offshore wind farms in the world were built on<br />
Danish territory. <strong>DONG</strong> <strong>Energy</strong> has since built several Danish<br />
and British offshore wind farms and, in 2013, construction<br />
begins on a German offshore wind farm, Borkum Riffgrund<br />
1.<br />
The first offshore wind farms were established project<br />
by project, but, since the start of 2009, <strong>DONG</strong> <strong>Energy</strong> has<br />
been working intensively to develop and install offshore<br />
wind farms in an assembly line concept and to enhance efficiency<br />
in all stages of the offshore wind farm value chain.<br />
The first step Water was <strong>DONG</strong> <strong>Energy</strong>’s Affaldlarge-scale<br />
contract with<br />
Siemens to buy over 500 offshore<br />
Wind<br />
Biomasse<br />
wind turbines and the<br />
purchase of the installation company A2SEA, which is<br />
Waste<br />
Gas<br />
jointly owned with Siemens. With these and other meas-<br />
Biomass Oile<br />
ures, the farms can be established in a continuous process<br />
with a constant Gas focus on optimum Kul use of skills and resources<br />
and Oil thus maximum value creation at all stages<br />
from design Coal to operation. As the construction cost makes<br />
up three quarters of the total cost in the service life of an
Waste is a valuable resource<br />
It is well known that household waste can be burned and<br />
thus generate energy. <strong>DONG</strong> <strong>Energy</strong> and its partners have<br />
developed brand-new technology that converts waste into<br />
energy more cost-effectively, more flexibly and more efficiently<br />
than combustion.<br />
<strong>DONG</strong> <strong>Energy</strong> has called this technology REnescience.<br />
Household waste directly from refuse trucks is treated<br />
with enzymes and becomes a liquid for energy purposes<br />
that can be converted into biogas and a solid fraction that<br />
can be used directly to generate electricity and heat.<br />
offshore wind farm, it is essential to keep to schedules so<br />
that the capital invested can start to be repaid as soon as<br />
possible.<br />
wind power challenges power stations<br />
In 2015, half of <strong>DONG</strong> <strong>Energy</strong>’s electricity generation capacity<br />
will be CO -free or CO -neutral, as electricity from<br />
2 2<br />
wind and hydro is expected to account for 36% of total capacity,<br />
while biomass will account for 17%. Gas will account<br />
for 30%, while electricity generation capacity from<br />
coal and oil will have been reduced to 17%.<br />
<strong>DONG</strong> <strong>Energy</strong> works concertedly to select and develop<br />
new offshore wind turbine projects. It is essential to have a<br />
large pipeline to enable us to meet our objective of continuously<br />
increasing the proportion of electricity generation<br />
from renewable energy sources. On top of its 1,025 MW of<br />
wind capacity at the end of <strong>2011</strong>, <strong>DONG</strong> <strong>Energy</strong> has made<br />
Metal and glass are also separated in the process for recycling,<br />
as well as nutrients that can be used for fertiliser<br />
in agriculture.<br />
“At <strong>DONG</strong> <strong>Energy</strong>, we see waste as a valuable resource<br />
and, with REnescience, we make much more intelligent<br />
use of waste than with other methods. We have developed<br />
the process from the laboratory to the demonstration<br />
stage. Now we will make REnescience part of our business,”<br />
says Manager Nanna Dreyer Nørholm, New Bio<br />
Solutions.<br />
final investment decisions regarding the construction of<br />
around 1,500 MW additional wind turbines, some of which<br />
are expected to be built together with partners thus reducing<br />
<strong>DONG</strong> <strong>Energy</strong>’s share (see figure on page 21).<br />
The fast-increasing volume of electricity from wind turbines<br />
in the Danish grid sets the Danish power stations<br />
completely new challenges. The power stations will play a<br />
different role in a future in which much more wind power is<br />
available as there will still be a need to balance electricity<br />
generation. <strong>DONG</strong> <strong>Energy</strong> is continuously striving to become<br />
more efficient at flexible, market-aligned operation<br />
of its power stations.<br />
<strong>DONG</strong> ENERGY <strong>DONG</strong> ENERGY GROUP <strong>ANNUAL</strong> <strong>REPORT</strong> <strong>2011</strong> – manaGEmEnt’s rEviEw 11
or fremlie<br />
og gas<br />
BusIness AND STRATEGY<br />
Udvikling af fremtidens<br />
fleksible energisystem<br />
Growth in the production and sourcing of oil and gas<br />
<strong>DONG</strong> <strong>Energy</strong> is producing increasing volumes of oil and gas to help meet<br />
the increasing demand for energy<br />
In the years to come, <strong>DONG</strong> <strong>Energy</strong> will focus on increasing<br />
its production of oil and gas to help maintain security<br />
of supply and the Group’s earnings. This will be done via<br />
investments in exploration and production (E&P) of oil and<br />
gas from its own fields, for example in the North Sea. The<br />
Group’s equity production of gas will continue to be an important<br />
source of its gas sales. The proportion of oil in the<br />
portfolio will be increased in order to reduce the oil price<br />
risk in <strong>DONG</strong> <strong>Energy</strong>’s gas purchase contracts and to ensure<br />
high value creation.<br />
The Group has strong capabilities in oil and gas exploration<br />
and production. The objective is to make use of this<br />
expertise to achieve solid growth in the production of oil<br />
and gas and also safeguard continuous replenishment of<br />
reserves, partly via exploration.<br />
<strong>DONG</strong> <strong>Energy</strong> will also secure the supply of gas to the<br />
Group’s markets in Northern Europe by means of a diversified<br />
gas supply strategy, which, besides increasing equity<br />
production, will be based on contracts with other producers<br />
of natural gas, including LNG (liquefied natural gas).<br />
infrastructure and production<br />
<strong>DONG</strong> <strong>Energy</strong> has built up an E&P company that has a<br />
strong position in Denmark, Norway and the promising<br />
West of Shetland area in the UK. The total reserves amount<br />
to more than 17 times the annual production (R/P ratio) in<br />
<strong>2011</strong>, which secures production for many years to come and<br />
shows that, in recent years, <strong>DONG</strong> <strong>Energy</strong> has built up a robust<br />
E&P business that has strong capabilities in this field.<br />
In Denmark, E&P has developed its production around<br />
the Siri platform, where major repair work is underway to<br />
extend its life to 2020 and maybe beyond. Furthermore,<br />
E&P has made new attractive finds on the Danish shelf that<br />
can contribute to an extension of security of supply and<br />
value creation from the Danish shelf in the years to come.<br />
12<br />
manaGEmEnt’s rEviEw – <strong>DONG</strong> ENERGY GROUP <strong>ANNUAL</strong> <strong>ANNUAL</strong> <strong>REPORT</strong> <strong>REPORT</strong> <strong>2011</strong> <strong>2011</strong><br />
In Norway, E&P has gained a position among the Top 10<br />
companies, partly based on its position in the large Ormen<br />
Lange gas field. E&P has also contributed to the development<br />
of a model for commercial development of and production<br />
from small, but attractive, fields such as Oselvar<br />
and Trym.<br />
In the area between the Shetland Islands and the Faroe<br />
Islands, <strong>DONG</strong> <strong>Energy</strong> has made a number of finds of both<br />
oil and gas. Advanced exploration technology and in-depth<br />
knowledge of precisely the type of subterranean structure<br />
that exists in the West of Shetland area have resulted in<br />
seven out of nine exploration wells being successful. Together<br />
with the French oil company Total, E&P has contributed<br />
to a solution to the challenge in the area in terms of<br />
the lack of infrastructure, as the companies are establishing<br />
a pipeline system in connection with the development<br />
of the Laggan-Tormore gas fields that will create a link<br />
from production in the area to the UK market. <strong>DONG</strong> <strong>Energy</strong><br />
has a 20% stake in Laggan-Tormore.<br />
Diversified gas supply strategy<br />
Until 2006, the gas portfolio consisted primarily of longterm<br />
contracts with Dansk Undergrunds Consortium<br />
(DUC). The portfolio has since become more diversified<br />
with a continued rise in equity production of gas, purchases<br />
from other producers in the North Sea and purchases<br />
on gas hubs. Diversification was increased further<br />
in <strong>2011</strong> via <strong>DONG</strong> <strong>Energy</strong>’s co-ownership of the new LNG<br />
terminal Gate in Rotterdam, which became operational in<br />
September <strong>2011</strong>, plus new long-term gas purchase contracts.<br />
Diversification is also a key word in the sale of gas,<br />
which now covers <strong>DONG</strong> <strong>Energy</strong>’s entire market territory.<br />
A breakdown of gas production and gas sales in <strong>2011</strong> is<br />
shown in a graph on page 25.
<strong>DONG</strong> <strong>Energy</strong> involves local operators<br />
in oil exploration<br />
Exploration for oil and gas is linked to environmental risks<br />
that must be managed on the basis of the best possible<br />
knowledge base. One of the ways in which <strong>DONG</strong> <strong>Energy</strong><br />
ensures this is by working with relevant local operators<br />
who can contribute knowledge and challenge the solutions<br />
chosen.<br />
In Norway, in recent years, <strong>DONG</strong> <strong>Energy</strong> has worked with<br />
local fishermen and public authorities on the Group’s<br />
mapping of potential environmental impacts of drilling in<br />
the Barents Sea. One of the results of the dialogue has<br />
been joint environmental emergency plans that are designed<br />
to protect the coastline in the event of accidents.<br />
“Risk is part of business in our industry. But by involving<br />
stakeholders and being open and responsive in relation<br />
to oil drilling, we believe that we have created trust in<br />
<strong>DONG</strong> <strong>Energy</strong> and have reassured the local community,”<br />
says QHSE Manager Morten A. Torgersen, <strong>DONG</strong><br />
E&P Norge.<br />
<strong>DONG</strong> ENERGY <strong>ANNUAL</strong> <strong>REPORT</strong> <strong>2011</strong> – manaGEmEnt’s rEviEw 13
em den<br />
tningsmodel<br />
tidens<br />
ystem<br />
BusIness AND STRATEGY<br />
Robustness via the integrated business model<br />
<strong>DONG</strong> <strong>Energy</strong> wants to create value by optimising and developing the<br />
total energy portfolio with assets and market positions throughout the<br />
value chain<br />
<strong>DONG</strong> <strong>Energy</strong>’s business model is fully integrated with<br />
value creation in all stages of the energy value chain. Upstream<br />
with oil and gas exploration and production and<br />
electricity generation, midstream with all types of trading,<br />
wholesale sales and energy distribution, and downstream<br />
with direct energy sales to end customers.<br />
The integrated business model, with a diversified portfolio<br />
of assets, secures both robustness and balancing of risks as<br />
the individual stages of the value chain are, to some extent,<br />
affected differently by market developments.<br />
There is also an active management of risks in the individual<br />
stages of the value chain. The investments in <strong>DONG</strong><br />
<strong>Energy</strong>’s two growth areas, Exploration & Production and<br />
Wind Power, are spread over several countries and made in<br />
partnership with different partners in order to achieve diversification<br />
of the risk. In the E&P sector, partnerships have<br />
been the norm for several years. However, <strong>DONG</strong> <strong>Energy</strong> has<br />
now also succeeded in introducing partnerships in connection<br />
with the establishment and operation of offshore wind<br />
farms. The partners include other energy companies, pri-<br />
Breakdown of electricity generation 1<br />
100%<br />
Fixed prices incl. certificates Nord Pool variable prices<br />
UK variable prices<br />
80%<br />
60%<br />
40%<br />
20%<br />
0%<br />
2007<br />
Other<br />
<strong>2011</strong><br />
2015<br />
estimate<br />
1 The proportion is calculated on the basis of revenue from wind<br />
farms and contribution margin from thermal power stations.<br />
14<br />
manaGEmEnt’s rEviEw – <strong>DONG</strong> ENERGY GROUP <strong>ANNUAL</strong> <strong>ANNUAL</strong> <strong>REPORT</strong> <strong>REPORT</strong> <strong>2011</strong> <strong>2011</strong><br />
vately owned companies and institutional investors, including<br />
pension funds.<br />
These two growth areas complement each other in terms<br />
of risk. The investments in Wind Power are characterised by<br />
producing relatively stable income, partly as a consequence<br />
of regulation and the subsidy regimes established to support<br />
the development of the industry. The investments in Exploration<br />
& Production are characterised by providing a less certain<br />
return but also have considerable potential.<br />
The increased geographical spread of electricity generation<br />
from wind turbines and power stations reduces the<br />
Group’s market price risks. In 2007, two-thirds of the value of<br />
electricity generation was sold at market prices on the Nord<br />
Pool power exchange. This proportion is expected to be reduced<br />
to 12% by 2015. In terms of price, this part of generation<br />
depends greatly on temperature and precipitation levels<br />
in the Nordic countries and is thus very difficult to predict<br />
and very variable. However, the proportion of electricity generation<br />
settled at fixed prices is expected to rise from 13% in<br />
2007 to 67% in 2015 as a consequence of the transition to<br />
more green energy.<br />
With the various developments in oil and gas prices in recent<br />
years (decoupling), the composition of purchase and<br />
sales contracts in the gas portfolio has assumed greater importance<br />
for earnings for both <strong>DONG</strong> <strong>Energy</strong> and other play-<br />
ers in the market. This is because the settlement prices for<br />
gas in long-term Other purchase contracts are closely linked to<br />
changes in UK the variable price of prices oil, while sales contracts are more dependent<br />
on Nord gas Pool hub variable prices. Therefore, prices a higher increase in<br />
the price Fixed of oil than prices the incl. price certificates of gas is negative for <strong>DONG</strong> <strong>Energy</strong>.<br />
However, these effects are mitigated as far as possible<br />
via the Group’s diversification strategy, which results in<br />
<strong>DONG</strong> <strong>Energy</strong> being less financially vulnerable to the decoupling.<br />
<strong>DONG</strong> <strong>Energy</strong> has a relatively balanced gas portfolio<br />
composition between the purchase and sales side. For example,<br />
our equity production of oil and gas helps reduce this<br />
problem considerably.
The ambitious business strategy<br />
means stricter requirements for managers<br />
The execution of <strong>DONG</strong> <strong>Energy</strong>’s ambitious business strategy<br />
means stricter requirements for individual managers.<br />
The managers must help ensure the right balance between<br />
growth and discipline in relation to the overall business<br />
strategy.<br />
To obtain a thorough analysis of the current managerial<br />
resources in <strong>DONG</strong> <strong>Energy</strong>, an extensive assessment of<br />
the Top 200 managers was carried out in the first half of<br />
<strong>2011</strong>. The ongoing assessment and development of<br />
managers in relation to the overall strategy are linked to<br />
the annual dialogue with all employees on performance<br />
and development.<br />
strategic robustness<br />
<strong>DONG</strong> <strong>Energy</strong> has focused its operations in recent years.<br />
Growth will be in wind, biomass and oil and gas. At the<br />
same time, a number of activities have been divested, including<br />
interests in hydro power, small-scale CHP plants<br />
and oil terminals.<br />
“Each employee must understand his or her role in relation<br />
to the strategy. We achieve this by means of annual<br />
performance and development reviews between<br />
managers and employees. The reviews take place after<br />
the managers’ performance and development have been<br />
assessed in relation to the strategy. This enables us to<br />
create cohesion at all levels,” says Hanne Blume, Vice<br />
President of People & Development.<br />
This focus has helped <strong>DONG</strong> <strong>Energy</strong> come through the<br />
financial crisis and subsequent debt turmoil in Europe<br />
unscathed. Its robustness is also the reason why <strong>DONG</strong><br />
<strong>Energy</strong> is continuously able to raise the necessary capital<br />
for investments on attractive terms.<br />
<strong>DONG</strong> ENERGY <strong>DONG</strong> ENERGY GROUP <strong>ANNUAL</strong> <strong>REPORT</strong> <strong>2011</strong> – manaGEmEnt’s rEviEw 15
mtidens<br />
system<br />
BusIness AND STRATEGY<br />
Development of the flexible energy system<br />
of the future<br />
With a rising proportion of wind energy, there is a growing need to be able<br />
to both sell and source electricity to and from the surrounding markets<br />
Denmark is undergoing a rapid transition, with the volume<br />
of renewable energy being expanded and dependence on<br />
fossil fuels being reduced. The Danish energy system is an<br />
important market for <strong>DONG</strong> <strong>Energy</strong>. Therefore, <strong>DONG</strong> <strong>Energy</strong><br />
is playing an active role in the development of the energy<br />
system of the future.<br />
need for greater flexibility<br />
When an ever higher proportion of energy in the system<br />
comes from wind turbines, the generation of energy becomes<br />
less predictable and more variable. Therefore, it will<br />
be necessary to have flexible systems to ensure there is a<br />
balance between energy demand and energy generation.<br />
The challenge is to make use of the surplus energy during<br />
windy periods and also be able to supply sufficient<br />
energy when there is no wind. Responsibility for balancing<br />
Electricity interconnectors to surrounding markets<br />
UK<br />
Existing<br />
Under construction<br />
Potential<br />
The Netherlands<br />
16<br />
manaGEmEnt’s rEviEw – <strong>DONG</strong> ENERGY GROUP <strong>ANNUAL</strong> <strong>ANNUAL</strong> <strong>REPORT</strong> <strong>REPORT</strong> <strong>2011</strong> <strong>2011</strong><br />
energy supply rests with the system operators (in Denmark<br />
it is Energinet.dk). At the same time, <strong>DONG</strong> <strong>Energy</strong> is involved<br />
in the work to develop market-based mechanisms<br />
and new technologies that can help create a balance between<br />
generation and consumption. One way of balancing<br />
supply and demand would be to build capacity to transmit<br />
electricity through cables to surrounding markets.<br />
In terms of generation, Denmark’s high proportion of<br />
electricity from wind turbines means that the power stations<br />
have to be extremely flexible. Where power stations<br />
previously generated the majority of electricity, their task<br />
is increasingly to contribute to a reliable supply of electric-ity<br />
by supplementing wind generation so that there is<br />
sufficient electricity in the system to meet demand. This<br />
requires extensive adaptation of operations. <strong>DONG</strong> <strong>Energy</strong><br />
is also planning to convert the Danish power stations<br />
to green electricity generation by increasing its use<br />
of biomass.<br />
new energy technologies on the way to the market<br />
In the future, biomass will supplement wind power to secure<br />
a clean and reliable energy supply. Over the past ten<br />
years, <strong>DONG</strong> <strong>Energy</strong> has conducted research into how biomass<br />
can be used intelligently for the production of energy.<br />
This research has resulted in the development of, among<br />
other things, three biorefining technologies called Pyroneer,<br />
Inbicon and REnescience. The technologies make it<br />
possible to convert biomass residual products from agriculture<br />
and households into gas, bioethanol and other<br />
biobased energy resources.<br />
<strong>DONG</strong> <strong>Energy</strong>’s targeted contributions to the development<br />
of the energy system of the future are being made in<br />
close collaboration between innovative incubators internally<br />
at <strong>DONG</strong> <strong>Energy</strong> and external research and university<br />
environments and enterprises.
<strong>DONG</strong> <strong>Energy</strong> contributes to green growth<br />
by establishing offshore wind farms<br />
While the rising generation of electricity from wind benefits<br />
customers in the form of greener electricity, <strong>DONG</strong><br />
<strong>Energy</strong> also contributes to value creation and economic<br />
growth in the local areas in which the Group operates. In<br />
connection with the construction and operation of the<br />
Group’s new offshore wind farm at Anholt in Denmark, it<br />
is expected that 8,000 jobs will be created in each of the<br />
two years in which the farm is being constructed.<br />
impact on customer consumption<br />
On the consumption side, efforts are being made to make<br />
consumer demand for energy more flexible so that consumption<br />
more closely matches the periods in which high<br />
levels of wind energy are being generated. Electric cars are a<br />
good example of how flexibility can be incorporated in electricity<br />
consumption. An electric car needs to be charged with<br />
electricity to run. However, the charging does not need to<br />
take place at the time at which the plug is inserted in the<br />
socket. Customer needs will typically dictate that charging<br />
takes place during the evening and the night, so that the<br />
car is ready for use the following morning. With intelligent<br />
“The Anholt project shows that the Danish suppliers in<br />
the industry can hold their own internationally. All the<br />
work was put out to tender on equal EU conditions, but<br />
Danish-based companies won two thirds of the orders,”<br />
says Flemming Thomsen, Project Manager of Anholt<br />
offshore wind farm.<br />
systems in the grid and at the customer’s home, it is possible<br />
to ensure that charging takes place at a time at which<br />
there is surplus electricity generation from wind turbines but<br />
consumption is low.<br />
In <strong>2011</strong>, <strong>DONG</strong> <strong>Energy</strong> began a trial of intelligent, flexible<br />
electricity consumption in 155 private households. The<br />
households were supplied with a ‘smart’ unit that reacts to<br />
a price signal and starts or stops heat pumps, charging of<br />
electric cars or other units with high electricity consumption.<br />
The aim of the trial is to study the customers’ ability<br />
and desire to interact with their electricity supplier to<br />
achieve flexible electricity consumption.<br />
<strong>DONG</strong> ENERGY <strong>DONG</strong> ENERGY GROUP <strong>ANNUAL</strong> <strong>REPORT</strong> <strong>2011</strong> – manaGEmEnt’s rEviEw 17
eXPloRatIon<br />
AT A GLANCE<br />
& PRoductIon<br />
eXPloRatIon & PRoductIon<br />
Continued growth and value creation<br />
Exploration & Production explores for and produces oil and gas. In <strong>2011</strong>, daily production<br />
averaged 72 thousand boe, of which 82% came from Norwegian fields and 18% from Danish<br />
fields. The portfolio of reserves (2P) is robust and amounted to 446 million boe at the end of <strong>2011</strong>,<br />
equivalent to 17 years’ production.<br />
Exploration & Production has 65 licences: 13 in Denmark, 21 in the UK (West of Shetland), 27 in<br />
Norway, 2 in Greenland and 2 on the Faroe Islands. Constant exploration for oil and gas is part<br />
of the foundation of the Group’s growth strategy. The objective is solid growth in production to<br />
enhance security of supply and earnings.<br />
Executive Vice President<br />
Søren Gath Hansen<br />
18<br />
manaGEmEnt’s rEviEw – <strong>DONG</strong> ENERGY GROUP <strong>ANNUAL</strong> <strong>ANNUAL</strong> <strong>REPORT</strong> <strong>REPORT</strong> <strong>2011</strong> <strong>2011</strong><br />
Read more about Exploration & Production:<br />
www.dongenergy.com/EN/EP<br />
EP - EN Renewables - EN Generation - EN <strong>Energy</strong> Markets - EN
The photo shows the Siri platform in the<br />
Danish part of the North Sea.<br />
rEvEnuE<br />
DKK 10.5Bn<br />
14%<br />
EBitDa<br />
DKK 5.7Bn<br />
41%<br />
EmplOyEEs (FTE)<br />
652<br />
11%<br />
The percentages indicate the proportion of the<br />
Group that each business area accounted for in <strong>2011</strong>.<br />
Northern Norway<br />
Greenland<br />
<strong>DONG</strong> <strong>Energy</strong> offi ce<br />
Geographic focus area<br />
for oil and gas exploration<br />
and production<br />
Gassled, gas transmission<br />
system partly owned by<br />
<strong>DONG</strong> <strong>Energy</strong><br />
new producing fields <strong>2011</strong>-2015<br />
New fields in production <strong>2011</strong>-2014<br />
<strong>2011</strong><br />
Trym<br />
Norway<br />
2012 2013 2014 2015<br />
Oselvar<br />
Norway<br />
Marulk<br />
Norway<br />
Producing oil/gas fi eld,<br />
partly owned by <strong>DONG</strong><br />
<strong>Energy</strong>. <strong>DONG</strong> <strong>Energy</strong> is<br />
a licence partner<br />
Producing oil/gas fi eld,<br />
partly owned by <strong>DONG</strong><br />
<strong>Energy</strong>. <strong>DONG</strong> <strong>Energy</strong> is<br />
the licence operator<br />
Production and reserves (2P) of oil and gas, million boe<br />
Reserves (2P), year end<br />
Production<br />
Reserves (2P) Production<br />
450<br />
45<br />
400<br />
40<br />
350<br />
35<br />
300<br />
30<br />
250<br />
25<br />
200<br />
20<br />
150<br />
15<br />
100<br />
10<br />
50<br />
5<br />
0<br />
0<br />
2009<br />
2010<br />
<strong>2011</strong><br />
r/p-ratio<br />
2009<br />
15<br />
2010<br />
18<br />
<strong>2011</strong><br />
Syd Arne Phase 3<br />
Denmark<br />
Oil/gas fi eld under development,<br />
partly owned by<br />
<strong>DONG</strong> <strong>Energy</strong><br />
Oil/gas fi eld under evaluation,<br />
partly owned by<br />
<strong>DONG</strong> <strong>Energy</strong><br />
Laggan-Tormore<br />
UK<br />
New discovery in <strong>2011</strong><br />
Hejre *<br />
Denmark<br />
For 2012-2015, oil and gas fi elds for which a fi nal investment decision has been made are shown.<br />
* Decided February 2012.<br />
<strong>DONG</strong> ENERGY <strong>DONG</strong> ENERGY GROUP <strong>ANNUAL</strong> <strong>REPORT</strong> <strong>2011</strong> – manaGEmEnt’s rEviEw 19<br />
17<br />
Produktion<br />
Reserver (2P), ultimo
AT A GLANCE<br />
wInd PoweR<br />
Global market leader in<br />
offshore wind power<br />
Wind Power develops, constructs and operates wind farms in Northern Europe. The focus is on<br />
the UK and Germany as the largest growth markets.<br />
To maintain its position as the global market leader, <strong>DONG</strong> <strong>Energy</strong> focuses on developing a<br />
robust and balanced project pipeline across countries and markets and on having in-house<br />
capabilities in all stages of the project value chain. To reduce costs, the Group also focuses<br />
on enhancing the efficiency of projects via installation concepts and framework agreements.<br />
In addition, Wind Power enters into partnerships with industrial and financial partners to<br />
spread risks and secure co-financing for projects.<br />
CEO<br />
Anders Eldrup<br />
Read more about Wind Power:<br />
www.dongenergy.com/EN/Wind_Power<br />
EP - EN Wind Power - EN Thermal Power - EN <strong>Energy</strong> Markets - EN<br />
20<br />
manaGEmEnt’s rEviEw – <strong>DONG</strong> ENERGY GROUP <strong>ANNUAL</strong> <strong>ANNUAL</strong> <strong>REPORT</strong> <strong>REPORT</strong> <strong>2011</strong> <strong>2011</strong><br />
SD - EN
The photo shows the construction of the<br />
Walney offshore wind farm in the UK.<br />
rEvEnuE<br />
DKK 4.3Bn<br />
6%<br />
EBitDa<br />
DKK 1.8Bn<br />
13%<br />
EmplOyEEs (FTE)<br />
1,219<br />
20%<br />
The percentages indicate the proportion of the<br />
Group that each business area accounted for in <strong>2011</strong>.<br />
<strong>DONG</strong> <strong>Energy</strong> offi ce<br />
Wind farms in operation<br />
Wind farms under<br />
construction<br />
1,025<br />
Capacity<br />
at 31/12/<strong>2011</strong><br />
Present and planned capacity<br />
Existing and planned wind capacity, MW<br />
Offshore wind capacity Onshore wind capacity<br />
Walney 2<br />
92 MW (UK)<br />
2012<br />
92<br />
283 onshore wind turbines<br />
in Denmark<br />
Hydro electric station – partly<br />
owned by <strong>DONG</strong> <strong>Energy</strong><br />
London Array 1<br />
315 MW (UK)<br />
Anholt<br />
200 MW (DK)<br />
Lincs<br />
68 MW (UK)<br />
Demo projects<br />
19 MW (UK/DK)<br />
2013<br />
602<br />
Borkum Riffgrund 1<br />
139 MW (DE)<br />
West of Duddon Sands<br />
194 MW (UK)<br />
2014<br />
333 2,052<br />
For 2012-2014, wind farms for which a fi nal investment decision has been made are shown.<br />
MW denotes <strong>DONG</strong> <strong>Energy</strong>’s proportionate ownership interest.<br />
Electricity generation, TWh<br />
5<br />
4<br />
3<br />
2<br />
1<br />
0<br />
2009<br />
2010<br />
<strong>2011</strong><br />
Expected capacity<br />
at 31/12/2014<br />
<strong>DONG</strong> ENERGY <strong>DONG</strong> ENERGY GROUP <strong>ANNUAL</strong> <strong>REPORT</strong> <strong>2011</strong> – manaGEmEnt’s rEviEw 21<br />
Elproduktion, Elproduktion, TWh TWh
eXPloRatIon<br />
&<br />
theRMal<br />
PRoductIon<br />
PoweR<br />
AT A GLANCE<br />
Transition to greener energy generation<br />
at the power stations<br />
Thermal Power generates electricity and heat from thermal power stations. Most electricity and<br />
heat is generated at central coal-fired, gas-fired and biomass-fired CHP plants in Denmark and at<br />
new gas-fired power stations in Norway, the Netherlands and the UK. In the years to come, it is<br />
expected that coal and gas can largely be replaced by biomass at the Danish power stations. This<br />
will reduce CO emissions significantly for a substantial part of the heat supply in large Danish<br />
2<br />
cities. Work is also in progress to make generation more flexible so that it can be better aligned to<br />
the varying generation by wind turbines.<br />
Biomass is an important resource in the energy system of the future. Based on new refining technologies,<br />
innovative solutions are being developed for efficient and flexible utilisation of waste<br />
and biomass for both energy and other resources, for example nutrients.<br />
Executive Vice President<br />
Thomas Dalsgaard<br />
EP - EN Wind Power - EN Thermal Power - EN <strong>Energy</strong> Markets - EN<br />
22<br />
manaGEmEnt’s rEviEw – <strong>DONG</strong> ENERGY GROUP <strong>ANNUAL</strong> <strong>ANNUAL</strong> <strong>REPORT</strong> <strong>REPORT</strong> <strong>2011</strong> <strong>2011</strong><br />
Read more about Thermal Power:<br />
www.dongenergy.com/EN/Thermal_Power<br />
SD - EN
The photo shows one of the Group’s central<br />
power stations – Skærbæk power station.<br />
rEvEnuE<br />
DKK 10.7Bn<br />
15%<br />
EBitDa<br />
DKK 2.3Bn<br />
17%<br />
EmplOyEEs (FTE)<br />
1,285<br />
21%<br />
The percentages indicate the proportion of the<br />
Group that each business area accounted for in <strong>2011</strong>.<br />
<strong>DONG</strong> <strong>Energy</strong> offi ce<br />
Inbicon bioethanol plant<br />
Central power stations<br />
Electricity generation,<br />
gas-fi red power station<br />
6,000<br />
5,000<br />
4,000<br />
3,000<br />
2,000<br />
1,000<br />
0<br />
2006<br />
Electricity and heat<br />
generation, gas-fi red power<br />
station<br />
A long-term lease has been<br />
entered into with Statoil as<br />
a result of which the plant<br />
is accounted for as held<br />
under a fi nance lease.<br />
Thermal power station capacity by fuel, MW<br />
12<br />
Coal<br />
8<br />
4<br />
0<br />
Oil<br />
Gas<br />
Biomass<br />
<strong>2011</strong><br />
Electricity and heat generation<br />
Waste<br />
Electricity generation, TWh Heat generation, PJ<br />
2015<br />
estimate<br />
TWh PJ<br />
16<br />
56<br />
2009<br />
2010<br />
<strong>2011</strong><br />
42<br />
28<br />
14<br />
0<br />
Zealand<br />
Small-scale CHP plants<br />
On 31/12 <strong>2011</strong>, <strong>DONG</strong><br />
<strong>Energy</strong> was the owner of<br />
nine small-scale and three<br />
waste-fi red CHP plants in<br />
Denmark. Four of the<br />
small-scale CHP plants<br />
were sold on 1/1 2012.<br />
Affald<br />
Biomasse<br />
Gas<br />
Oile<br />
Kul<br />
<strong>DONG</strong> ENERGY <strong>DONG</strong> ENERGY GROUP <strong>ANNUAL</strong> <strong>REPORT</strong> <strong>2011</strong> – manaGEmEnt’s rEviEw 23<br />
Elproduktion,<br />
Varmeproduk
eXPloRatIon<br />
eXPloRatIon<br />
AT A GLANCE<br />
& PRoductIon<br />
eneRgy MaRkets<br />
<strong>Energy</strong> Markets optimises energy flows<br />
<strong>Energy</strong> Markets connects the energy production from wind turbines, power stations and gas fields<br />
with wholesale customers in North West Europe in the most optimum way.<br />
With strong market insight from its experienced employees, <strong>Energy</strong> Markets adds value to energy<br />
flows and secures stable, long-term earnings for the Group by levelling out fluctuations in energy<br />
prices. This also creates optimum conditions for long-term investments in new wind turbines,<br />
power stations and oil and gas fields.<br />
Executive Vice President<br />
Kurt Bligaard Pedersen<br />
Renewables - EN Generation - EN <strong>Energy</strong> Markets - EN<br />
24<br />
manaGEmEnt’s rEviEw – <strong>DONG</strong> ENERGY GROUP <strong>ANNUAL</strong> <strong>ANNUAL</strong> <strong>REPORT</strong> <strong>REPORT</strong> <strong>2011</strong> <strong>2011</strong><br />
Read more about <strong>Energy</strong> Markets:<br />
www.dongenergy.com/EN/EM<br />
SD - EN
Strong market insight from experienced and<br />
talented people is <strong>Energy</strong> Markets’ core asset.<br />
rEvEnuE<br />
DKK 33.7Bn<br />
47%<br />
EBitDa<br />
DKK 2.0Bn<br />
14%<br />
EmplOyEEs (FTE)<br />
330<br />
5%<br />
The percentages indicate the proportion of the<br />
Group that each business area accounted for in <strong>2011</strong>..<br />
<strong>DONG</strong> <strong>Energy</strong> offi ce<br />
Gas pipeline, whollyowned<br />
or partly owned<br />
by <strong>DONG</strong> <strong>Energy</strong><br />
Gas treatment plant<br />
Gas receiving facility<br />
Optimising energy flows<br />
Gas fields Wind turbines<br />
LNG<br />
Gas purchase<br />
agreements<br />
Power stations<br />
Gas storage<br />
facilities<br />
Gas sourcing <strong>2011</strong><br />
9%<br />
17%<br />
Own production<br />
DUC<br />
LNG terminal, partly owned by<br />
<strong>DONG</strong> <strong>Energy</strong><br />
Gas storage facility owned by<br />
<strong>DONG</strong> <strong>Energy</strong>, in operation<br />
Gas storage facility leased by<br />
<strong>DONG</strong> <strong>Energy</strong>, in operation<br />
<strong>Energy</strong> Markets<br />
adds value<br />
by optimising<br />
the connection<br />
between production<br />
and markets<br />
26%<br />
48%<br />
Long-term<br />
contracts<br />
Other<br />
Gas storage facility partly<br />
owned by <strong>DONG</strong> <strong>Energy</strong>, under<br />
construction<br />
Gas sales<br />
122.3 TWh<br />
Wholesale<br />
<strong>Energy</strong> exchange<br />
Stadtwerke Lübeck, partly<br />
owned by <strong>DONG</strong> <strong>Energy</strong><br />
Electricity generation,<br />
gas-fi red power station<br />
Internal sales<br />
Own power stations (Sales & Distribution)<br />
Germany<br />
Denmark<br />
UK<br />
Distribution<br />
companies<br />
<strong>Energy</strong> hubs<br />
and exchanges<br />
Gas sales <strong>2011</strong><br />
17%<br />
22%<br />
<strong>Energy</strong> hub or exchange on<br />
which <strong>Energy</strong> Markets is active<br />
Other wholesale<br />
customers<br />
The Netherlands<br />
Sweden<br />
<strong>DONG</strong> ENERGY <strong>DONG</strong> ENERGY GROUP <strong>ANNUAL</strong> <strong>REPORT</strong> <strong>2011</strong> – manaGEmEnt’s rEviEw 25<br />
3%<br />
35%<br />
23%
eXPloRatIon<br />
& PRoductIon<br />
AT A GLANCE<br />
sales & dIstRIButIon<br />
Efficient and reliable electricity<br />
and gas supply<br />
Sales & Distribution is Denmark’s largest energy supplier and is responsible for efficient and reliable<br />
supply to more than 1.2 million customers in Denmark, the Netherlands and Sweden. Value<br />
is created primarily via the sale of electricity and gas and via operation of distribution networks.<br />
To this should be added development of products and climate-friendly solutions for customers.<br />
Intelligent consumption and production methods of the future (Smart <strong>Energy</strong>) is an important focus<br />
area. With more than 100 climate partnerships, <strong>DONG</strong> <strong>Energy</strong> engages in close dialogue with<br />
large companies, organisations and municipalities on optimising their energy consumption.<br />
The Group is also expanding internationally and acquired the gas trading company Shell Gas<br />
Direct in the UK in the autumn. The acquisition date is 30 April 2012.<br />
Generation - EN <strong>Energy</strong> Markets - EN<br />
Executive Vice President<br />
Lars Clausen<br />
26<br />
manaGEmEnt’s rEviEw – <strong>DONG</strong> ENERGY GROUP <strong>ANNUAL</strong> <strong>ANNUAL</strong> <strong>REPORT</strong> <strong>REPORT</strong> <strong>2011</strong> <strong>2011</strong><br />
SD - EN<br />
Read more about Sales & Distribution:<br />
www.dongenergy.com/EN/SD
The photo shows a meter technician calling<br />
on a customer to replace an electricity meter.<br />
rEvEnuE<br />
DKK 13.0Bn<br />
18%<br />
EBitDa<br />
DKK 2.0Bn<br />
15%<br />
EmplOyEEs (FTE)<br />
1,409<br />
23%<br />
The percentages indicate the proportion of the<br />
Group that each business area accounted for in <strong>2011</strong>.<br />
<strong>DONG</strong> <strong>Energy</strong> offi ce<br />
Oil pipeline owned<br />
by <strong>DONG</strong> <strong>Energy</strong><br />
Gas storage facility<br />
20<br />
15<br />
10<br />
5<br />
0<br />
Oil processing plant<br />
Electricity distribution<br />
Gas distribution<br />
Sales and distribution of electricity and gas, TWh<br />
Gas sales<br />
Gas sales (from 2012)<br />
Gas and electricity sales<br />
25<br />
Elsalg<br />
2009<br />
Electricity sales<br />
Electricity distribution<br />
Gas sales by country in <strong>2011</strong><br />
16%<br />
37%<br />
20.3<br />
TWh<br />
Denmark (public regulation)<br />
Denmark (market terms)<br />
The Netherlands (market terms)<br />
Sweden (market terms)<br />
2010<br />
Gas distribution<br />
9%<br />
38%<br />
<strong>2011</strong><br />
Electricity sales by country in <strong>2011</strong><br />
8%<br />
Holland markedsvilkår<br />
51% DK markedsvilkår<br />
7.6<br />
TWh<br />
DK forsyningspligt<br />
Denmark (public regulation)<br />
Denmark (market terms)<br />
The Netherlands (market terms)<br />
<strong>DONG</strong> ENERGY <strong>DONG</strong> ENERGY GROUP <strong>ANNUAL</strong> <strong>REPORT</strong> <strong>2011</strong> – manaGEmEnt’s rEviEw 27<br />
41%<br />
Gassalg<br />
Eldistribu<br />
Gasdistri
consolIdated RESULTS<br />
Financial performance<br />
BusinEss pErfOrmanCE<br />
As described on pages 33 and 34, <strong>DONG</strong><br />
<strong>Energy</strong> introduced a new business performance<br />
income statement in <strong>2011</strong>. Unless otherwise<br />
stated, the financial results in this review are<br />
based on that. Comments to the balance sheet<br />
are based on the IFRS consolidated balance<br />
sheet. The business performance results have<br />
been adjusted for temporary fluctuations in<br />
the market value of contracts, including hedging<br />
transactions, relating to other periods and<br />
therefore represent the underlying financial<br />
performance of the Group in the reporting<br />
period.<br />
rEsults fOr tHE yEar DEtErminED<br />
in aCCOrDanCE witH ifrs<br />
EBITDA for the year determined in accordance<br />
with IFRS was DKK 15.6 billion versus DKK 14.1<br />
billion in 2010. As described on page 33, with<br />
effect from 1 January <strong>2011</strong>, <strong>DONG</strong> <strong>Energy</strong> discontinued<br />
the application of the provisions on<br />
cash flow hedge accounting for commodities<br />
and related currency exposures. Unlike 2010,<br />
the results for <strong>2011</strong> determined in accordance<br />
with IFRS were therefore affected by unrealised<br />
market value adjustments on such transactions.<br />
As the IFRS results for the two years are therefore<br />
not comparable, no further comments will<br />
be made on the IFRS results.<br />
Oil, USD/bbl<br />
125<br />
120<br />
115<br />
110<br />
105<br />
100<br />
95<br />
90<br />
85<br />
80<br />
75<br />
70<br />
Oil (Brent)<br />
2010<br />
28<br />
manaGEmEnt’s rEviEw – <strong>DONG</strong> ENERGY GROUP <strong>ANNUAL</strong> <strong>ANNUAL</strong> <strong>REPORT</strong> <strong>REPORT</strong> <strong>2011</strong> <strong>2011</strong><br />
<strong>2011</strong><br />
<strong>DONG</strong> <strong>Energy</strong>’s revenue for <strong>2011</strong> was 4% ahead of 2010.<br />
EBITDA was largely in line with 2010, matching the outlook<br />
in the 2010 annual report. Operating cash flows were down,<br />
primarily reflecting an increase in tax paid in Norway.<br />
DKK million <strong>2011</strong> 2010 ∆<br />
Revenue 56,842 54,616 2,226<br />
EBITDA 13,770 14,135 (365)<br />
Cash fl ows<br />
from operating<br />
activities 12,624 14,214 (1,590)<br />
The results for <strong>2011</strong> were affected by falling earnings in<br />
<strong>Energy</strong> Markets due to a lower margin on gas sales, despite<br />
a positive effect from renegotiation of gas contracts. Exploration<br />
& Production, on the other hand, had a positive effect<br />
on the results due to higher production and energy<br />
prices, which were at a significantly higher level, throughout<br />
<strong>2011</strong>, than in 2010.<br />
Market prices<br />
Oil and gas prices<br />
The oil price was 40% higher, on average, than in 2010,<br />
peaking in spring, when the market was affected by the unrest<br />
in the Middle East and North Africa, including the<br />
halting of production in Libya. Higher demand from emerging<br />
markets, including India and China, helped prop up the<br />
oil price.<br />
The gas price remained relatively stable during the<br />
year, with monthly average prices of EUR 22-23/MWh, and<br />
was 31% higher, on average, than in 2010. The gas price<br />
Spread, gas hub price<br />
vs. oil-indexed gas price, EUR/MWh<br />
2<br />
0<br />
-2<br />
-4<br />
-6<br />
-8<br />
Spread, gas hub price TTF vs. oil-indexed gas price BAFA<br />
Olie (Brent)<br />
2010<br />
Source: Calculated by <strong>DONG</strong> <strong>Energy</strong> on the basis of input from Argus and BAFA<br />
<strong>2011</strong><br />
Gasbørspris
monthly average <strong>2011</strong> 2010 ∆<br />
Oil, Brent USD/bbl 111 80 40%<br />
Gas, TTF EUR/MWh 23 17 31%<br />
Gas, NBP EUR/MWh 22 17 31%<br />
Gas/oil spread EUR/MWh (3.2) (3.5) 9%<br />
Electricity,<br />
Nord Pool system EUR/MWh 47 53 (11%)<br />
Electricity, Nord<br />
Pool, DK avg. EUR/MWh 49 52 (6%)<br />
Electricity, EEx EUR/MWh 51 44 15%<br />
Green dark<br />
spread, DK 1 EUR/MWh 5 14 15%<br />
Source: Nord Pool, EEx, Platts, Argus and BAFA.<br />
1 Based on average prices in DK1 and DK2.<br />
was being sustained by the indirect effects of the earthquake<br />
in Japan, including the phasing out of nuclear<br />
power stations in Germany, and the interruption of gas<br />
production in Libya. The European natural gas markets<br />
were generally well supplied in <strong>2011</strong>, which was part of the<br />
reason why gas hub prices remained significantly lower<br />
than the oil-indexed gas prices. This price spread had an<br />
adverse effect on earnings from gas trading. By contrast,<br />
the rising oil and gas prices had a positive effect on<br />
earnings from oil and gas production.<br />
Electricity prices and green dark spread<br />
The average electricity price in the two Danish price areas,<br />
DK1 and DK2, was EUR 49/MWh in <strong>2011</strong>, a decrease of 6%<br />
on 2010. The hydrological balance was low at the start of<br />
<strong>2011</strong>, and the year began with a cold, dry winter. It ended<br />
Gas, EUR/MWh<br />
26<br />
24<br />
22<br />
20<br />
18<br />
16<br />
14<br />
12<br />
10<br />
Source: Argus<br />
Gas (TTF) Gas (NBP)<br />
2010<br />
<strong>2011</strong><br />
with a high hydrological balance and a mild, wet autumn<br />
and winter. Consequently, electricity prices were relatively<br />
high at the start of the year, following which they dropped<br />
to a lower level.<br />
Due to the high hydrological balance of almost 10 TWh<br />
above the normal level, the Nord Pool electricity price was<br />
significantly lower than the German EEx electricity price<br />
from September, helping drive Danish electricity prices<br />
down. At the same time, higher electricity generation from<br />
wind farms in the North Sea put downward pressure on<br />
and led to higher fluctuations in the electricity price.<br />
The green dark spread in Denmark showed a downward<br />
trend throughout <strong>2011</strong>, from approx. EUR 7/MWh at the<br />
start of the year to around EUR 0/MWh in autumn, after<br />
which it increased slightly again. The sharp decrease in the<br />
CO price from the middle of the year had a positive effect<br />
2<br />
on the spread at the end of <strong>2011</strong>. It averaged EUR 5/MWh,<br />
EUR 9/MWh less than in 2010.<br />
Hydrological balance, TWh<br />
20<br />
10<br />
0<br />
-10<br />
-20<br />
-30<br />
-40<br />
-50<br />
2010 <strong>2011</strong><br />
Range 2003-2010<br />
Q1<br />
Q2<br />
Source: SKM Market Predictor<br />
80<br />
70<br />
60<br />
50<br />
40<br />
30<br />
20<br />
10<br />
0<br />
-10<br />
GlOssary<br />
Reference is made to the glossary on<br />
pages 127-128 188-189 for definitions of terms.<br />
Gas (NBP)<br />
Gas (TTF)<br />
2010<br />
Median 2003-2010<br />
Electricity and green dark spread (GDS), EUR/MWh<br />
Electricity (Nord Pool, DK)<br />
Source: Nord Pool, Argus and ECX<br />
Q3<br />
<strong>2011</strong><br />
Q4<br />
GDS (Nord Pool, DK)<br />
<strong>DONG</strong> ENERGY <strong>DONG</strong> ENERGY GROUP <strong>ANNUAL</strong> <strong>REPORT</strong> <strong>2011</strong> – manaGEmEnt’s rEviEw 29<br />
2010<br />
<strong>2011</strong><br />
Median 2<br />
GDS (Nord P<br />
El (Nord Poo
consolIdated RESULTS<br />
Revenue<br />
DKK million <strong>2011</strong> 2010 ∆<br />
Revenue 56,842 54,616 2,226<br />
Revenue was DKK 56.8 billion in <strong>2011</strong>, up from DKK 54.6<br />
billion in 2010. The 4% increase reflected higher oil and<br />
gas production and higher energy prices.<br />
Oil and gas production was 26.4 million boe, up from<br />
24.4 million boe in 2010, primarily reflecting the start-up of<br />
production at Trym and higher production from Ormen<br />
Lange.<br />
Electricity generation was 20.3 TWh, in line with 2010.<br />
Generation benefited from higher generation from the gasfired<br />
Severn power station in the UK, which was brought<br />
fully on stream at the end of 2010, higher generation from<br />
wind farms becoming operational in 2010, and generation<br />
from new wind farms in <strong>2011</strong>. By contrast, thermal electricity<br />
and heat generation in Denmark decreased due to<br />
milder weather in the first quarter of <strong>2011</strong> compared with<br />
the same period in 2010.<br />
Gas sales (excluding own consumption at power stations)<br />
were up 7% at 115.6 TWh in <strong>2011</strong>, mainly reflecting higher<br />
gas hub sales. The increase was partly offset by lower wholesale<br />
sales in Sweden due to expired contracts and lower sales<br />
in the Danish market due to a lower market share.<br />
EBITDA<br />
DKK million <strong>2011</strong> 2010 ∆<br />
Exploration &<br />
Production 5,684 5,051 633<br />
Wind Power 1,799 1,730 69<br />
Thermal Power 2,255 2,228 27<br />
<strong>Energy</strong> Markets 1,963 2,959 (996)<br />
Sales &<br />
Distribution 2,027 2,036 (9)<br />
Other activities/<br />
eliminations 42 131 (89)<br />
Consolidated<br />
EBitDa 13,770 14,135 (365)<br />
EBITDA was DKK 13.8 billion in <strong>2011</strong> against DKK 14.1 billion<br />
in 2010. The decrease of 3% can be broken down by<br />
business area as follows:<br />
• in Exploration & Production, EBITDA was up DKK 0.6<br />
billion at DKK 5.7 billion due to higher oil and gas prices<br />
and higher production, partly offset by higher costs for<br />
exploration and for repair of the Siri platform<br />
• in Wind Power, EBITDA was DKK 0.1 billion ahead at<br />
DKK 1.8 billion in <strong>2011</strong>, driven by higher revenue,<br />
whereas higher costs due to higher operating activity<br />
and development of the business area had an adverse<br />
impact on EBITDA<br />
• in Thermal Power, EBITDA was DKK 2.3 billion, in line<br />
with 2010. The positive effect from the new gas-fired<br />
30<br />
manaGEmEnt’s rEviEw – <strong>DONG</strong> ENERGY GROUP <strong>ANNUAL</strong> <strong>ANNUAL</strong> <strong>REPORT</strong> <strong>REPORT</strong> <strong>2011</strong> <strong>2011</strong><br />
power stations outside Denmark that became operational<br />
at the end of 2010 and higher sales of system services,<br />
etc., was partly offset by lower electricity and heat<br />
generation in Denmark due to milder weather and a significantly<br />
lower green dark spread<br />
• in <strong>Energy</strong> Markets, EBITDA was down DKK 1.0 billion at<br />
DKK 2.0 billion, primarily reflecting lower earnings from<br />
gas sales under fixed-price and oil-indexed contracts.<br />
Renegotiation of gas contracts had a significant positive<br />
effect of around DKK 1 billion in <strong>2011</strong>. The new gas-fired<br />
power stations adversely affected EBITDA due to low<br />
green spark spreads. The effect on consolidated EBITDA<br />
from the new gas-fired power stations was neutral<br />
• in Sales & Distribution, EBITDA remained unchanged at<br />
DKK 2.0 billion. Lower revenue from gas sales was offset<br />
by a lower cost level.<br />
Depreciation, amortisation, impairment<br />
losses and EBIT<br />
DKK million <strong>2011</strong> 2010 ∆<br />
Depreciation, amortisation<br />
and impairment<br />
losses 7,670 6,015 1,655<br />
EBIT 6,100 8,120 (2,020)<br />
Depreciation, amortisation and impairment losses<br />
amounted to DKK 7.7 billion, an increase of DKK 1.7 billion<br />
on 2010. The increase reflected new assets in operation and<br />
higher impairment losses. The impairment losses in <strong>2011</strong><br />
were made up of DKK 0.6 billion on the offshore gas pipelines<br />
from the North Sea to Denmark due to an officially instigated<br />
transmission tariff reduction and DKK 0.3 billion on<br />
goodwill due to changed pricing in the Dutch market.<br />
EBIT was consequently DKK 6.1 billion compared with<br />
DKK 8.1 billion in 2010. The DKK 2.0 billion decrease was<br />
made up of a DKK 0.3 billion decrease in EBITDA and, as<br />
mentioned above, a DKK 1.7 billion increase in depreciation,<br />
amortisation and impairment losses.<br />
Gain (loss) on disposal of enterprises<br />
Disposals of enterprises generated a gain of DKK 0.2 bil-<br />
lion against DKK 0.9 billion in 2010 and related mainly to a<br />
purchase price adjustment from the sale of the Spanish<br />
and Portuguese wind activities (Energi E2 Renewables<br />
Ibericas S.L.) in 2007.<br />
Net finance costs<br />
DKK million <strong>2011</strong> 2010 ∆<br />
Interest expense, net (642) (1,218) 576<br />
Interest element of<br />
decommissioning<br />
obligations (176) (196) 20<br />
Other, net 536 (181) 717<br />
net fi nance costs (282) (1,595 ) 1,313
Net finance costs amounted to DKK 0.3 billion compared<br />
with DKK 1.6 billion in 2010. Net interest expense was cut<br />
by half to DKK 0.6 billion in <strong>2011</strong>, reflecting partly the<br />
falling interest rate level, which led to lower interest expense<br />
as a large proportion of the loan portfolio was converted<br />
to floating-rate loans through <strong>2011</strong>, and partly<br />
higher interest income from business partners and a finance<br />
lease. The conversion of the loan portfolio has now<br />
been terminated against the background of the falling interest<br />
rate level, and the loan portfolio now again consists<br />
primarily of fixed-interest rate loans.<br />
Other finance costs amounted to income of DKK 0.5 billion<br />
net and related partly to positive capital gains on the<br />
bond portfolio due to the falling interest rate level, and<br />
partly to foreign exchange adjustments related to rising<br />
USD and GBP exchange rates in the second half. This had a<br />
positive net effect on cash and cash equivalents, margin accounts,<br />
receivables and trade payables.<br />
Income tax<br />
Tax on profit for the year was an expense of DKK 3.2 billion<br />
versus DKK 3.0 billion in 2010. The tax rate was 53%<br />
against 40% in 2010. The increase mainly reflected the fact<br />
that earnings in Norway, where hydrocarbon income is<br />
taxed at 78%, represented a larger portion of total earnings<br />
than in 2010.<br />
Total tax contribution<br />
<strong>DONG</strong> <strong>Energy</strong>’s contribution to society in the form of direct<br />
and indirect taxes relating to its activities has been determined<br />
Total taxes using (TTC-model)<br />
the TCC (Total Tax Contribution) model.<br />
10%<br />
1%<br />
8%<br />
22%<br />
17.6<br />
DKK billion<br />
59%<br />
<strong>Energy</strong> taxes, etc.<br />
VAT, etc.<br />
PAYE tax, etc.<br />
Property taxes, etc.<br />
Income tax<br />
The total contribution to society for <strong>2011</strong> was DKK 17.6 billion,<br />
of which 94% (DKK 16.6 billion) accrued to the Danish<br />
State in the form of direct taxes, energy taxes, value<br />
added tax, PAYE tax, etc.<br />
Profit for the year and dividends<br />
DKK million <strong>2011</strong> 2010 ∆<br />
Profi t for the year 2,882 4,499 (1,617)<br />
Profit for the year was DKK 2.9 billion, down DKK 1.6 billion<br />
on 2010, primarily reflecting a lower gain on disposal of enterprises<br />
and an increase in tax paid in Norway.<br />
The Board of Directors will recommend at the AGM that<br />
a dividend of DKK 4.96 per share be paid for <strong>2011</strong> (2010:<br />
DKK 7.50 per share). This provides dividend of DKK 1.5 billion<br />
(2010: DKK 2.2 billion), equivalent to 60% of profit for<br />
the year, less coupon after tax to hybrid capital holders and<br />
non-controlling interests’ share of profit for the year.<br />
Cash flows from operating activities<br />
DKK million <strong>2011</strong> 2010 ∆<br />
Cash fl ows from<br />
operating activities 12,624 14,214 (1,590)<br />
Cash inflow from operating activities decreased by DKK 1.6<br />
billion to DKK 12.6 billion in <strong>2011</strong>, principally due to an increase<br />
in tax paid in Norway. Having the opposite effect<br />
were lower paid net finance costs and realised gains on<br />
hedging of net investments in foreign subsidiaries compared<br />
with a realised loss in 2010.<br />
Investments<br />
DKK million <strong>2011</strong> 2010 ∆<br />
Gross investments<br />
Disposals of<br />
assets and<br />
(18,451) (15,692) (2,759)<br />
enterprises 1,981 3,217 (1,236)<br />
Transactions with<br />
non-controlling<br />
interests 3,410 3,945 (535)<br />
net investments (13,060) (8,530) (4,530)<br />
For a more detailed breakdown of investments, reference is made to the<br />
statement of cash fl ows on page 67.<br />
Net investments were DKK 13.1 billion against DKK 8.5 billion<br />
in 2010 and consisted of gross investments of DKK 18.5<br />
billion Selskabsskat and sale of assets and companies and transactions<br />
with non-controlling Ejendomsskatter mv. interests amounting to DKK 5.4 billion.<br />
The Indeholdt main a-skat mv. gross investments in new activities, expansion<br />
of Moms existing mv. areas of activity and efficiency improvement<br />
and renewal of existing facilities in <strong>2011</strong> were:<br />
Energi afgifter mv.<br />
• expansion of wind activities (DKK 10.9 billion), including<br />
the UK offshore wind farms Walney (DKK 4.8 billion),<br />
London Array (DKK 3.6 billion) and Lincs (DKK 0.9 billion),<br />
the Danish offshore wind farm Anholt (DKK 0.2 billion)<br />
and the German offshore wind farm Borkum<br />
Riffgrund 1 (DKK 0.2 billion)<br />
• development of oil and gas fields and infrastructure (DKK<br />
5.6 billion), including the Norwegian gas fields Oselvar<br />
(DKK 1.0 billion), Marulk (DKK 0.5 billion), Ormen Lange<br />
(DKK 0.5 billion) and Trym (DKK 0.4 billion), UK Laggan-<br />
Tormore (DKK 0.9 billion) and the Syd Arne field in Denmark,<br />
primarily from phase three (DKK 0.7 billion)<br />
• thermal activities (DKK 0.7 billion), including the construction<br />
of the gas-fired Enecogen power station in the<br />
Netherlands (DKK 0.4 billion)<br />
• underground installation of power cables in North Zealand<br />
and other capital expenditure in the electricity<br />
distribution network in Denmark (DKK 0.5 billion)<br />
Disposals represented mainly transmission assets related<br />
to the Barrow, Walney 1 and Gunfleet Sands wind farms<br />
and transactions with non-controlling interests, including<br />
the disposal of 49.9% of Gunfleet Sands, capital contributions<br />
in respect of Walney and an adjustment to the selling<br />
price for accounting purposes of Walney.<br />
<strong>DONG</strong> ENERGY <strong>DONG</strong> ENERGY GROUP <strong>ANNUAL</strong> <strong>REPORT</strong> <strong>2011</strong> – manaGEmEnt’s rEviEw 31
consolIdated RESULTS<br />
Cash flows from financing activities<br />
DKK million <strong>2011</strong> 2010 ∆<br />
Cash fl ows from<br />
fi nancing activities 4,918 1,122 3,796<br />
Cash flows from financing activities were DKK 4.9 billion<br />
compared with DKK 1.1 billion in 2010. The positive effect<br />
was primarily attributable to transactions with non-controlling<br />
interests (including a reduction in interest-bearing<br />
balances from previous years) of DKK 3.9 billion. To this<br />
should be added a net effect from the issuing and partial<br />
repurchase of hybrid capital in January <strong>2011</strong> of DKK 1.3 billion<br />
and the raising of DKK 1.5 billion short-term debt (repo<br />
transactions) and DKK 1.0 billion long-term debt for partial<br />
financing of the Danish offshore wind farm Anholt.<br />
Dividend paid to shareholders was DKK 2.2 billion and<br />
coupon to hybrid capital holders DKK 0.5 billion.<br />
Balance sheet<br />
DKK million <strong>2011</strong> 2010 ∆<br />
Assets 154,073 137,339 16,734<br />
Interest-bearing<br />
net debt 23,615 22,139 1,476<br />
Equity 57,740 51,308 6,432<br />
The balance sheet total increased by DKK 16.7 billion to<br />
DKK 154.1 billion at the end of <strong>2011</strong>. The increase primarily<br />
reflected <strong>DONG</strong> <strong>Energy</strong>’s continued investment activities<br />
in wind farms and oil and gas fields.<br />
Net interest-bearing debt increased by DKK 1.5 billion<br />
only, amounting to DKK 23.6 billion at the end of <strong>2011</strong>, as<br />
cash outflow from investing activities was largely financed by<br />
cash inflow from operating activities and disposals.<br />
Equity increased by DKK 6.4 billion, standing at DKK 57.7<br />
billion at the end of <strong>2011</strong>. The increase was primarily driven by<br />
profit for the year of DKK 2.9 billion, the issuing of hybrid capital<br />
in January <strong>2011</strong> with a net effect of DKK 1.3 billion and<br />
transactions with non-controlling interests amounting to DKK<br />
4.0 billion, while dividend paid and coupon payments to hybrid<br />
capital holders had an adverse effect on equity.<br />
32<br />
manaGEmEnt’s rEviEw – <strong>DONG</strong> ENERGY GROUP <strong>ANNUAL</strong> <strong>ANNUAL</strong> <strong>REPORT</strong> <strong>REPORT</strong> <strong>2011</strong> <strong>2011</strong><br />
Return on capital employed (ROCE)<br />
DKK million <strong>2011</strong> 2010<br />
Operating profi t (EBIT) 6,100 8,120<br />
Share of profi t of associates 36 77<br />
Hydrocarbon tax (1,516) (1,017)<br />
Interest element of<br />
decommissioning obligations (176) (196)<br />
adjusted operating profi t 4,444 6,985<br />
Non-interest-bearing assets 136,728 121,082<br />
Non-interest-bearing liabilities (55,373) (47,634)<br />
Capital employed 81,355 73,448<br />
Property, plant and equipment under<br />
construction (23,037) (19,145)<br />
Exploration assets (1,611) (975)<br />
Production assets transferred from<br />
property, plant and equipment under<br />
construction in the past six months (6,517) (7,022)<br />
adjusted capital employed 50,190 46,306<br />
Return on capital employed (ROCE), % 5.7 9.6<br />
Adjusted return on capital employed, % 9.2 15.1<br />
The return on capital employed was 5.7% in <strong>2011</strong> versus<br />
9.6% in 2010, while the adjusted return on capital employed<br />
was 9.2% in <strong>2011</strong> versus 15.1% in 2010. The return<br />
on capital employed is calculated on the basis of operating<br />
assets, defined as non-interest-bearing net assets. Adjusted<br />
return on capital employed has been calculated by also deducting<br />
the cost of assets under construction and exploration<br />
assets as well as production assets transferred from assets<br />
under construction in the six months preceding the<br />
balance sheet date. The reason for this is to take account of<br />
the fact that earnings are limited during the start-up phase<br />
in connection with the start-up of operation of an asset.<br />
Capital structure<br />
Adjusted net debt amounted to 2.0 times cash flows from<br />
operating activities at the end of <strong>2011</strong>. This was on a par with<br />
2010 and significantly below the target of adjusted net debt<br />
not exceeding 3.0 times cash flows from operating activities.<br />
The financial key ratio for capital structure will be<br />
changed, from and including 2012, with EBITDA replacing<br />
cash flows from operating activities in the denominator.<br />
The change is being made to link the capital structure target<br />
to EBITDA, which is <strong>DONG</strong> <strong>Energy</strong>’s overall performance<br />
measure, and which, following the introduction of<br />
business performance results, better represents the<br />
Group’s underlying financial performance. This financial<br />
key ratio stood at 1.9 times at the end of <strong>2011</strong>, which was<br />
also on a par with 2010.<br />
Further information on the capital structure can be<br />
found in the chapter Financial outlook for 2012.
New presentation of profit for the year<br />
focusing on business performance<br />
<strong>DONG</strong> <strong>Energy</strong> has expanded its business activities in several<br />
energy markets in recent years. As a result, the Group<br />
has adopted a more active risk management approach in<br />
some areas in order to enhance value creation and create a<br />
greater degree of certainty with respect to the Group’s financial<br />
position.<br />
This is achieved by hedging all or part of the value of<br />
the Group’s production and purchases and sales of energy<br />
to avoid performance being affected by unfavourable<br />
movements in market prices.<br />
As a hedging instrument that precisely matches the underlying<br />
commercial exposure (production or trading) or is<br />
sufficiently liquid is not always available, the Group uses<br />
approximation hedging, to some extent, i.e. hedging in alternative<br />
markets or with different time frames. For example,<br />
Danish electricity generation is, to some extent,<br />
hedged using financial contracts for the EEx and Nord Pool<br />
areas, as these prices normally move uniformly over time.<br />
Accordingly, only a portion of the Group’s economic<br />
hedging meets the IFRS criteria for cash flow hedge accounting,<br />
even though they have been entered into precisely<br />
for this purpose. If the criteria are not satisfied, the<br />
hedging transactions must be market value adjusted on a<br />
continuous basis, which may give rise to large fluctuations<br />
in the income statement, regardless of the fact that the<br />
hedging transactions have reduced the financial risk.<br />
With effect from 1 January <strong>2011</strong>, the Group therefore<br />
changed the way in which it accounts for derivative financial<br />
instruments used to hedge future cash flows relating<br />
to commodities and related currency exposures, so that<br />
these are no longer classified as hedge accounting.<br />
Instead, an alternative performance measure, business<br />
performance, has been introduced to ensure greater transparency<br />
in the financial reporting. In the income statement,<br />
the business performance results are shown in connection<br />
with the results determined in accordance with<br />
IFRS. The difference between the two performance<br />
measures is shown as adjustments.<br />
Connection between these performance measures<br />
The business performance results reflect the internal<br />
management of the Group. The results have been adjusted<br />
for temporary fluctuations in the market value of contracts,<br />
including hedging transactions relating to other periods.<br />
The financial effect of this hedging is therefore recognised<br />
in the income statement in the same period as the hedged<br />
commercial exposure. This way, the business performance<br />
income statement better represents the underlying financial<br />
performance of the Group during the period.<br />
In future, hedging transactions relating to the commercial<br />
exposures referred to above will be recognised at fair<br />
value with value adjustment via the income statement in<br />
the IFRS financial statements, regardless of the period to<br />
which they relate. As <strong>DONG</strong> <strong>Energy</strong> enters into hedging<br />
transactions with terms of up to five years, this may have a<br />
major impact on the results for individual reporting periods.<br />
The timing differences relating to movements in the market<br />
value of contracts, including hedging transactions that are<br />
deferred to the period in which they are to be recognised, are<br />
shown as an adjustment between the performance measures.<br />
These adjustments will accumulate to nil over time.<br />
The accounting treatment of trading activities remains<br />
unchanged compared with previous periods so that market<br />
value adjustments of these transactions are recognised in<br />
the period in which the change in value occurs and with the<br />
same effect on the IFRS and business performance results.<br />
Unless otherwise stated, Management’s review comments<br />
on the business performance results.<br />
physical electricity and gas contracts<br />
As part of its overall risk management, the Group enters<br />
into fixed-price contracts on purchase and sale of physical<br />
electricity and gas on exchanges and hubs with a view to<br />
mitigate risk related to future settlement prices. The Group<br />
also enters into fixed-price contracts with customers in the<br />
course of its commercial activities.<br />
Under IFRS, these contracts must, as a rule, be classified<br />
as financial contracts with continuous market value adjustment<br />
in the income statement, if a liquid market exists<br />
in which the underlying commercial exposure (production,<br />
purchase or sale) can be traded. If this is not the case, the<br />
financial effect of the contracts will not be recognised until<br />
the reporting period in which the commercial exposure is<br />
realised (accrual accounting).<br />
Physical fixed-price electricity and gas contracts will, in<br />
future, be recognised in the business performance results in<br />
the period in which the hedged exposure is realised, regardless<br />
of whether the market is liquid or illiquid.<br />
As the Group’s risk management comprises both financial<br />
and physical fixed-price contracts, these are reported<br />
on collectively as hedging transactions.<br />
Difference in EBitDa for <strong>2011</strong> between<br />
business performance and ifrs<br />
The difference between the business performance and<br />
IFRS results affects both revenue and cost of sales. In <strong>2011</strong>,<br />
the difference in EBITDA was DKK 1.8 billion.<br />
EBitDa, DKK million <strong>2011</strong><br />
Business performance 13,770<br />
Initial recognition of certain physical fi xedprice<br />
electricity and gas contracts for delivery<br />
in other periods (1,817)<br />
Market value adjustments for the period of<br />
fi nancial and physical hedging contracts<br />
relating to other periods 3,267<br />
Deferred losses/gains relating to fi nancial and<br />
physical hedging contracts where the hedged<br />
production or trading is recognised in the period<br />
under review 375<br />
total adjustments 1,825<br />
Of which recognised in revenue 1,595<br />
ifrs 15,595<br />
<strong>DONG</strong> ENERGY <strong>DONG</strong> ENERGY GROUP <strong>ANNUAL</strong> <strong>REPORT</strong> <strong>2011</strong> – manaGEmEnt’s rEviEw 33
consolIdated RESULTS<br />
A large portion of the difference was due to the discontinuation<br />
of hedge accounting for commodities and related<br />
currency exposures and initial recognition of certain fixedprice<br />
contracts. This part of the difference would consequently<br />
not have arisen if the existing classification had<br />
been retained.<br />
initial recognition of certain contracts<br />
Based on the development in the European energy markets,<br />
including increased liquidity and trading in the markets,<br />
certain physical electricity and gas contracts that<br />
have not previously been fair value adjusted in the financial<br />
statements are now classified as financial contracts.<br />
The market value of these contracts at 1 January <strong>2011</strong> was<br />
therefore recognised in the income statement in the IFRS<br />
financial statements.<br />
As these contracts had not been realised at the start of<br />
the year, and therefore should not affect the business performance<br />
results, they were recognised in the adjustment<br />
between the two performance measures and will continue<br />
to be recognised in this adjustment until they are realised.<br />
The market value of these contracts was negative with<br />
DKK 1.8 billion at 1 January <strong>2011</strong>. The contracts related primarily<br />
to net forward sales of gas on the Dutch TTF gas<br />
hub at fixed prices with a view to reducing the Group’s exposure<br />
to the price development and electricity sales in<br />
Denmark at fixed prices at auction (terms of up to three<br />
years). These sales form an integral part of the hedging of<br />
the Danish thermal electricity generation.<br />
The negative market value reflected the fact that the<br />
electricity and gas were sold at prices below the forward<br />
prices at the start of <strong>2011</strong>.<br />
market value adjustments relating to other periods<br />
The IFRS results include a DKK 3.3 billion market value adjustment<br />
of financial and physical hedging contracts, as the<br />
value of these hedging transactions is not to be recognised in<br />
the business performance results until subsequent periods.<br />
34<br />
manaGEmEnt’s rEviEw – <strong>DONG</strong> ENERGY GROUP <strong>ANNUAL</strong> <strong>ANNUAL</strong> <strong>REPORT</strong> <strong>REPORT</strong> <strong>2011</strong> <strong>2011</strong><br />
The positive market value adjustment related primarily to a<br />
positive effect from hedging of electricity and gas at higher<br />
prices and USD at a lower exchange rate than the respective<br />
market prices at 31 December <strong>2011</strong>.<br />
A large portion of the market value adjustment in the<br />
IFRS results reflected the discontinuation of hedge accounting<br />
for commodities and related exposures as well as<br />
initial recognition of certain fixed-price contracts, and<br />
therefore would not have affected the income statement if<br />
the existing classification had been retained.<br />
Deferred losses/gains<br />
Lastly, deferred losses and gains on financial and physical<br />
hedging transactions from previous periods have been<br />
recognised where the commercial exposure (production,<br />
purchase or sale) has been recognised in <strong>2011</strong>.<br />
The positive effect of DKK 0.4 billion reflected a loss in<br />
the IFRS results in previous years that is to be recognised<br />
as a loss in the business performance results in <strong>2011</strong>.<br />
The loss for recognition in the business performance results<br />
related primarily to higher electricity prices in <strong>2011</strong><br />
than at the dates of the hedging. The loss were partly offset<br />
by a gain on gas hedging.<br />
Cash flows and equity<br />
The new presentation of the results has not had any effect<br />
on the Group’s cash flows from operating activities. It has<br />
simply resulted in a redistribution between the “EBITDA”<br />
and “other adjustments” items, equivalent to the difference<br />
between the market value adjustments.<br />
The new presentation has not had any effect on the<br />
Group’s total equity.
Non-financial performance<br />
The Group’s non-financial performance highlights are set<br />
out on page 6 and commented on here and on page<br />
7. For a detailed description, reference is made to the<br />
Group’s verified GRI reporting and the responsibility part<br />
of dongenergy.com.<br />
Environment<br />
EU ETS CO 2 emissions<br />
<strong>2011</strong> 2010<br />
million<br />
tonnes 10.8 11.8<br />
CO 2 emissions per energy<br />
unit generated<br />
(electricity and heat) g/kWh 486 524<br />
Green proportion of electricity<br />
and heat generation % 29 30<br />
Power station EU ETS CO emissions totalled 10.8 million<br />
2<br />
tonnes in <strong>2011</strong> compared with 11.8 million tonnes in 2010.<br />
In <strong>2011</strong>, the downward trend in CO emissions per kWh<br />
2<br />
generated continued as a result of lower consumption of<br />
coal and increased wind generation. CO emissions per<br />
2<br />
electricity and gas energy unit generated were 486 g/kWh<br />
in <strong>2011</strong> against 524 g/kWh in 2010.<br />
Green electricity and heat generation accounted for 29%<br />
versus 30% in 2010. The marginal decline was due to higher<br />
generation from new gas-fired power stations, which was<br />
only partly offset by higher generation from wind farms.<br />
Health and safety<br />
<strong>2011</strong> 2010<br />
Lost time injuries number 74 93<br />
Lost time injury<br />
frequency (LTIF)<br />
per one million<br />
hours worked 4.1 4.6<br />
Fatalities number 3 3<br />
Health and safety factors form part of the ambition to<br />
operate the company responsibly and have committed and<br />
highly skilled employees.<br />
There were 74 lost time injuries in <strong>2011</strong>, including 40<br />
among suppliers. Converted to lost time injuries per one<br />
million hours worked (LTIF), the total number of injuries at<br />
<strong>DONG</strong> <strong>Energy</strong> and the Group’s suppliers fell from 4.6 in<br />
2010 to 4.1 in <strong>2011</strong>, the lowest ever in <strong>DONG</strong> <strong>Energy</strong>’s history.<br />
The injury frequency target set for <strong>2011</strong> was 5.2. For<br />
2012, the target has been tightened to 4.1, equivalent to<br />
the level achieved in <strong>2011</strong>.<br />
In <strong>2011</strong>, there were two tragic incidents in which three<br />
persons lost their lives. Onboard a coal tanker, two persons<br />
died when they entered an area below deck where there<br />
was no oxygen. At a construction site, a subcontractor employee<br />
died during a fire in a tower. <strong>DONG</strong> <strong>Energy</strong> takes<br />
these accidents very seriously and has stepped up preventive<br />
action.<br />
In <strong>2011</strong>, the Group continued its efforts to develop a<br />
strong safety culture focusing on risk assessment and proactive<br />
prevention as well as follow-up on all incidents to<br />
continuously improve safety performance at both <strong>DONG</strong><br />
<strong>Energy</strong> and its contractors and partners.<br />
<strong>DONG</strong> ENERGY <strong>DONG</strong> ENERGY GROUP <strong>ANNUAL</strong> <strong>REPORT</strong> <strong>2011</strong> – manaGEmEnt’s rEviEw 35
ReVIew of BusIness aReas’ PERFORMANCE<br />
Performance<br />
The financial and environmental performance of each of<br />
the Group’s five business areas in <strong>2011</strong> is commented on in<br />
the following.<br />
Exploration & Production<br />
performance highlights <strong>2011</strong> 2010<br />
Volumes<br />
Oil and gas production million boe 26.4 24.4<br />
- oil million boe 9.3 9.0<br />
- gas<br />
Financial performance<br />
million boe 17.1 15.4<br />
Revenue DKK million 10,469 8,264<br />
EBITDA<br />
EBITDA adjusted<br />
DKK million 5,684 5,051<br />
for hydrocarbon tax DKK million 4,208 4,085<br />
EBIT DKK million 3,204 3,101<br />
Adjusted operating<br />
profi t DKK million 1,628 2,036<br />
Gross investments DKK million (5,626) (4,023)<br />
Capital employed<br />
Capital employed DKK million 18,186 17,122<br />
PPE under construction DKK million (8,381) (6,357)<br />
Exploration assets<br />
Production assets<br />
transferred from PPE<br />
under construction in<br />
DKK million (1,611) (975)<br />
the past six months DKK million (335) (417)<br />
Adjusted capital<br />
employed DKK million 7,859 9,373<br />
Environment<br />
EU ETS CO2 emissions<br />
million<br />
tonnes 0.1 0.1<br />
Gas fl aring million Nm 3 8 32<br />
Oil discharged to sea tonnes 16 8<br />
Reinjection of<br />
produced water on<br />
production platforms % 68 78<br />
volumes<br />
Oil and gas production was up 8% at 26.4 million boe in <strong>2011</strong>.<br />
Oil production was 3% ahead at 9.3 million boe, primarily<br />
due to the start-up of production at the Trym oil and<br />
gas field. Production from Siri was lower due its periodical<br />
closure as a result of tightened safety precautions while the<br />
platform is being repaired.<br />
Gas production, which came primarily from the Ormen<br />
Lange field in Norway, rose by 11% to 17.1 million boe in <strong>2011</strong>,<br />
representing 65% of total production. 18% of production<br />
came from Danish fields and 82% from Norwegian fields.<br />
financial performance<br />
Revenue was DKK 10.5 billion, DKK 2.2 billion ahead of<br />
2010. Revenue benefited from the higher oil and gas prices<br />
and higher production. Oil price hedging had a negative<br />
impact due to the higher oil prices.<br />
EBITDA increased by DKK 0.6 billion to DKK 5.7 billion in<br />
<strong>2011</strong>, primarily due to the increase in revenue, which was<br />
partly offset by higher exploration costs. Costs for the repair<br />
of the subsea structure at the Siri platform were<br />
DKK 0.8 billion in <strong>2011</strong>, of which DKK 0.6 billion related to<br />
the permanent repair solution. The repair work on the Siri<br />
platform is expected to be completed in 2013.<br />
EBIT was up DKK 0.1 billion on 2010, which was less<br />
than the increase in EBITDA as a result of higher depreciation<br />
in Norway, primarily reflecting the start-up of production<br />
at Trym.<br />
Environment<br />
Discharges of oil to sea together with produced water<br />
from the oil and gas exploration activities amounted to<br />
16 tonnes in <strong>2011</strong> against 8 tonnes in 2010. The increase<br />
mainly reflected significantly higher volumes of produced<br />
water at the older Norwegian fields Ula and Gyda, as a<br />
natural outcome of their production patterns.<br />
On the Siri platform, which is operated by <strong>DONG</strong><br />
<strong>Energy</strong>, 2.2 tonnes of oil was discharged, compared with<br />
2.7 tonnes in 2010. The reduction primarily reflected an<br />
unchanged cleaning efficiency and increased reinjection of<br />
produced water into the reservoir.<br />
Reinjection of oil-containing produced water was reduced to<br />
68%, overall, compared with 78% in 2010, while reinjection<br />
from the Siri platform improved from 94% to 97% in <strong>2011</strong>.<br />
<strong>DONG</strong> <strong>Energy</strong>’s share of gas flaring on the Siri platform<br />
was 3 million Nm3 in <strong>2011</strong>, matching the 2009 level, which<br />
led to a decrease in EU ETS CO emissions. The unusually<br />
2<br />
high level of gas flaring on the Siri platform in 2010, 29<br />
million Nm3 , was due to challenges related to treatment of<br />
the gas from the new satellite platform Nini Øst, which is<br />
connected to the Siri platform.<br />
Wind Power<br />
36<br />
manaGEmEnt’s rEviEw – <strong>DONG</strong> ENERGY GROUP <strong>ANNUAL</strong> <strong>ANNUAL</strong> <strong>REPORT</strong> <strong>REPORT</strong> <strong>2011</strong> <strong>2011</strong><br />
performance highlights <strong>2011</strong> 2010<br />
Volumes<br />
Electricity generation,<br />
wind and hydro TWh 4.4 4.0<br />
Financial performance<br />
Revenue DKK million 4,312 2,952<br />
EBITDA DKK million 1,799 1,730<br />
EBIT<br />
Adjusted operating<br />
DKK million 856 959<br />
profi t DKK million 861 979<br />
Gross investments<br />
Capital employed<br />
DKK million (10,872) (6,378)<br />
Capital employed DKK million 29,443 21,097<br />
PPE under construction DKK million<br />
Production assets<br />
transferred from PPE<br />
under construction in<br />
(13,859) (7,483)<br />
the past six months<br />
Adjusted capital<br />
DKK million (1,851) (792)<br />
employed DKK million 13,733 12,822
volumes<br />
Generation from wind and hydro was 11% ahead at 4.4<br />
TWh in <strong>2011</strong>. Generation from offshore wind farms increased<br />
due to the start-up of production at Walney 1, more<br />
turbines in operation at Gunfleet Sands and higher output<br />
from Horns Rev 2. Generation from onshore wind farms in<br />
Poland and Denmark also increased, while hydro output in<br />
Sweden was less than in 2010.<br />
Generation from wind and hydro represented 22% of<br />
the Group’s overall electricity generation in <strong>2011</strong> compared<br />
with 20% in 2010.<br />
financial performance<br />
Revenue was up DKK 1.4 billion at DKK 4.3 billion in <strong>2011</strong>.<br />
Around 2/3 of revenue came from government revenue<br />
schemes, the key elements of which were fixed tariffs (primarily<br />
Denmark) and guaranteed minimum prices for<br />
green certificates (primarily the UK). The rest of revenue in<br />
<strong>2011</strong> was sold at market prices, but as a large portion had<br />
been hedged at fixed prices, the development in the electricity<br />
price only had limited effect on revenue.<br />
EBITDA was DKK 0.1 billion ahead at DKK 1.8 billion in<br />
<strong>2011</strong>, driven by higher revenue, whereas higher costs due<br />
to the higher operating activity and building up of the<br />
business area had an adverse impact on EBITDA.<br />
EBIT amounted to DKK 0.9 billion and was marginally<br />
lower than in 2010, as the higher EBITDA was offset by<br />
higher depreciation on the new wind farms.<br />
Revenue <strong>2011</strong><br />
18%<br />
47%<br />
56.8<br />
DKK billion<br />
14%<br />
6%<br />
15%<br />
Exploration & Production<br />
Wind Power<br />
Thermal Power<br />
<strong>Energy</strong> Markets<br />
Sales & Distribution<br />
Thermal Power<br />
performance highlights <strong>2011</strong> 2010<br />
Volumes<br />
Electricity generation,<br />
thermal TWh 12.6 15.3<br />
Heat generation PJ 42.6 53.2<br />
Financial performance<br />
Revenue DKK million 10,665 11,731<br />
EBITDA DKK million 2,255 2,228<br />
EBIT<br />
Adjusted operating<br />
DKK million 752 557<br />
profi t DKK million 720 511<br />
Gross investments DKK million (714) (3,853)<br />
Capital employed<br />
Capital employed DKK million 17,882 19,085<br />
PPE under construction DKK million<br />
Production assets<br />
transferred from PPE<br />
under construction in<br />
(214) (3,596)<br />
the past six months DKK million (3,883) (5,345)<br />
Adjusted capital<br />
employed DKK million 13,785 10,144<br />
Environment<br />
EU ETS CO2 emissions<br />
EBITDA <strong>2011</strong><br />
15%<br />
14%<br />
17%<br />
million<br />
tonnes 9.5 11.1<br />
volumes<br />
Both electricity and heat generation were lower in <strong>2011</strong><br />
than the previous year due to a milder winter. Electricity<br />
generation was thus 12.6 TWh, down 18% on 2010, while<br />
heat generation was down 20% at 42.6 PJ.<br />
13.8<br />
DKK billion<br />
41%<br />
13%<br />
Exploration & Production<br />
Wind Power<br />
Thermal Power<br />
<strong>Energy</strong> Markets<br />
Sales & Distribution<br />
<strong>DONG</strong> ENERGY <strong>DONG</strong> ENERGY GROUP <strong>ANNUAL</strong> <strong>REPORT</strong> <strong>2011</strong> – manaGEmEnt’s rEviEw 37
ReVIew of BusIness aReas’ PERFORMANCE<br />
financial performance<br />
Revenue was down DKK 1.1 billion at DKK 10.7 billion in<br />
<strong>2011</strong> due to lower electricity and heat generation and lower<br />
electricity prices in Denmark. The decline was partly offset<br />
by higher sales of system services etc. to Energinet.dk and<br />
the full-year effect of the new gas-fired power stations in<br />
the UK (Severn) and Norway (Mongstad), which became<br />
operational at the end of 2010.<br />
EBITDA was DKK 2.3 billion in <strong>2011</strong>, in line with 2010.<br />
The new gas-fired power stations had a positive effect on<br />
EBITDA, but this was offset by lower earnings from the<br />
Danish power stations due to lower electricity and heat<br />
generation and a significantly lower spread.<br />
EBIT increased by DKK 0.2 billion to DKK 0.8 billion in<br />
<strong>2011</strong>. The improvement relative to EBITDA reflected impairment<br />
losses on small-scale power stations in 2010.<br />
Environment<br />
Danish power station EU ETS CO emissions totalled 9.5<br />
2<br />
million tonnes compared with 11.1 million tonnes in 2010.<br />
The decline reflected lower generation.<br />
There were four significant environmental incidents in<br />
<strong>2011</strong>. At Kyndby power station, there was an increased release<br />
of nitrogen after operating problems at the wastewater<br />
treatment plant. At Stigsnæs power station, there was a spill<br />
of 8 m3 of fuel oil, partly onto soil and partly into a tank yard<br />
with a concrete base. In addition, there were two spills of<br />
significant volumes of oil onto soil from the oil storage tank<br />
facility in Skælskør. In all cases, the cleaning up of the areas<br />
were accepted by the environmental authorities.<br />
<strong>Energy</strong> Markets<br />
performance highlights <strong>2011</strong> 2010<br />
Volumes<br />
Gas sales TWh 122.3 118.5<br />
Electricity sales<br />
Electricity generation,<br />
TWh 9.9 10.4<br />
thermal TWh 3.4 0.9<br />
Financial performance<br />
Revenue DKK million 33,689 31,516<br />
EBITDA DKK million 1,963 2,959<br />
EBIT<br />
Adjusted operating<br />
DKK million 778 2,394<br />
profi t DKK million 751 2,386<br />
Gross investments DKK million (333) (477)<br />
Capital employed<br />
Capital employed DKK million 6,553 4,327<br />
PPE under construction DKK million<br />
Adjusted capital<br />
(133) (106)<br />
employed DKK million 6,420 4,221<br />
Environment<br />
EU ETS CO2 emissions<br />
38<br />
manaGEmEnt’s rEviEw – <strong>DONG</strong> ENERGY GROUP <strong>ANNUAL</strong> <strong>ANNUAL</strong> <strong>REPORT</strong> <strong>REPORT</strong> <strong>2011</strong> <strong>2011</strong><br />
million<br />
tonnes 1.2 0.5<br />
Gas fl aring million Nm 3 1.0 1.0<br />
volumes<br />
Gas sales (incl. sales to own power stations) increased by 3%<br />
to 122.3 TWh, reflecting significantly higher sales on hubs.<br />
Wholesale sales were lower, on the other hand, primarily due<br />
to milder weather than in 2010. This led to lower sales in Denmark,<br />
Sweden and Germany and to own power stations.<br />
Electricity sales were 9.9 TWh, a decrease of 5% on<br />
2010. Electricity generation from the gas-fired Severn<br />
power station, which became operational in 2010,<br />
amounted to 3.2 TWh in <strong>2011</strong>. Both units were shut down<br />
following damage to both turbines in July <strong>2011</strong>. One unit
was brought back online in October <strong>2011</strong>, while the other<br />
unit is expected to be brought back online in the first half<br />
of 2012. Both units are running at reduced output until the<br />
repairs have been completed. The gas-fired Enecogen<br />
power station in the Netherlands became operational at<br />
the end of <strong>2011</strong>, generating 0.2 TWh.<br />
financial performance<br />
Revenue increased by DKK 2.2 billion to DKK 33.7 billion<br />
due to higher electricity generation and gas sales and<br />
higher gas sales prices than in 2010.<br />
EBITDA was DKK 2.0 billion, DKK 1.0 billion down on<br />
2010, primarily reflecting lower earnings from gas sales under<br />
fixed-priced and oil-indexed contracts than in 2010.<br />
Renegotiation of gas contracts had a significant positive<br />
effect of around DKK 1 billion in <strong>2011</strong>, while the new gasfired<br />
power stations in the UK and the Netherlands depressed<br />
EBITDA due to the low green spark spreads. The<br />
consolidated EBITDA effect of the new gas-fired power stations<br />
was neutral.<br />
EBIT was down DKK 1.6 billion at DKK 0.8 billion in <strong>2011</strong><br />
due to the lower EBITDA and a DKK 0.6 billion impairment<br />
loss on offshore gas pipelines in the first half of <strong>2011</strong>.<br />
Environment<br />
EU ETS CO emissions rose compared with 2010, as <strong>2011</strong> was<br />
2<br />
the first full year of operation for the Severn power station. A<br />
small portion of CO emissions was due to flaring at the Ny-<br />
2<br />
bro gas treatment plant. This portion was in line with 2010.<br />
Sales & Distribution<br />
performance highlights <strong>2011</strong> 2010<br />
Volumes<br />
Gas sales TWh 20.3 24.2<br />
Gas distribution TWh 9.9 11.4<br />
Electricity sales TWh 7.6 8.2<br />
Electricity distribution<br />
Oil transportation,<br />
TWh 8.8 9.1<br />
Denmark million bbl 72 78<br />
Financial performance<br />
Revenue DKK million 13,009 14,185<br />
EBITDA DKK million 2,027 2,036<br />
EBIT<br />
Adjusted operating<br />
DKK million 566 1,057<br />
profi t DKK million 584 1,072<br />
Gross investments<br />
Capital employed<br />
DKK million (810) (858)<br />
Capital employed DKK million 10,944 12,064<br />
PPE under construction DKK million<br />
Production assets<br />
transferred from PPE<br />
under construction in<br />
(530) (507)<br />
the past six months<br />
Adjusted capital<br />
DKK million (447) (511)<br />
employed DKK million 9,967 11,046<br />
volumes<br />
Gas sales were 20.3 TWh, down 16% on 2010, primarily<br />
reflecting the milder winter than in 2010 and growing competition<br />
in the Danish market, with a resulting decline in<br />
market share.<br />
Gas distribution was also affected by the milder winter,<br />
amounting to 9.9 TWh, a decrease of 13% on 2010.<br />
There was also a small decline in both distribution and<br />
sales of electricity and in transportation in the oil pipeline<br />
compared with 2010.<br />
financial performance<br />
Revenue was down DKK 1.2 billion, at DKK 13.0 billion, primarily<br />
reflecting lower gas volumes being sold due to intensifying<br />
competition and milder weather in <strong>2011</strong> as well<br />
as a fall in payments recovered from consumers on behalf<br />
of Energinet.dk. These collected payments have no EBITDA<br />
effect.<br />
The lower revenue was offset by a lower cost level.<br />
EBITDA was consequently DKK 2.0 billion in <strong>2011</strong>, the<br />
same level as the previous year.<br />
EBIT was down DKK 0.5 billion, amounting to DKK 0.6<br />
billion in <strong>2011</strong>. The decline primarily reflected a DKK 0.3<br />
billion impairment loss on goodwill related to the Dutch<br />
sales subsidiary in <strong>2011</strong> due to changed pricing in the<br />
Dutch market.<br />
Environment<br />
A significant environmental incident occurred in <strong>2011</strong> in<br />
connection with the establishment of a motorway, when a<br />
gas pipe suffered excavation damage by the contractor,<br />
resulting in a leak of 36 thousand m3 of methane. After the<br />
fracture, the gas supply was shut off immediately to prevent<br />
a major gas leak. Internal and external emergency plans<br />
functioned as planned and the damage was rapidly repaired.<br />
<strong>DONG</strong> ENERGY <strong>DONG</strong> ENERGY GROUP <strong>ANNUAL</strong> <strong>REPORT</strong> <strong>2011</strong> – manaGEmEnt’s rEviEw 39
fInancIal outlook FOR 2012<br />
External assumptions and<br />
market conditions<br />
Europe is still affected by the economic crisis, not least by<br />
the government debt crisis in Southern Europe. The future<br />
price development and energy demand are therefore subject<br />
to particular uncertainty.<br />
Market prices and hedging<br />
The movements in a variety of market prices, including oil,<br />
gas, electricity, coal, CO and the USD and GBP exchange<br />
2<br />
rates, impact on <strong>DONG</strong> <strong>Energy</strong>’s financial performance.<br />
The profit outlook for 2012 is based on the average market<br />
prices in the table.<br />
A large portion of market price exposure in 2012 has<br />
been hedged, which means that any deviations from assumed<br />
prices will not filter through in full to financial performance.<br />
Price hedging of oil and gas is carried out after<br />
adjustment for hydrocarbon taxation (primarily in Norway)<br />
to achieve the desired cash flow effect after tax. As will be<br />
seen from the table below, <strong>DONG</strong> <strong>Energy</strong>’s overall exposure<br />
to changes in energy prices is limited from a short-term<br />
perspective. All other things being equal, a concurrent 10%<br />
increase in prices will change EBITDA by around DKK 0.8<br />
billion in 2012. The corresponding change in EBITDA after<br />
hydrocarbon taxation is around DKK 0.2 billion.<br />
Hedging 2012<br />
Before<br />
hydrocarbon tax<br />
market prices<br />
(average)<br />
Hedging percentage<br />
After<br />
hydrocarbon tax Avg. hedging price<br />
estimate<br />
2012<br />
10% price increase<br />
(DKK million)<br />
Oil USD/bbl 10% 28% 86 276<br />
Gas EUR/MWh 53% 91% 23 366<br />
Thermal electricity generation<br />
(GDS/GSS) EUR/MWh 56% 56% 10/6 38<br />
Renewable generation, market<br />
price share 1 EUR/MWh 32% 32% 61 82<br />
1 Fixed tariffs and guaranteed minimum prices for green certifi cates account for approx. 2/3 of expected revenue from the wind power portfolio.<br />
40<br />
manaGEmEnt’s rEviEw – <strong>DONG</strong> ENERGY GROUP <strong>ANNUAL</strong> <strong>ANNUAL</strong> <strong>REPORT</strong> <strong>REPORT</strong> <strong>2011</strong> <strong>2011</strong><br />
Actual<br />
<strong>2011</strong><br />
Oil, Brent USD/bbl 105 111<br />
Gas, TTF EUR/MWh 23 23<br />
Gas, NBP EUR/MWh 23 22<br />
Electricity, Nord Pool<br />
system EUR/MWh 37 47<br />
Electricity, Nord Pool, DK 1 EUR/MWh 46 49<br />
Electricity, EEx EUR/MWh 52 51<br />
Electricity, UK EUR/MWh 53 55<br />
Coal, API 2 USD/tonne 112 122<br />
CO 2 , EUA EUR/tonne 7.1 13.3<br />
Green dark spread, DK 1 EUR/MWh 8.2 5.0<br />
Green spark spread, UK EUR/MWh 4.6 7.8<br />
Green spark spread, NL EUR/MWh 2.5 4.0<br />
USD exchange rate DKK/USD 5.7 5.4<br />
Source: Platts, Argus, Nord Pool, LEBA, ECx.<br />
1 Based on average prices in DK1 and DK2.<br />
FORWARD-LOOKING STATEMENTS<br />
The report contains forward-looking statements,<br />
which include projections of financial performance<br />
in 2012. These statements are not guarantees<br />
of future performance and involve certain<br />
risks and uncertainties. Therefore, actual future<br />
results and trends may differ materially from what<br />
is forecast in this report due to a variety of factors,<br />
including, but not limited to, changes in temperature<br />
and precipitation levels; the development<br />
in oil, gas, electricity, coal, CO 2 , currency<br />
and interest rate markets; changes in legislation,<br />
regulation or standards; changes in the competitive<br />
environment in <strong>DONG</strong> <strong>Energy</strong>’s markets; and<br />
security of supply. Reference is made to the chapter<br />
on Risk and risk management, and notes 32<br />
and 33 to the consolidated financial statements.
Further information on <strong>DONG</strong> <strong>Energy</strong>’s market risks and<br />
risk-mitigating initiatives are set out in the section on market<br />
and credit risks in the Risk and risk management chapter<br />
on page 44. This section also explains the expected effect<br />
on the business performance results of financial and<br />
physical hedging transactions where the effects on the results<br />
are deferred to subsequent periods.<br />
New activities and other assumptions<br />
Compared with <strong>2011</strong>, EBITDA in 2012 is expected to benefit<br />
from new or significantly expanded activities. This will be<br />
offset by increased costs for the repair work on the Siri<br />
platform, lower income in Thermal Power and the fact that,<br />
in 2012, there will not be a positive effect from renegotiation<br />
of gas contracts.<br />
EBITDA outlook for 2012<br />
Based on the market price outlook referred to above and<br />
price hedging and the described expectations concerning<br />
new activities and other assumptions, business performance<br />
EBITDA is expected to be in line with <strong>2011</strong>.<br />
EBITDA target<br />
Based on planned investments, the target is still a<br />
doubling of EBITDA in the period up to 2015 compared<br />
with 2009, when EBITDA was DKK 8.8 billion.<br />
EBITDA in 2013 is expected to be significantly ahead of<br />
2012 due to the start-up of production of new assets. To<br />
this should be added the full-year effect of new assets that<br />
become operational in 2012.<br />
Outlook for net investments<br />
Net investments in the period <strong>2011</strong>-13 are still expected to<br />
be around DKK 40 billion, remaining unchanged from the<br />
outlook in the 2010 annual report.<br />
Target for capital structure<br />
From and including 2012, the long-term target for capital<br />
structure has been changed so that adjusted net debt must<br />
not exceed 2.5 times EBITDA. The change of the denominator<br />
from cash flows from operating activities to EBITDA<br />
is being made to link the capital structure objective to<br />
EBITDA, which is <strong>DONG</strong> <strong>Energy</strong>’s overall performance<br />
measure, and which, following the introduction of business<br />
performance income statement, better represents the<br />
Group’s underlying financial performance.<br />
Capital structure<br />
4<br />
3<br />
2<br />
1<br />
0<br />
Adjusted net debt/Cash flows<br />
from operating activities<br />
Adjusted net debt/<br />
EBITDA<br />
2007<br />
2008<br />
2009<br />
Capital structure<br />
target <strong>2011</strong><br />
Capital structure<br />
target from 2012<br />
2010<br />
<strong>2011</strong><br />
Adjusted net debt is defi ned as net debt for accounting purposes plus<br />
50% of hybrid capital maturing in 3005.<br />
<strong>DONG</strong> ENERGY <strong>DONG</strong> ENERGY GROUP <strong>ANNUAL</strong> <strong>REPORT</strong> <strong>2011</strong> – manaGEmEnt’s rEviEw 41
fInancIal OBJECTIVES<br />
<strong>DONG</strong> <strong>Energy</strong> has set objectives for its financial management. The key<br />
financial management objectives are described below<br />
rating<br />
Rating of minimum BBB+/Baa1<br />
A-/A3<br />
A-/A3 BBB+/<br />
Baa1<br />
BBB+/<br />
BBB/<br />
Baa1<br />
Baa2<br />
BBB/<br />
BBB-/<br />
Baa2<br />
Baa3<br />
BBB-/<br />
Baa3<br />
Standard & Poor's<br />
Financial objective<br />
Standard & Poor's<br />
Financial objective<br />
2007<br />
2008<br />
Doubling EBITDA, DKK billion<br />
2009<br />
Doubling Realised EBITDA, Target DKK billionTrend<br />
18<br />
16<br />
14<br />
12<br />
10<br />
8<br />
6<br />
4<br />
2<br />
0<br />
2009 2010 <strong>2011</strong> 2012<br />
1<br />
Realised Target Trend<br />
18<br />
16<br />
14<br />
12<br />
10<br />
8<br />
6<br />
4<br />
2<br />
8.8<br />
8.8<br />
13.8<br />
13.8<br />
0<br />
2009 1<br />
2007<br />
2010<br />
2008<br />
<strong>2011</strong><br />
2009<br />
2012<br />
Moody's<br />
Moody's<br />
2013<br />
2010<br />
2010<br />
2014<br />
<strong>2011</strong><br />
<strong>2011</strong><br />
17.6<br />
2015<br />
1 EBITDA for 2009 is based on the IFRS fi nancial statements presented.<br />
Capital structure<br />
Adjusted net debt must not exceed 2.5 times EBITDA.<br />
Capital structure<br />
4<br />
3<br />
2<br />
1<br />
0<br />
Dividends, %<br />
42<br />
manaGEmEnt’s rEviEw – <strong>DONG</strong> ENERGY GROUP <strong>ANNUAL</strong> <strong>ANNUAL</strong> <strong>REPORT</strong> <strong>REPORT</strong> <strong>2011</strong> <strong>2011</strong><br />
2013<br />
2014<br />
17.6<br />
2015<br />
70<br />
60<br />
50<br />
40<br />
30<br />
Adjusted net debt/Cash flows<br />
Capital structure<br />
from operating activities<br />
target <strong>2011</strong><br />
Adjusted net debt/ Finansiel målsætning Capital structure<br />
EBITDA<br />
target from 2012<br />
Finansiel Moody's målsætning<br />
Moody's Standard & Poor's<br />
Standard & Poor's<br />
2007<br />
Maximum payout ratio Actual payout ratio<br />
Minimum payout ratio<br />
EBITDA Likvider<br />
EBITDA Likvider Bindende lånefaciliteter<br />
Bindende lånefaciliteter<br />
2007<br />
2008<br />
2008<br />
2009<br />
2009<br />
2010<br />
2010<br />
<strong>2011</strong><br />
Adjusted net debt is defi ned as net debt for accounting purposes plus<br />
50% of hybrid capital maturing in 3005.<br />
<strong>2011</strong><br />
Proposed dividend for the year will be determined based<br />
on the following principle:<br />
• A fixed amount of DKK 7.75 per share (in <strong>2011</strong>), which<br />
will be increased by DKK 0.25 per year if the shareholders’<br />
share of profit for the year after tax is within the<br />
payout ratio range<br />
• A payout ratio of minimum 40% and maximum 60% of<br />
the shareholders’ share of the business performance results<br />
for the year after tax less coupon after tax to hybrid<br />
capital holders and the non-controlling interests’<br />
share of profit for the year.<br />
Kap<br />
Kap<br />
Jus<br />
Jus<br />
Maximum payo<br />
Minimum payo<br />
Actual payout-r
<strong>DONG</strong> <strong>Energy</strong> has a diversified loan portfolio, with the international bond<br />
market as the primary source of funding<br />
<strong>DONG</strong> <strong>Energy</strong> is a reputable player in the bond market<br />
and engages in continuous dialogue with bond investors<br />
and bond analysts, for example via quarterly presentations<br />
and roadshows.<br />
Outstanding bonds<br />
Currency<br />
Principal<br />
amount<br />
(million)<br />
Corporate bonds<br />
Coupon<br />
(%) Maturity Listed in<br />
EUR 500 3.500 29 Jun 2012 Luxembourg<br />
EUR 500 4.875 7 May 2014 London<br />
EUR 500 4.000 16 Dec 2016 London<br />
EUR 500 6.500 7 May 2019 London<br />
EUR 500 4.875 16 Dec 2021 London<br />
GBP 1 750 4.875 12 Jan 2032 London<br />
GBP 500 5.750 9 Apr 2040 London<br />
Hybrid bonds<br />
EUR 600 5.500 Year 3005 Luxembourg<br />
EUR 700 7.750 Year 3010 Luxembourg<br />
1 Issued in January 2012.<br />
Significant financing activities in <strong>2011</strong><br />
Date Activity<br />
24 Jan Issuing of hybrid bonds and concurrent partial<br />
repurchase of previously issued hybrid bonds<br />
17 Aug Establishment of new EUR 1,300 million credit<br />
facility<br />
20 Sep Raising of loan from the Nordic Investment Bank<br />
(EUR 240 million)<br />
Financial calendar 2012<br />
Date Activity<br />
9 Mar Annual report <strong>2011</strong><br />
18 Apr Annual General Meeting<br />
11 May Interim nancial report – Q1 2012<br />
10 Aug Interim nancial report – H1 2012<br />
1 Nov Interim nancial report – 9M 2012<br />
Spread (credit margin) compared with swap rate<br />
for selected bonds<br />
Bond maturity 2021 Bond maturity 2016<br />
Bond maturity 2014<br />
Basis points<br />
160<br />
140<br />
120<br />
100<br />
80<br />
60<br />
40<br />
20<br />
0<br />
2010<br />
<strong>2011</strong><br />
Rating<br />
Standard & Poor's Moody's<br />
Company rating A- Baa1<br />
Ordinary bonds A- Baa1<br />
Hybrid bonds BBB og BB+ Baa3<br />
Outlook Stable Stable<br />
Latest rating report Dec <strong>2011</strong> Jan 2012<br />
Contact<br />
Investor Relations: Morten H. Buchgreitz<br />
E-mail: investorrelations@dongenergy.com<br />
Telephone: +45 99 55 97 50<br />
www.dongenergy.com/en/investor<br />
<strong>DONG</strong> ENERGY <strong>DONG</strong> ENERGY GROUP <strong>ANNUAL</strong> <strong>REPORT</strong> <strong>2011</strong> – manaGEmEnt’s rEviEw 43<br />
dong eneRgy AND THE CAPITAL MARKET<br />
Label er<br />
Teksten<br />
imellem<br />
Obligation<br />
Obligation<br />
Obligation
RIsk AND RISK MANAGEMENT<br />
44<br />
Risk is part of the business for <strong>DONG</strong> <strong>Energy</strong>.<br />
The Group works actively to balance these risks,<br />
so that they either create value or are reduced<br />
Risks are an integral part of <strong>DONG</strong> <strong>Energy</strong>’s business.<br />
Some market risks are managed with a view to striking the<br />
right balance between value creation and associated risks.<br />
Here, movements in market prices can be an earnings opportunity<br />
as well as a competitive parameter. As far as<br />
other risks such as environmental, safety and technical<br />
risks are concerned, <strong>DONG</strong> <strong>Energy</strong> endeavours to completely<br />
eliminate these or, if this is not possible, to mitigate<br />
them as far as possible.<br />
Risk management<br />
The objective of risk management is to ensure that the<br />
risks that may affect implementation of strategy, including<br />
expected earnings, are identified, assessed and form an active<br />
part of day-to-day decision-making process. This helps<br />
underpin and optimise future value creation in accordance<br />
with <strong>DONG</strong> <strong>Energy</strong>’s strategy. In the years to come, the<br />
strategy will contribute to diversifying the Group’s risks,<br />
Selected material risks<br />
Market and credit risks<br />
<strong>Energy</strong> price risks<br />
• Oil and gas price risks<br />
• Price risks for thermal<br />
electricity generation<br />
• Price risks for renewable<br />
generation<br />
• Market trading<br />
Financial risks<br />
• Currency risks<br />
• Interest rate risks<br />
• Liquidity and fi nancing<br />
risks<br />
Credit risks<br />
Regulatory risks<br />
• Regulatory conditions<br />
• Tax regimes<br />
• Financial regulation<br />
partly because <strong>DONG</strong> <strong>Energy</strong>’s international growth will reduce<br />
the relative importance of Danish energy markets.<br />
Material risks can be divided into four main categories<br />
and are, to some extent, interdependent. The Group identifies<br />
and prioritises its risks annually in a risk matrix on the<br />
basis of materiality and probability.<br />
Risk matrix<br />
manaGEmEnt’s rEviEw – <strong>DONG</strong> ENERGY GROUP <strong>ANNUAL</strong> <strong>ANNUAL</strong> <strong>REPORT</strong> <strong>REPORT</strong> <strong>2011</strong> <strong>2011</strong><br />
High<br />
Materiality<br />
Low<br />
Low Probability<br />
Operational risks<br />
• Construction and operation<br />
of facilities<br />
• Subcontractors<br />
• Environment<br />
• Contractual risks<br />
• Partnerships<br />
• Changed demand side<br />
characteristics<br />
• Extensive damage to property<br />
BusinEss pErfOrmanCE<br />
Unless otherwise stated, Management’s<br />
review comments on the business performance<br />
results.<br />
GlOssary<br />
Reference is made to the glossary on<br />
pages 188-189 127-128 for definitions of terms.<br />
The highlighted risks are explained on the following pages.<br />
High<br />
Staff and organisational risks<br />
• Employee safety<br />
• Attracting and retaining<br />
competent employees<br />
• Fraud
Market and credit risks<br />
The Group’s net exposure to market risks is illustrated below.<br />
In the long term, the Group’s market risks are determined<br />
by its strategic choices and associated asset mix.<br />
<strong>DONG</strong> <strong>Energy</strong> mitigates its structural risks through, among<br />
other things, its technical and geographical diversification<br />
and the transition to greener electricity and heat generation,<br />
as described in the chapter Wind and biomass<br />
growth. Coupled with balancing of the oil and gas portfolio,<br />
this provides a diversified portfolio of assets with different<br />
risk profiles.<br />
To further reduce the fluctuations in the Group’s cash<br />
flows in the short and medium terms, price hedging contracts<br />
are entered into within the risk management time<br />
frame (up to five years). At the short end of the time frame,<br />
we want a high level of hedging to achieve a high degree of<br />
certainty with regard to cash flows, while the hedging level is<br />
lower in subsequent years. This approach is chosen partly<br />
because the underlying longer-term exposure is subject to<br />
greater uncertainty, and partly because the financial and<br />
physical markets are less liquid in the longer term.<br />
Overall, the diversification of the structural risk and management<br />
of the Group’s cash flows in the short and medium<br />
terms has a positive effect on <strong>DONG</strong> <strong>Energy</strong>’s capital structure<br />
target, as the fluctuations in earnings from the different<br />
activities are largely independent of each other and can therefore<br />
be assumed to balance each other out to some extent.<br />
Hedging strategy<br />
High<br />
Hedging percentage<br />
Low<br />
Commercial activities<br />
Purchase and production<br />
• Oil and gas production<br />
• Long-term wholesale<br />
gas contracts<br />
• Thermal electricity<br />
generation<br />
• Renewable generation<br />
Sale<br />
• Retail customers<br />
(gas and electricity)<br />
• Wholesale customers<br />
(gas and electricity)<br />
Up to 5 years<br />
Risk management principle<br />
Transfer of exposure<br />
Asset backed<br />
optimisation<br />
Time<br />
• Managing contract<br />
volumes and optimising<br />
contracts<br />
• Optimising physical<br />
and financial exposures<br />
<strong>DONG</strong> <strong>Energy</strong>’s principle for managing market risks is<br />
shown below. Where possible, all of the Group’s exposures<br />
from production and purchase and sales contracts within<br />
the management time frame are combined in the activity<br />
Asset-backed optimisation, where they are consolidated<br />
and optimised together. The consolidated exposure is then<br />
hedged via <strong>DONG</strong> <strong>Energy</strong>’s trading function (Market trading),<br />
which trades exposures in the market within given<br />
risk parameters.<br />
Market risks can be divided into energy price risks and<br />
financial risks. Financial risks comprise currency risks, interest<br />
rate risks and liquidity and financing risks. <strong>Energy</strong><br />
price risks are affected by fluctuations in the prices of oil,<br />
gas, electricity, coal, CO and, to a lesser extent, other com-<br />
2<br />
modities. Part of the exposure depends on one specific<br />
price (direct price risks), while other parts depend on the<br />
difference between two or more prices (spread risks). Market<br />
price risk on direct price risks is higher than for spreadbased<br />
exposures as the prices of individual commodities<br />
are typically more volatile than the levels of wholly or partly<br />
correlated energy prices. The figure shows the exposure<br />
values for 2012 before and after hedging.<br />
Exposure to energy prices in 2012, DKK billion<br />
6<br />
5<br />
4<br />
3<br />
2<br />
1<br />
0<br />
Commercial exposure Net exposure<br />
Hedging of exposure<br />
Oil and gas<br />
Market<br />
trading<br />
Renewable generation<br />
• Efficient execution in<br />
the market within given<br />
risk limits<br />
Execution in the market<br />
Thermal electricity<br />
generation<br />
Market<br />
counterparties<br />
<strong>DONG</strong> ENERGY <strong>DONG</strong> ENERGY GROUP <strong>ANNUAL</strong> <strong>REPORT</strong> <strong>2011</strong> – manaGEmEnt’s rEviEw 45<br />
Efter afdæ<br />
Før afdæk<br />
Husk kategorier i 3 dæk
RIsk AND RISK MANAGEMENT<br />
risk and risk policy Exposure and hedging<br />
Oil and gas price risks<br />
Oil and gas price risks come primarily from equity production<br />
of oil and gas and from differences in the indexation<br />
of sales and purchase prices for gas.<br />
<strong>DONG</strong> <strong>Energy</strong>’s production of oil contributes to reducing<br />
its oil price exposure from oil price-indexed gas purchase<br />
contracts. The integrated business model thus has<br />
a stabilising effect on the company’s cash flows and overall<br />
risk profile.<br />
The risk to future cash flows from oil and gas price positions<br />
is managed with a time frame of five years based<br />
on a target for Cash-Flow-at-Risk. Oil and gas exposures<br />
are hedged after adjustment for hydrocarbon taxation to<br />
achieve the desired cash flow effect after tax.<br />
The oil and gas exposure profile is expected to change<br />
in the years to come, primarily due to rising equity production<br />
of oil. <strong>DONG</strong> <strong>Energy</strong> will be affected financially<br />
when oil and gas price trends diverge in the short term<br />
(decouple), as was the case in 2009-<strong>2011</strong>.<br />
The long-term purchase and sales contracts contain<br />
embedded options, for example in the form of volume<br />
flexibility and renegotiation clauses that may alter <strong>DONG</strong><br />
<strong>Energy</strong>’s risk profile in both the short and the long term.<br />
price risks for thermal electricity generation<br />
The electricity price is determined by fuel prices, weather<br />
conditions, prices for CO emissions allowances and<br />
2<br />
general supply side and demand side characteristics. Risk<br />
management of thermal electricity generation is based on<br />
freezing the contribution margin for future electricity<br />
generation by selling electricity and buying fuel and CO . 2<br />
The spread-based price exposure for the Danish and<br />
foreign electricity generation is managed with a time<br />
frame of up to five years. The time frame reflects the given<br />
liquidity conditions for trading in the forward market.<br />
The strategic measures involving adaptation of Danish<br />
thermal electricity generation and the establishment of<br />
new gas-fired power stations in the UK (Severn) and the<br />
Netherlands (Enecogen) will, in the years to come, reduce<br />
<strong>DONG</strong> <strong>Energy</strong>’s electricity exposure to Nord Pool from<br />
67% of the value in 2007 to an expected 12% in 2015. This<br />
will contribute to a more diversified position in the market.<br />
46<br />
manaGEmEnt’s rEviEw – <strong>DONG</strong> ENERGY GROUP <strong>ANNUAL</strong> <strong>ANNUAL</strong> <strong>REPORT</strong> <strong>REPORT</strong> <strong>2011</strong> <strong>2011</strong><br />
Overall, <strong>DONG</strong> <strong>Energy</strong>’s oil and gas exposure consists of a<br />
long gas position (positive effect if prices rise) and a short<br />
oil position. As oil and gas prices have, historically, correlated<br />
positively over long periods of time, the long gas exposure<br />
will, to some extent, be offset by the short oil exposure,<br />
reducing the direct gas price exposure. The net oil<br />
and gas price exposure is treated as a spread risk.<br />
In the very short term, the exposure profile may differ<br />
from the normal profile. For example, this is the case for oil<br />
exposure in 2012, which is marginally long as the proportion<br />
of oil-indexed gas sales contracts that have been entered<br />
into is higher than normal.<br />
At the end of <strong>2011</strong>, 28% of the expected oil exposure<br />
and 91% of the expected gas exposure for 2012 had been<br />
hedged, equivalent to a total hedging percentage of 79%<br />
for oil and gas.<br />
In 2012, a 10% decrease in the price of oil and gas<br />
would reduce EBITDA after hydrocarbon tax by DKK 117<br />
million.<br />
Exposure profile for oil and gas in 2012, DKK billion<br />
6<br />
5<br />
4<br />
3<br />
2<br />
1<br />
0<br />
Commercial exposure Net exposure<br />
Oil<br />
Oil and gas<br />
At the end of <strong>2011</strong>, the price exposure relating to 56% of<br />
expected generation in 2012 for Denmark, the Netherlands<br />
and the UK had been hedged.<br />
Exposure profile for thermal electricity generation in 2012,<br />
DKK billion<br />
0.7<br />
0.6<br />
0.5<br />
0.4<br />
0.3<br />
0.2<br />
0.1<br />
0.0<br />
Denmark<br />
Gas<br />
Commercial exposure Net exposure<br />
UK and The Netherlands<br />
Efter afdæknin<br />
Før afdækning<br />
Efter afdæknin<br />
Før afdækning
isk and risk policy Exposure and hedging<br />
price risks for renewable generation<br />
In connection with the development of renewable energy<br />
sources, primarily offshore wind farms, a major part of<br />
the earnings from wind power will come from regulated<br />
pricing. The most important elements are fixed tariffs<br />
(Denmark and Germany) and guaranteed minimum<br />
prices for green certificates (the UK and Poland).<br />
The market price risk for the wind power portfolio is<br />
treated as a direct price risk and managed with a time<br />
frame of up to five years based on a target for Cash-Flowat-Risk.<br />
market trading<br />
When the Group’s desired hedging level has been determined,<br />
the exposures are transferred to the market trading<br />
function, which is then responsible for executing the physical<br />
and financial transactions in the market. It is not always<br />
possible to hedge the transferred price risks in full.<br />
<strong>DONG</strong> <strong>Energy</strong> therefore has some remaining exposure resulting<br />
from these activities.<br />
The market trading function also balances the physical<br />
volumes in the market and, to a lesser extent, engages in<br />
active taking of positions to ensure an ongoing market<br />
presence and thus gain more detailed market insight. Furthermore,<br />
<strong>DONG</strong> <strong>Energy</strong> has assumed the role of market<br />
maker in the Danish electricity market, which entails further<br />
market risks.<br />
Currency risks<br />
The majority of <strong>DONG</strong> <strong>Energy</strong>’s activities entail exposure<br />
to fluctuations in exchange rates. The key currencies are<br />
USD, GBP, NOK, PLN, SEK and EUR. The total net exposure<br />
is calculated on an ongoing, consolidated basis. The<br />
Group aims to minimise its net exposure via forward contracts,<br />
swaps and options. Currency positions are determined<br />
on the basis of estimated operating cash flows in a<br />
five-year time frame. Currency risks in connection with net<br />
investments in foreign subsidiaries and loans without any<br />
time frame are also included.<br />
At the end of <strong>2011</strong>, fixed tariffs and guaranteed minimum<br />
prices for green certificates accounted for two-thirds of expected<br />
earnings from the wind power portfolio in 2012.<br />
Wind Power has hedged 32% of its market price exposure<br />
in 2012.<br />
In 2012, a 10% decrease in the electricity price would<br />
lead to a DKK 82 million decrease in EBITDA.<br />
Breakdown of income from wind farms in 2012<br />
27%<br />
41%<br />
32%<br />
Market prices<br />
Hedged portion<br />
Certificates<br />
Fixed tariffs<br />
The energy price exposure in market trading was DKK 2 billion<br />
at the end of <strong>2011</strong>.<br />
The overall one-day 95% Value-at-Risk (VaR) was<br />
DKK 55 million.<br />
GBP and USD constitute the largest exposures, made up<br />
of a long GBP position and a short USD position. At the<br />
end of <strong>2011</strong>, 97% of the currency exposure in 2012 had<br />
been hedged.<br />
<strong>DONG</strong> ENERGY <strong>DONG</strong> ENERGY GROUP <strong>ANNUAL</strong> <strong>REPORT</strong> <strong>2011</strong> – manaGEmEnt’s rEviEw 47
RIsk AND RISK MANAGEMENT<br />
risk and risk policy Exposure and hedging<br />
interest rate risks<br />
<strong>DONG</strong> <strong>Energy</strong>’s interest rate risks relate to interestbearing<br />
assets, financial price hedges, non-current liabilities<br />
and current interest payments. The Group wants to<br />
limit the effect of changes in interest rates. As a result, the<br />
loan portfolio, including hybrid capital, was predominantly<br />
fixed-rate at the end of <strong>2011</strong>. Interest rate risk is managed<br />
actively via a target for the duration of the net debt.<br />
liquidity and financing risks<br />
Implementation of <strong>DONG</strong> <strong>Energy</strong>’s strategy assumes financing<br />
in the form of asset disposals or the raising of<br />
loans in addition to the cash inflow from operating activities.<br />
The refinancing risk is reduced by having a diversified<br />
debt mix and maturity profile and ample cash resources in<br />
the form of committed loan facilities, cash or liquid securities.<br />
To secure financing on attractive terms, <strong>DONG</strong> <strong>Energy</strong><br />
has set targets for its credit rating and capital structure<br />
(see page 42). The credit rating target is ratings of at least<br />
BBB+ (Standard & Poor’s) and Baa1 (Moody’s).<br />
Up to and including <strong>2011</strong>, the capital structure target<br />
was for adjusted net debt not to exceed three times cash<br />
flows from operating activities. From and including 2012,<br />
the target has been changed so that adjusted net debt<br />
must not exceed 2.5 times EBITDA.<br />
48<br />
manaGEmEnt’s rEviEw – <strong>DONG</strong> ENERGY GROUP <strong>ANNUAL</strong> <strong>ANNUAL</strong> <strong>REPORT</strong> <strong>REPORT</strong> <strong>2011</strong> <strong>2011</strong><br />
The table below shows the key indicators for interest rate<br />
risk. Total interest rate risk at the end of <strong>2011</strong> was DKK 3.1<br />
billion, calculated as the amount by which the market<br />
value of debt, hybrid capital and cash and cash equivalents<br />
would fall in the event of a one percentage point increase<br />
across the interest rate curve. The interest rate risk<br />
corresponds to the loan portfolio (excluding hybrid capital)<br />
having a duration of 7.7 years.<br />
In 2012, a one percentage point increase in the interest<br />
rate would result in a DKK 32 million increase in net interest<br />
expense compared with a total cost in 2012 for net debt<br />
and hybrid capital at the end of <strong>2011</strong> of DKK 2.1 billion.<br />
loan portfolio profile<br />
(excl. hybrid capital) at 31 Dec. <strong>2011</strong><br />
Fixed-interest portion 1 (%) 88.9<br />
Duration (years) 7.7<br />
Average time to maturity (years) 9.4<br />
Average interest rate (%) 4.1<br />
1 The fi xed-interest portion incl. hybrid capital was 91.5%<br />
At the end of <strong>2011</strong>, cash resources were DKK 23.1 billion,<br />
of which DKK 13.4 billion was committed borrowing facilities<br />
and DKK 9.7 billion available cash and cash equivalents<br />
and securities.<br />
<strong>DONG</strong> <strong>Energy</strong>’s current ratings are A- (Standard &<br />
Poor’s) and Baa1 (Moody’s).<br />
At the end of <strong>2011</strong>, adjusted net debt amounted to 2.0<br />
times cash flows from operating activities and 1.9 times<br />
EBITDA.<br />
Maturity profile, DKK billion<br />
7<br />
6<br />
5<br />
4<br />
3<br />
2<br />
1<br />
0<br />
Committed borrowing facilities Bonds<br />
2012 2013 2014 2015 2016 2017 2018 2019 2020 2021 2022+<br />
Note: Excluding hybrid capital, which comprises: EUR 600 million<br />
maturing in 3005 with first call date in 2015 and EUR 700 million<br />
maturing in 3010 with first call date in 2021.
isk and risk policy Exposure and hedging<br />
Credit risks<br />
<strong>DONG</strong> <strong>Energy</strong> seeks to mitigate its credit risks by systematically<br />
credit-rating counterparties, by using financial<br />
standard contracts and by requiring security. Allocated<br />
credit lines are monitored continuously and counterparties<br />
in the areas of energy trading and financial activities are<br />
monitored daily.<br />
Monitoring of counterparties and allocation of credit<br />
lines are based on limits fixed by the Board of Directors<br />
and the Executive Board. An internal credit rating is required<br />
for major counterparties. Information from external<br />
credit rating analyses, information in the public domain<br />
and <strong>DONG</strong> <strong>Energy</strong>’s own analyses are used to establish<br />
the internal rating and to assess the extent of the commitment<br />
with each counterparty.<br />
results deferred for subsequent recognition<br />
in the business performance results<br />
At the end of <strong>2011</strong>, the deferred earnings impact of financial<br />
and physical contracts entered into as part of the risk management<br />
of the Group’s commercial exposure and hedging<br />
of the loan portfolio was DKK -0.5 billion. The deferred earnings<br />
impact will be recognised in the business performance<br />
results in the period in which the commercial exposure is<br />
recognised. In 2012, the effect of the contracts on the business<br />
performance results will be DKK +0.9 billion, assuming<br />
market prices, most of which will have an impact on<br />
EBITDA, remain unchanged.<br />
<strong>DONG</strong> <strong>Energy</strong> did not suffer any losses on individual major<br />
counterparties in <strong>2011</strong>. However, the recession has led<br />
to a certain rise in the number of cases of arrears among<br />
retail customers, although from a very low level, and the<br />
number appears to have peaked.<br />
For an overview of the credit quality, reference is made<br />
to note 32 to the consolidated financial statements.<br />
DKK million<br />
deferred<br />
for sub -<br />
sequent<br />
recognition<br />
end-<strong>2011</strong><br />
Expected transfer to business<br />
performance results<br />
2012 Other years<br />
Oil 361 114 247<br />
Gas 1,188 1,032 156<br />
Electricity (134) (78) (56)<br />
Coal (103) (30) (73)<br />
Currency (946) (177) (769)<br />
Interest (848) (6) (842)<br />
total derivative<br />
fi nancial<br />
instruments (482) 855 (1,337)<br />
Commodities and currency are recognised in revenue and cost of sales.<br />
Interest is recognised in net fi nance costs.<br />
<strong>DONG</strong> ENERGY <strong>DONG</strong> ENERGY GROUP <strong>ANNUAL</strong> <strong>REPORT</strong> <strong>2011</strong> – manaGEmEnt’s rEviEw 49
RIsk AND RISK MANAGEMENT<br />
Regulatory risks<br />
regulatory conditions<br />
Changes in regulatory conditions in both Denmark and abroad<br />
are material to <strong>DONG</strong> <strong>Energy</strong>’s strategic opportunities and<br />
thus also its future earnings. However, <strong>DONG</strong> <strong>Energy</strong>’s growing<br />
international presence is reducing its dependence on regulatory<br />
changes in the individual countries, such as changes to<br />
subsidy schemes in connection with investments in wind generation<br />
and changes to public regulation of electricity and gas.<br />
<strong>DONG</strong> <strong>Energy</strong>’s presence in several stages of the value chain is<br />
contributing to reducing the effects of regulatory changes in<br />
individual stages of the value chain. Furthermore, <strong>DONG</strong><br />
<strong>Energy</strong> follows political and regulatory developments closely in<br />
the countries in which this is relevant, and takes an active part<br />
in connection with consultations on draft legislation and other<br />
regulatory proposals that involve a risk of material changes.<br />
tax regimes<br />
Changed tax regimes may have a material effect on the<br />
Group’s financial results, including in connection with oil and<br />
Operational risks<br />
Construction and operation of facilities<br />
<strong>DONG</strong> <strong>Energy</strong> has a number of risks associated with the development,<br />
construction, operation and maintenance of facilities,<br />
and these risks cannot all be directly hedged. <strong>DONG</strong><br />
<strong>Energy</strong> continuously focuses on avoiding and preventing inexpedient<br />
situations by means of inspection, improvement<br />
of maintenance programmes and internal and external<br />
checks of production equipment and facilities. A number of<br />
insurance policies have been taken out to protect the value<br />
of the assets, where possible. The subsidiary <strong>DONG</strong> Insurance<br />
A/S was established to optimise the<br />
insurance portfolio and is subject to supervision by the<br />
Danish Financial Supervisory Authority.<br />
Risk governance<br />
Board of Directors<br />
Audit and Risk Committee<br />
Executive Board<br />
Finance Committee<br />
Risk management<br />
Business areas<br />
50<br />
manaGEmEnt’s rEviEw – <strong>DONG</strong> ENERGY GROUP <strong>ANNUAL</strong> <strong>ANNUAL</strong> <strong>REPORT</strong> <strong>REPORT</strong> <strong>2011</strong> <strong>2011</strong><br />
Group Risk Control<br />
Mandates<br />
gas extraction. <strong>DONG</strong> <strong>Energy</strong>’s tax risks are assessed and<br />
managed on a continuous basis using the Group’s tax policy<br />
and tax strategy. <strong>DONG</strong> <strong>Energy</strong> seeks open dialogue with tax<br />
authorities and other public authorities and, wherever possible,<br />
endeavours to obtain binding advance indications from<br />
the authorities to clarify major tax-related risks. Because of<br />
the Group’s international presence, <strong>DONG</strong> <strong>Energy</strong> maintains<br />
a fair transfer pricing system based on OECD guidelines.<br />
financial regulation<br />
The financial crisis has led to a desire among European<br />
regulators for a tightening of the rules on derivatives trading.<br />
This has led to three strands of new regulations (EMIR,<br />
MiFID and REMIT) that may have considerable implications<br />
for <strong>DONG</strong> <strong>Energy</strong> in terms not only of tied-up funds but also<br />
stricter capital requirements. <strong>DONG</strong> <strong>Energy</strong> follows developments<br />
closely and continually analyses whether it is necessary<br />
to adjust the current business model. The REMIT<br />
Regulation came into force on 28 December <strong>2011</strong>.<br />
subcontractors<br />
There are risks associated with the implementation of investment<br />
projects, which may be delayed due to factors such as<br />
delays in installation and transit vessels, commercial and<br />
partner-related factors, breach of contract by suppliers and<br />
subcontractors and, for wind farms, cable-laying. Moreover, a<br />
large part of the equipment required is ordered in markets<br />
that are often characterised by a high level of activity and<br />
where competition may be limited. To mitigate these risks,<br />
<strong>DONG</strong> <strong>Energy</strong> has acquired extensive internal knowledge<br />
and expertise. By acquiring A2SEA and CT Offshore, the<br />
Group has gained control of important expertise in installation<br />
logistics related to the establishment of wind farms,<br />
enabling the processes to be optimised.<br />
The Board of Directors has the overall responsibility for<br />
<strong>DONG</strong> <strong>Energy</strong>’s risk policy. To achieve transparent, efficient<br />
risk management, <strong>DONG</strong> <strong>Energy</strong> has organised its risk<br />
management in a number of decision-making bodies.<br />
• The Audit and Risk Committee’s main risk management<br />
role is to support the Board of Directors in its supervision<br />
of the risk policy pursued.<br />
• The Executive Board continuously assesses and adjusts<br />
the internal control and risk management systems.<br />
• The Finance Committee monitors the Group’s risks and<br />
financing as well as the management of mandates relating<br />
to market price risks.
Environment<br />
As an energy company, <strong>DONG</strong> <strong>Energy</strong> leaves a significant<br />
mark on the environment. The Group therefore has an obligation<br />
to society to work in a long-term, systematic manner<br />
to limit these impacts. Consideration for the climate and the<br />
environment is being continuously integrated as a natural<br />
part of the Group’s activities and decision-making processes.<br />
<strong>DONG</strong> <strong>Energy</strong> has an overall environment policy in which<br />
the Group takes responsibility for minimising its environmental<br />
impact and aims to continually optimise its systems and<br />
processes. The policy is followed up by international certified<br />
management systems in the parts of the business where this<br />
creates value and which entail the highest risks. The environmental<br />
management standard ISO 14001 is applied at all<br />
Danish facilities that generate electricity and heat, in electric-<br />
Staff and organisational risks<br />
Employee safety<br />
For <strong>DONG</strong> <strong>Energy</strong>, a stimulating, healthy working environment<br />
coupled with a high level of safety in the workplace is a<br />
prerequisite for operating a responsible and efficient company.<br />
Safety is therefore factored into all the Group’s activities.<br />
Safety awareness is high, and the Group continuously<br />
strives to improve its safety performance through prevention,<br />
training, education and involvement of employees to cement<br />
the culture: “The safe way – or no way”. These initiatives have<br />
resulted in a markedly falling injury frequency in recent years.<br />
Despite this positive development and the lowest injury<br />
frequency in the history of the Group, <strong>DONG</strong> <strong>Energy</strong> did not<br />
meet its ambition of zero fatalities in <strong>2011</strong>. There were two<br />
accidents at the Group’s subcontractors that led to three fatalities.<br />
<strong>DONG</strong> <strong>Energy</strong> takes these extremely seriously.<br />
The Group has therefore increased its focus on the overall<br />
safety plan, including safety at subcontractors, and associated<br />
systems. The new measures include heightened awareness<br />
of the safety culture, with safety being made a clear<br />
managerial priority across <strong>DONG</strong> <strong>Energy</strong>. The programme<br />
also comprises development of an e-learning programme<br />
• Group Risk Control is responsible for controlling that<br />
<strong>DONG</strong> <strong>Energy</strong>’s financial risks, associated operational<br />
risks, IT risks and strategic risks are identified, measured<br />
and accounted for in accordance with the Group’s guidelines.<br />
Group Risk Control reports to the Chairman of the<br />
Board of Directors’ Audit and Risk Committee.<br />
<strong>DONG</strong> <strong>Energy</strong> also has a central risk management function<br />
that continuously monitors the Group’s overall financial<br />
and energy-related risks and ensures the Group applies appropriate<br />
limits for its risk management. The risk management<br />
function reports regularly to <strong>DONG</strong> <strong>Energy</strong>’s Finance<br />
Committee, and the Board of Directors’ Audit and Risk<br />
Committee receives a quarterly report on the risks identified<br />
as well as reporting on compliance with guidelines.<br />
ity distribution and in oil and gas activities in the North Sea.<br />
Identification and reduction of potential environmental risks<br />
and social risks is a statutory requirement on large projects,<br />
for example offshore wind farms, power stations and exploration<br />
and production activities. Such EIAs (Environmental<br />
Impact Assessments) help achieve the objective of having a<br />
low environmental impact in all phases – from project planning,<br />
through construction and consumption to disposal<br />
and decommissioning.<br />
<strong>DONG</strong> <strong>Energy</strong> works systematically to record, manage<br />
and follow up on environmental incidents. The Group applies<br />
the principle that the severity of an incident should determine<br />
the level of management, and has implemented a<br />
system for risk assessment and systematic follow-up in connection<br />
with incidents.<br />
that all the Group’s employees and suppliers must complete<br />
in 2012. This ensures that <strong>DONG</strong> <strong>Energy</strong>’s core values and<br />
safety requirements reach both all the Group’s own employees<br />
and all supplier employees.<br />
attracting and retaining competent employees<br />
<strong>DONG</strong> <strong>Energy</strong> competes internationally for the resources<br />
and skills that are to secure its future growth. This applies<br />
especially to the commercial and technical skills in Exploration<br />
& Production and Wind Power and commercial skills<br />
in <strong>Energy</strong> Markets.<br />
As <strong>DONG</strong> <strong>Energy</strong> is still very ’Danish’ in many respects,<br />
difficulties may arise in connection with both recruitment<br />
and retention of international employees.<br />
In a worst case scenario, an inadequate supply of<br />
skilled labour could result in <strong>DONG</strong> <strong>Energy</strong> not being able<br />
to implement its planned strategy. To reduce this risk, the<br />
Group has focused in recent years on a variety of activities,<br />
including employer branding, identification of key skills,<br />
talent/skills development and improvement of the conditions<br />
for attracting skilled foreign labour.<br />
Market and credit risks are managed under powers approved<br />
by the Board of Directors which the Executive<br />
Board has delegated via an overall risk policy for <strong>DONG</strong><br />
<strong>Energy</strong> and the individual business areas.<br />
<strong>DONG</strong> <strong>Energy</strong> also has an independent central function<br />
that checks all investment proposals before they are submitted<br />
to the management. The function also ensures optimum<br />
focus on value creation in the execution of approved<br />
investments.<br />
Lastly, <strong>DONG</strong> <strong>Energy</strong> is committed to ensuring that the<br />
company is a safe workplace and limiting any impacts on<br />
the climate and the environment. These efforts are coordinated<br />
by the corporate function QHSE (quality, health,<br />
safety, environment).<br />
<strong>DONG</strong> ENERGY <strong>DONG</strong> ENERGY GROUP <strong>ANNUAL</strong> <strong>REPORT</strong> <strong>2011</strong> – manaGEmEnt’s rEviEw 51
coRPoRate GOVERNANCE<br />
52<br />
The Corporate Governance Committee has prepared Recommendations on<br />
Corporate Governance that listed companies must comply with<br />
As a State-owned public limited company, <strong>DONG</strong> <strong>Energy</strong><br />
operates on terms very similar to those applying to listed<br />
companies. The Group has consequently elected to generally<br />
comply with the recommendations. The choices made<br />
by <strong>DONG</strong> <strong>Energy</strong> within the individual corporate governance<br />
recommendations can be found at www.dongenergy.<br />
com/corporate_governance.<br />
The Board of Directors reviews the corporate governance<br />
recommendations annually based on best practice.<br />
As principal shareholder (76.49% ownership interest),<br />
the State exercises its ownership in accordance with the<br />
principles in the publication “The State as shareholder”.<br />
shareholder meetings<br />
Shareholder meetings at which management briefs shareholders<br />
on the Group’s activities – within the framework<br />
laid down by law – are held at suitable intervals.<br />
annual General meeting<br />
General meetings are convened by not less than two<br />
weeks’ notice in accordance with the Articles of Association.<br />
At the AGM, the annual report is adopted; an auditor<br />
appointed; a Chairman, Deputy Chairman and other members<br />
of the Board of Directors elected; the Board of Directors’<br />
remuneration determined; the Board of Directors and<br />
the Executive Board discharged from their obligations; and<br />
any resolutions proposed by the Board of Directors on authority<br />
to purchase treasury shares decided on.<br />
Composition of Board of Directors<br />
The Board of Directors consists of 12 members. Eight members<br />
are elected at the AGM and four by the employees.<br />
Details of Board members can be found in the annual<br />
report.<br />
<strong>DONG</strong> <strong>Energy</strong> attaches importance to Board members<br />
possessing extensive knowledge and experience from managerial<br />
posts with large Danish and foreign companies with<br />
a broad range of areas of activity, including in areas directly<br />
related to <strong>DONG</strong> <strong>Energy</strong>’s business areas. In the assessment<br />
of the composition of the Board, the candidates’<br />
skills and background are considered, but also the consid-<br />
manaGEmEnt’s rEviEw – <strong>DONG</strong> ENERGY <strong>ANNUAL</strong> <strong>REPORT</strong> <strong>2011</strong><br />
eration for diversity and an appropriate balance. <strong>DONG</strong><br />
<strong>Energy</strong> has decided not to set an age limit for Board members.<br />
However, the age of potential candidates forms part<br />
of the overall assessment of the Board’s composition.<br />
<strong>DONG</strong> <strong>Energy</strong> is working actively to increase the proportion<br />
of female members on its Board, and this forms<br />
part of the Nomination Committee’s assessment of the<br />
Board’s composition ahead of the AGM.<br />
A Nomination Committee is appointed after the AGM<br />
each year and by 30 September of the following year. Its<br />
main role is to review the Board’s composition and to recommend<br />
suitable candidates for election at the AGM. It<br />
must also ensure that the Board’s composition complies<br />
with the Recommendations on Corporate Governance, including,<br />
to the extent possible, the wish for diversity. The<br />
Committee’s rules of procedure can be found on <strong>DONG</strong><br />
<strong>Energy</strong>’s website.<br />
The Nomination Committee consists of six members.<br />
Each of the four largest registered shareholders is entitled<br />
to elect one member. The other two members are the<br />
Chairman of the Board of Directors, who also chairs the<br />
Committee, and the Deputy Chairman. As most of the<br />
Committee’s members are thus appointed by the company’s<br />
largest shareholder, the Committee has a different<br />
composition than assumed in the Recommendations on<br />
Corporate Governance and thus does not comply with the<br />
Recommendations.<br />
Two of the members elected at the AGM are appointed<br />
by SEAS-NVE and the former shareholders in Elsam under<br />
a provisional shareholders’ agreement between <strong>DONG</strong><br />
<strong>Energy</strong>’s shareholders. None of the Board members elected<br />
at the AGM has had any other association with <strong>DONG</strong> <strong>Energy</strong><br />
than as member of the Board of Directors in companies<br />
that are now part of the Group, and as residential customers<br />
on standard terms, neither in previous years nor in<br />
<strong>2011</strong>. All Board members elected at the AGM retire at the<br />
AGM each year, but may stand for re-election. All Board<br />
members elected at the AGM are independent, except for<br />
one member, who does not satisfy the recommendations<br />
on independence, having been on the board for more than<br />
12 years.
Under Danish legislation, the Group’s employees are<br />
entitled to elect a number of Board members corresponding<br />
to half the number elected at the AGM. These are<br />
elected for three-year terms and have the same rights, duties<br />
and responsibilities as members elected at the AGM.<br />
the duties and responsibilities<br />
of the Board of Directors<br />
<strong>DONG</strong> <strong>Energy</strong>’s overall objectives and strategy are determined<br />
by the Board of Directors, which is also responsible<br />
for appointing a competent Group Executive Management.<br />
The Board of Directors is also responsible for ensuring<br />
clear guidelines for accountability, segregation of duties,<br />
planning, follow-up and risk management. The duties of<br />
the Board and its Chairman are set out in the Board’s rules<br />
of procedure, which are reviewed and updated annually by<br />
the full Board. They were most recently revised in September<br />
<strong>2011</strong>.<br />
The Board met nine times in <strong>2011</strong>.<br />
The Board undertook a structured self-assessment in<br />
<strong>2011</strong> based on assessment forms distributed to each Board<br />
member and subsequent discussion of the responses by<br />
the full Board.<br />
The Board has appointed an Audit and Risk Committee<br />
and a Remuneration Committee.<br />
audit and risk Committee<br />
After the AGM, the Board of Directors appoints the members<br />
of the Audit and Risk Committee, which reports to the<br />
Board of Directors. The Committee’s main role is to support<br />
the Board in its review of the financial reporting, the<br />
annual report and internal accounting and ERP systems.<br />
The Committee also reviews the external auditors’ skills<br />
and independence and is responsible for the conclusion of<br />
engagement agreements with external auditors. The Committee<br />
monitors the Group’s compliance with legislation<br />
and other requirements from public authorities concerning<br />
the company’s annual report, financial reporting and internal<br />
control systems, including control systems relating to<br />
the publication of relevant information. It is also part of the<br />
Committee’s remit to monitor issues relating to the risk<br />
policy laid down by the Board of Directors, from a financial<br />
and an accounting point of view.<br />
Furthermore, the Committee discusses accounting procedures<br />
with the external auditors, evaluates their work,<br />
establishes whistleblowing procedures and undertakes<br />
other relevant tasks.<br />
The Audit and Risk Committee consists of four members.<br />
All its members have accounting skills in accordance<br />
with the rules on audit committees in the Danish Act on<br />
Registered and State Authorised Public Accountants. The<br />
Committee met four times in <strong>2011</strong>.<br />
The Committee’s terms of reference can be found on<br />
<strong>DONG</strong> <strong>Energy</strong>’s website.<br />
remuneration Committee<br />
After the AGM, the Board appoints the members of the Remuneration<br />
Committee, which reports to the Board of Directors.<br />
The Committee’s main role includes the preparation<br />
and presentation of recommendations to the Board on<br />
the Group Executive Management’s salaries, bonus and<br />
other components of their service contracts as well as<br />
guidelines governing salaries to senior executives, other<br />
salary and employment conditions, which are submitted to<br />
the Board of Directors, and the Board of Directors’ remuneration,<br />
which is submitted to the shareholders for approval<br />
at the AGM. The Committee met twice in <strong>2011</strong>.<br />
Members of the Board of Directors and the Group Executive<br />
Management may not buy shares in <strong>DONG</strong> <strong>Energy</strong>,<br />
and <strong>DONG</strong> <strong>Energy</strong> has not issued any options or warrants.<br />
Details of the remuneration of the members of the Board of<br />
Directors and the Group Executive Management can be<br />
found in a note to the consolidated financial statements.<br />
<strong>DONG</strong> <strong>Energy</strong>’s remuneration policy was adopted at the<br />
company’s AGM in April <strong>2011</strong> and can be found on <strong>DONG</strong><br />
<strong>Energy</strong>’s website.<br />
The Remuneration Committee has three members.<br />
The Committee’s terms of reference can be found on<br />
<strong>DONG</strong> <strong>Energy</strong>’s website.<br />
Group Executive management<br />
The Group Executive Management is responsible for the<br />
day-to-day management of the company and consisted of<br />
six persons at the end of <strong>2011</strong>. Details of the Executive<br />
Board can be found in the annual report. The CEO and CFO<br />
are registered with the Danish Business Authority as members<br />
of the Executive Board of <strong>DONG</strong> <strong>Energy</strong> A/S. The<br />
Board of Directors lays down the detailed rules for the<br />
Group Executive Management, including the segregation<br />
of duties between the Board of Directors and the Group Executive<br />
Management and the latter’s powers to enter into<br />
agreements on behalf of the company.<br />
Diversity<br />
<strong>DONG</strong> <strong>Energy</strong> has drawn up policies for diversity, older<br />
workers, bullying and harassment and is currently focusing<br />
on four key action areas: age, gender, nationality and CSR.<br />
<strong>DONG</strong> <strong>Energy</strong> has thus started initiatives that aim to<br />
retain its ageing workforce longer so that their knowledge<br />
remains in the organisation. The age distribution in the<br />
Group will be monitored via annual surveys.<br />
<strong>DONG</strong> <strong>Energy</strong> has signed a charter for more women in<br />
management, and the Group is working with other large<br />
companies and the Danish Ministry of Finance on a network<br />
for female managers. Since 2008, <strong>DONG</strong> <strong>Energy</strong> has<br />
achieved a marked increase in the number of women<br />
among its Top 250 managers from 8% to 22% (<strong>2011</strong>).<br />
In relation to nationalities, <strong>DONG</strong> <strong>Energy</strong> has initiated<br />
measures to attract foreign workers to Denmark.<br />
In the CSR area, <strong>DONG</strong> <strong>Energy</strong> has initiated collaboration<br />
with Disabled Peoples Organisations Denmark (Danske<br />
Handicaporganisationer) and the Association for Integration<br />
of New Danes (Foreningen Nydansker) to ensure<br />
that <strong>DONG</strong> <strong>Energy</strong> recruits as widely as possible.<br />
<strong>DONG</strong> ENERGY <strong>ANNUAL</strong> <strong>REPORT</strong> <strong>2011</strong> – manaGEmEnt’s rEviEw 53
InteRnal contRol AND RISK MANAGEMENT<br />
54<br />
Internal control and risk management<br />
in connection with the financial reporting<br />
<strong>DONG</strong> <strong>Energy</strong>’s internal control and risk management in<br />
connection with its financial reporting are planned with a<br />
view to presenting financial statements that are in accordance<br />
with International Financial Reporting Standards<br />
(IFRS) as adopted by the EU and additional Danish disclosure<br />
requirements for listed and State-owned public limited<br />
companies.<br />
The internal control and risk management system is designed<br />
to ensure that material errors or irregularities in the<br />
financial reporting are prevented or detected and corrected<br />
to ensure that interim financial reports and the annual report<br />
give a true and fair view without material misstatement.<br />
<strong>DONG</strong> <strong>Energy</strong> has used the internationally recognised<br />
COSO framework as a basis for its work on risk management<br />
and determination of internal control in connection<br />
with the financial reporting.<br />
Control environment<br />
The Board of Directors and the Executive Board have the<br />
overall responsibility for the Group’s risk management and<br />
internal control in connection with the financial reporting.<br />
The Board of Directors’ and Executive Board’s approach to<br />
good risk management and internal control in connection<br />
with the financial reporting is continuously being promoted<br />
in <strong>DONG</strong> <strong>Energy</strong>.<br />
The Audit and Risk Committee supports the Board of<br />
Directors in its work. The Audit and Risk Committee monitors<br />
the financial reporting process and reviews material<br />
key risks in it. The Audit and Risk Committee also monitors<br />
the development in the internal control and risk management<br />
systems as well as the ongoing reporting on assessed<br />
risks and internal controls from the business areas. Reference<br />
is made to the Audit and Risk Committee section for<br />
further details on the Committee’s tasks.<br />
The Executive Board is responsible for ensuring that internal<br />
control and risk management systems are effective<br />
and that controls have been implemented to address risks<br />
relating to the financial reporting. For jointly controlled operations<br />
and entities, such requirements are determined<br />
and approved in collaboration with the partners in the operations<br />
and entities in question. Managers at different levels<br />
are responsible for the internal control and risk management<br />
in their respective areas.<br />
The Board of Directors and the Executive Board approve<br />
<strong>DONG</strong> <strong>Energy</strong>’s overall policies and guidelines in key ar-<br />
manaGEmEnt’s rEviEw – <strong>DONG</strong> ENERGY <strong>ANNUAL</strong> <strong>REPORT</strong> <strong>2011</strong><br />
eas. Determination of overall policies and guidelines is<br />
based on a clearly defined organisational structure, clear<br />
reporting lines, authorisation and approval procedures and<br />
segregation of duties. The overall policies and other management-approved<br />
guidelines include finance policy, IT security<br />
policy, policy for responsible business practices,<br />
whistleblower policy, etc.<br />
Based on these policies, the business areas issue more<br />
detailed guidelines and monitor the application of policies<br />
and procedures.<br />
risk assessment<br />
An overall risk assessment, during which management<br />
identifies and reviews the items and processes that involve<br />
a risk of material errors in the financial statements, is performed<br />
at least once a year. Input for this risk assessment<br />
is provided partly through dialogue with the business areas<br />
on the business procedures and processes that form the<br />
basis of the financial reporting and on the risks inherent in<br />
this, and partly through discussions with the external auditor.<br />
As part of the risk assessment, the risk of fraud and the<br />
measures put in place to mitigate this risk are evaluated.<br />
Furthermore, any opportunities for the day-to-day management<br />
to override controls and manipulate the financial<br />
statements are assessed. Based on an assessment of materiality<br />
and risk, the items and companies that need to be<br />
comprised by reporting on internal control are identified.<br />
Material risks in connection with <strong>DONG</strong> <strong>Energy</strong>’s financial<br />
reporting are described in note 2 to the consolidated<br />
financial statements on critical accounting estimates and<br />
judgements, to which reference is made.<br />
Control activities<br />
The control activities in place are designed to prevent or<br />
detect and correct material errors in the financial statements.<br />
The control activities are based on the risk assessment<br />
and comprise approvals, segregation of duties, analyses,<br />
reconciliation and controls relating to IT applications<br />
and general IT controls, etc.<br />
<strong>DONG</strong> <strong>Energy</strong> has established a reporting process for<br />
identification of material risks and has performed internal<br />
control in relation to the risks assessed. Material risks and<br />
internal controls mapping these risks are compiled in control<br />
catalogues for the Group’s business areas. Material<br />
risks and controls included in the business areas’ control<br />
catalogues are reassessed at least once a year.
information and communication<br />
<strong>DONG</strong> <strong>Energy</strong>’s information and communication system is<br />
designed to ensure timely and reliable information on operational,<br />
financial and compliance-related matters. The information<br />
and communication system is also designed to enable<br />
timely communication across the entire organisation.<br />
The information and communication system relating to the<br />
financial reporting includes:<br />
• financial management systems<br />
• consolidation system<br />
• system for reporting on internal controls<br />
• fixed meeting structures<br />
• various internal networks<br />
To ensure that the reporting for the consolidated financial<br />
statements is carried out on a uniform basis and is of a<br />
high quality, a financial reporting manual, reporting instructions,<br />
guidelines for the performance of internal controls,<br />
etc., have been prepared that are available to relevant<br />
employees. Changes to these and focus areas are communicated<br />
on a continuous basis via conferences, meetings<br />
with the business areas and via a number of internal networks.<br />
For example, a finance network, an accounting network,<br />
a network for internal control, etc., have been set up.<br />
monitoring<br />
The monthly financial reporting from the business areas is<br />
analysed and monitored by the business areas’ controllers<br />
and management. The business areas’ reporting and the<br />
overall consolidated financial statements are controlled at<br />
corporate level.<br />
To ensure that the internal control and risk management<br />
system is firmly embedded in the business areas, and<br />
to strengthen the reporting process on internal control and<br />
the monitoring of same, <strong>DONG</strong> <strong>Energy</strong> implemented an IT-<br />
based reporting system on internal controls in <strong>2011</strong>. The<br />
business areas’ control catalogues have been incorporated<br />
in the system, and reporting on internal control performed<br />
is now taken care of directly in the reporting system by the<br />
controller performing the control. The persons responsible<br />
in the business areas monitor the performance of internal<br />
control in the system and, on a quarterly basis, report a<br />
conclusion in summary form on the internal control performed<br />
supplemented by any action plans for identified<br />
weaknesses. The results of the internal control performed<br />
are consolidated in the reporting system and reported to<br />
the Audit and Risk Committee. The reporting forms an important<br />
part of the Board of Directors’ monitoring of the internal<br />
control and risk management system.<br />
<strong>DONG</strong> <strong>Energy</strong> has not established internal auditing, but<br />
has set up the Group Risk Control function, which reports<br />
to the Audit and Risk Committee. Group Risk Control has<br />
11 employees and carries out a series of investigations and<br />
tests, particularly within the financial area and IT use.<br />
Group Risk Control plans the year’s investigations in collaboration<br />
with the Audit and Risk Committee and the external<br />
auditor and reports the results of the investigations<br />
carried out to the Executive Board and the Committee.<br />
the future<br />
Internal control and risk management is a continuous process<br />
that is continually developed and improved so that it<br />
meets the requirements of a growth company at all times.<br />
<strong>DONG</strong> <strong>Energy</strong> will therefore continue to focus on improving<br />
its internal control and risk management systems and its<br />
reporting on same. In 2012, <strong>DONG</strong> <strong>Energy</strong> will focus especially<br />
on aligning its internal controls to the updated COSO<br />
framework and on continuing its efforts to identify risks<br />
and determine internal controls relating to IT applications.<br />
28 of the Group’s companies are<br />
included in the reporting process for<br />
internal control. Based on the internal<br />
controls identified, they represent 86%<br />
of revenue and 66% of assets.<br />
<strong>DONG</strong> ENERGY <strong>ANNUAL</strong> <strong>REPORT</strong> <strong>2011</strong> – manaGEmEnt’s rEviEw 55
BoaRd of dIRectoRs <strong>2011</strong><br />
52 56<br />
CORPORATE GOVERNANCE<br />
<strong>DONG</strong> <strong>Energy</strong>’s Board of Directors and Executive<br />
Board continually strive to improve its corporate<br />
governance. The Board of Directors and the Executive<br />
Board endeavour to enhance transparency and<br />
promote active ownership, partly by ensuring a<br />
high information level and engaging in dialogue<br />
with shareholders and other relevant stakeholders.<br />
As a State-owned public limited company, <strong>DONG</strong><br />
<strong>Energy</strong> operates on terms very similar to those<br />
applying to listed companies. The Group has<br />
therefore elected to generally comply with the<br />
recommendations of the Committee on Corporate<br />
G overnance that apply to listed companies.<br />
The recommendations can be viewed at<br />
www.corporategovernance.dk.<br />
In accordance with section 107(c) of the Danish<br />
Financial Statements Act, <strong>DONG</strong> <strong>Energy</strong>’s Board of<br />
Directors has prepared a statement on corporate<br />
governance. The statement forms an integral part<br />
of management’s review for the financial year 1<br />
January – 31 December <strong>2011</strong>, and is included in the<br />
complete annual report on pages 52-55.<br />
The statement includes a description of <strong>DONG</strong><br />
<strong>Energy</strong>’s management structure, information on<br />
the company’s positions on ’Recommendations on<br />
Corporate Governance’ and a description of the<br />
principal elements of <strong>DONG</strong> <strong>Energy</strong>’s internal control<br />
and risk management systems in connection<br />
with the financial reporting.<br />
28 of the Group’s companies are included in the<br />
reporting process on internal control. Based on the<br />
internal controls identified, these companies represent<br />
86% of revenue and 66% of assets.<br />
manaGEmEnt’s rEviEw – <strong>DONG</strong> ENERGY GROUP <strong>ANNUAL</strong> <strong>ANNUAL</strong> <strong>REPORT</strong> <strong>REPORT</strong> <strong>2011</strong> <strong>2011</strong><br />
fritZ H. sCHur<br />
Chairman<br />
b. 1951. Joined the board as Chairman in 2005,<br />
re-elected <strong>2011</strong>. Term of office expires in 2012.<br />
Chairman of Remuneration Committee and Nomination<br />
Committee.<br />
Education: BSc (Business Administration), Copenhagen<br />
Business School, 1973<br />
Remuneration, Board: DKK 500,000<br />
Remuneration, Committees: DKK 50,000<br />
Career and posts<br />
1973 Formation of FSC A/S (Fritz Schur Consumer<br />
Products A/S)<br />
1978- CEO, Chairman, Deputy Chairman or<br />
member of companies in the Fritz Schur<br />
Group<br />
1988-1996 Reconstruction and winding up of companies<br />
in distress, primarily for banks<br />
Other management positions<br />
Member of the Board of Directors and/or CEO of F. Schur &<br />
Co. A/S, FSS MID ApS, Havnefrontens Selskabslager<br />
909 ApS.<br />
Member of the Board of Directors and CEO of Fritz Schur<br />
A/S and CEO or Chairman of the Board of Directors of two<br />
wholly-owned subsidiaries.<br />
CEO of FS 1 ApS and Chairman of the Board of Directors of<br />
a wholly-owned subsidiary.<br />
CEO of FS 11 ApS and Chairman of the Boards of Directors<br />
of two wholly-owned subsidiaries.<br />
CEO of FS 12 ApS and Deputy Chairman of one directly<br />
and one indirectly wholly-owned subsidiary.<br />
Chairman: SAS AB (Sweden), PostNord AB, F. Uhrenholt<br />
Holding A/S, Relationscore ApS and Chairman of the<br />
Board of a wholly-owned subsidiary, C.P. Dyvig & Co. A/S<br />
Deputy Chairman: Brd. Klee A/S<br />
member: WEPA Industrieholding SE,<br />
Experimentarium – Center for formidling af naturvidenskab<br />
og moderne teknik (foundation)
lars nØrBy JOHansEn<br />
Deputy Chairman<br />
b. 1949. Joined the board in 1997, re-elected <strong>2011</strong>. Deputy<br />
Chairman since 2001. Term of office expires in 2012.<br />
Chairman of Audit and Risk Committee.<br />
Member of Remuneration Committee and Nomination<br />
Committee.<br />
Education: MPhil, Århus University, 1974<br />
Remuneration, Board: DKK 300,000<br />
Remuneration, Committees: DKK 125,000<br />
Career and posts<br />
1974-1983 Odense University, Lecturer in Political<br />
Science and from 1978 Associate Professor<br />
1977-1979 European University Center, Florence (Italy),<br />
Associate Professor<br />
1982 Harvard University, Visiting Fellow<br />
1983-1985 Danish School of Public Administration,<br />
Management Consultant<br />
1986 Danish Insurance Association,<br />
Vice President<br />
1986-1988 Baltica, Claims Manager, Vice President<br />
1988-1995 Falcks Redningskorps A/S and<br />
Falck Holding A/S, CEO<br />
1995-2000 Falck A/S, CEO<br />
2000-2004 Group 4 Falck A/S, CEO<br />
2004-2005 Group 4 Securicor, CEO<br />
Other management positions<br />
Chairman: Falck A/S and a wholly-owned subsidiary,<br />
Georg Jensen A/S, William Demant Holding A/S, Dansk<br />
Vækstkapital, University of Southern Denmark<br />
Deputy Chairman: Rockwool Fonden<br />
member: Codan A/S and a wholly-owned subsidiary, Index<br />
Award A/S, Institut for selskabsledelse Aps, Arp-Hansen<br />
Hotel Group<br />
HannE stEn anDErsEn<br />
Employee representative<br />
b. 1960. Joined the board in 2007. Term of office expires<br />
in 2014.<br />
Education: Graduate Diploma in Business Administration,<br />
Copenhagen Business School, 1990.<br />
Remuneration, Board: DKK 175,000<br />
Career and posts<br />
1985-1992 Industrirådet (replaced by Confederation<br />
of Danish Industry (DI)),<br />
Information Consultant<br />
1992-1998 DI, HR Consultant<br />
1998-2000 Leo Pharma A/S, HR Partner for Production<br />
2000-2003 Danisco A/S, Group HR, HR Consultant<br />
2003- NESA A/S (now <strong>DONG</strong> <strong>Energy</strong> A/S),<br />
Lead HR Business Partner, Sales &<br />
Distribution<br />
JaKOB BrOGaarD<br />
b. 1947. Joined the board in 2007, re-elected <strong>2011</strong>.<br />
Term of office expires in 2012. Member of Audit and Risk<br />
Committee.<br />
Education: Academy Foundation Degree (Management<br />
Accounting and Business Finance), 1976<br />
Remuneration, Board: DKK 175,000<br />
Remuneration, Committees: DKK 50,000<br />
Career and posts<br />
1964-2007 Danske Bank A/S<br />
(member of Executive Committee 1996-2007)<br />
Other management positions<br />
Chairman: FS Finans A/S<br />
Deputy Chairman: LR Realkredit A/S,<br />
Finansiel Stabilitet A/S<br />
member: OW Bunker & Trading A/S, Newco AEP A/S<br />
<strong>DONG</strong> ENERGY <strong>DONG</strong> ENERGY GROUP <strong>ANNUAL</strong> <strong>ANNUAL</strong> <strong>REPORT</strong> <strong>REPORT</strong> <strong>2011</strong> <strong>2011</strong> – – manaGEmEnt’s manaGEmEnt’s rEviEw rEviEw 53 57
BoaRd of dIRectoRs <strong>2011</strong><br />
54 58<br />
BEnny GØBEl<br />
Employee representative<br />
b. 1967. Joined the board in <strong>2011</strong>. Term of office expires<br />
in 2014.<br />
Education: MSc (Civil Engineering), <strong>Energy</strong> Resources<br />
Engineering, Technical University of Denmark (DTU), 1995.<br />
PhD, Technical University of Denmark, 2000.<br />
Remuneration, Board: DKK 175,000<br />
Career and posts<br />
2000-2005 Technical University of Denmark,<br />
Associate Professor<br />
2005- Energi E2 A/S (now <strong>DONG</strong> <strong>Energy</strong> A/S),<br />
Engineer, Thermal Power<br />
JEns Kampmann<br />
b. 1937. Joined the board in 2005, re-elected <strong>2011</strong>.<br />
Term of office expires in 2012. Member of Audit and Risk<br />
Committee and Remuneration Committee.<br />
Education: MSc (Economics), Copenhagen University, 1962<br />
Remuneration, Board: DKK 175,000<br />
Remuneration, Committees: DKK 75,000<br />
Career and posts<br />
1962-1964 Danish Ministry of Education<br />
1964-1971 Danish Ministry of Finance (Ministry of<br />
Economic Affairs)<br />
1966-1978 Member of Danish Parliament and, in 1971,<br />
1972-1973 and 1977-1978, also Minister<br />
1974-1977 Danish Ministry of Finance (Ministry of<br />
Economic Affairs)<br />
1978-1990 Danish Environmental Protection Agency,<br />
Director<br />
1990-2006 Invest Miljø A/S, CEO<br />
Other management positions<br />
Chairman: Frydenholm Holding A/S and a wholly-owned<br />
subsidiary, Dalum Holding A/S, Desmi A/S, Special Waste<br />
Systems A/S<br />
member: White Arkitekter A/S, JKC ApS, Retrocom<br />
Holding A/S, Genan A/S, Genan Business & Development<br />
A/S, Genan Global A/S, Kampus.NU ApS,<br />
Frydenholm Fødevarer A/S<br />
CEO: JKC ApS, Toftøje Invest ApS<br />
manaGEmEnt’s manaGEmEnt’s rEviEw rEviEw – – <strong>DONG</strong> ENERGY GROUP <strong>ANNUAL</strong> <strong>ANNUAL</strong> <strong>REPORT</strong> <strong>REPORT</strong> <strong>2011</strong> <strong>2011</strong><br />
JØrn pEtEr JEnsEn<br />
b. 1964. Joined the board in <strong>2011</strong>. Term of office expires<br />
in 2012. Member of Audit and Risk Committee.<br />
Education: MSc (Economics and Business Administration),<br />
Copenhagen Business School, 1988.<br />
Remuneration, Board: DKK 175,000<br />
Remuneration, Committees: DKK 50,000<br />
Career and posts<br />
1992-1993 Brüel & Kjær, Group Controller<br />
1994-1999 Foss Electric A/S, CFO<br />
1999-2000 Nilfisk Advance A/S, Executive Vice President<br />
and CFO<br />
2000-2001 Carlsberg A/S, CFO<br />
2001-2004 Carlsberg A/S, CEO<br />
2004-2007 Carlsberg Breweries and Carlsberg A/S, CFO<br />
2007- Carlsberg Breweries og Carlsberg A/S,<br />
Deputy CEO and CFO<br />
Other management positions<br />
member of the management: Member of the management<br />
of 27 wholly-owned Danish and foreign subsidiaries of the<br />
Carlsberg Group and member of the management of<br />
Boliginteressentskabet Tuborg<br />
Member of Committe on Corporate Governance<br />
CEO: Ekeløf Invest ApS<br />
JyttE KOED maDsEn<br />
Employee representative<br />
b. 1953. Joined the board in <strong>2011</strong>. Term of office expires<br />
in 2014.<br />
Education: Commercial college, 1973,<br />
Technical Assistant, Faculty of Mechanical Engineering,<br />
1988<br />
Remuneration, Board: DKK 175,000<br />
Career and posts<br />
1988-2004 Skærbækværket, Technical Assistant<br />
2004- Elsam A/S (now <strong>DONG</strong> <strong>Energy</strong> A/S),<br />
Technical Coordinator,<br />
Group Finance & Services
pOul arnE niElsEn<br />
b. 1944. Joined the board in 2006, re-elected <strong>2011</strong>. Term of<br />
office expires in 2012.<br />
Education: Agricultural college, 1968, and MSc (Sports,<br />
Social Science and Business Economics), 1981<br />
Remuneration, Board: DKK 175,000<br />
Career and posts<br />
1982-1998 Høje-Taastrup Upper Secondary School,<br />
Lecturer<br />
1994-2007 Vallø Municipality, Mayor<br />
2007- Stevns Municipality, Mayor<br />
Other management positions<br />
Chairman: SEAS-NVE A.m.b.a. and a wholly-owned subsidiary,<br />
SEAS-NVE Strømmen A/S, Sjællandske Medier<br />
A/S, Dansk Energi<br />
member: Sampension KP Livsforsikring A/S and a whollyowned<br />
subsidiary<br />
lars rEBiEn sØrEnsEn<br />
b. 1954. Joined the board in 2007, re-elected <strong>2011</strong>. Term of<br />
office expires in 2012.<br />
Education: MSc (Forestry) (Royal Veterinary and Agricultural<br />
University, Copenhagen), 1981<br />
Graduate Diploma in International Trade, Copenhagen<br />
Business School, 1983<br />
Remuneration, Board: DKK 175,000<br />
Career and posts<br />
1982- Novo Nordisk A/S, CEO since 2000<br />
Other management positions<br />
member: Bertelsmann AG (Germany), Thermo Fisher<br />
Scientific Inc. (US), Danmarks Nationalbank’s Board of<br />
Directors<br />
JEns nyBO stillinG sØrEnsEn<br />
Employee representative<br />
b. 1968. Joined the board in 2007. Term of office expires<br />
in 2014.<br />
Education: Unskilled<br />
Remuneration, Board: DKK 175,000<br />
Career and posts<br />
1990-2000 SK Power Company A/S<br />
2000- Energi E2 A/S (now <strong>DONG</strong> <strong>Energy</strong> A/S)<br />
Semi-skilled Worker, Thermal Power<br />
mOGEns vintHEr<br />
b. 1947. Joined the board in 2010, re-elected <strong>2011</strong>. Term of<br />
office expires in 2012.<br />
Education: LL.M. (Master of Laws), 1973. Lawyer 1976.<br />
Entitled to appear before the Danish High Court and<br />
Supreme C ourt.<br />
Remuneration, Board: DKK 175,000<br />
Career and posts<br />
1973 Advokatfirma Langberg & Vinther (law firm)<br />
1980- Advokatfirma Langberg & Vinther, partner<br />
Other management positions<br />
Chairman: Fonden Det Gamle Apotek i Ribe, Foreningen<br />
Gammelt Præg - Ribe Bybevaring<br />
member: Syd Energi Holding A/S, Syd Energi A.m.b.a.,<br />
Fonden Ribe Byferie, Fonden til Ribe Bys Forskønnelse<br />
<strong>DONG</strong> ENERGY <strong>DONG</strong> ENERGY GROUP <strong>ANNUAL</strong> <strong>REPORT</strong> <strong>2011</strong> – manaGEmEnt’s rEviEw 55 59
eXecutIVe BoaRd <strong>2011</strong><br />
56 60<br />
CarstEn KrOGsGaarD tHOmsEn<br />
Registered with the Danish Commerce and Companies<br />
Agency as CFO.<br />
b. 1957. CFO since 2002.<br />
Education: MSc (Economics),<br />
Copenhagen University, 1983<br />
Remuneration: DKK 5,708,013<br />
Career and posts<br />
1983-1985 Danish Ministry of the Interior<br />
1985-1986 Danish Ministry of Finance<br />
1986-1988 Andelsbanken<br />
1988-1991 McKinsey, Consultant<br />
1991-1995 Rigshospitalet, Director of Finance<br />
1995-2002 Danish State Railways, CFO<br />
2002- <strong>DONG</strong> <strong>Energy</strong> A/S, CFO<br />
Other management positions<br />
Deputy Chairman:<br />
NNIT A/S<br />
member:<br />
GN Store Nord A/S and two whollyowned subsidiaries<br />
(GN ReSound and GN Netcom)<br />
Chairman of the Audit Committee of GN Store Nord A/S<br />
manaGEmEnt’s rEviEw – <strong>DONG</strong> ENERGY GROUP <strong>ANNUAL</strong> <strong>ANNUAL</strong> <strong>REPORT</strong> <strong>REPORT</strong> <strong>2011</strong> <strong>2011</strong><br />
anDErs ElDrup<br />
Registered with the Danish Commerce and Companies<br />
Agency as CEO<br />
b. 1948. CEO since 2001.<br />
Education: MSc (Political Science),<br />
Århus University,1972<br />
Remuneration: DKK 6,092,882<br />
Career and posts<br />
1972-1973 Office of the Auditor General of Denmark<br />
1973-1980 Danish Ministry of Finance, Principal<br />
1980-1984 Danish Ministry of Finance, Personal<br />
Secretary to Minister<br />
1984-1988 Danish Ministry of Finance, Head of Division<br />
1988-1990 Danish Ministry of Finance, Deputy<br />
Permanent Secretary<br />
1990-1991 Danish Ministry of Finance, Department of<br />
the Budget, Director<br />
1991-2001 Danish Ministry of Finance, Permanent<br />
Secretary<br />
2001- <strong>DONG</strong> <strong>Energy</strong> A/S, CEO<br />
Other management positions<br />
Chairman: Copenhagen Cleantech Cluster<br />
member:<br />
Technical University of Denmark - DTU<br />
Experimentarium - Center for formidling af natur videnskab<br />
og moderne teknik (foundation)<br />
Lindoe Offshore Renewables Center (fund)<br />
Rockwool Fonden<br />
Terma A/S
The Board of Directors and the Executive Board have today<br />
considered and approved the annual report of <strong>DONG</strong> <strong>Energy</strong><br />
A/S for the financial year 1 January – 31 December <strong>2011</strong>.<br />
The annual report is prepared in accordance with International<br />
Financial Reporting Standards as adopted by the<br />
EU and Danish disclosure requirements for listed companies<br />
and State-owned public limited companies.<br />
In our opinion, the Consolidated Financial Statements<br />
and the Parent Company Financial Statements give a true<br />
and fair view of the financial position at 31 December <strong>2011</strong><br />
of the Group and the Parent Company and of the results of<br />
the Group and Parent Company operations and cash flows<br />
for the financial year 1 January – 31 December <strong>2011</strong>.<br />
In our opinion, Management’s Review includes a true<br />
and fair account of the development in the operations<br />
and financial circumstances of the Group and the Parent<br />
Skærbæk, 9 March 2012<br />
Executive Board:<br />
Anders Eldrup Carsten Krogsgaard Thomsen<br />
CEO CFO<br />
Board of Directors:<br />
Company, of the results for the year and of the financial<br />
position of the Group and the Parent Company as well as a<br />
description of the most significant risks and elements of<br />
uncertainty facing the Group and the Parent Company.<br />
<strong>DONG</strong> <strong>Energy</strong>’s non-financial reporting has been prepared<br />
in accordance with the international guidelines for<br />
sustainability reporting from Global Reporting Initiative<br />
with application level B+ (GRI-G3 2006 Guidelines and the<br />
Electric Utilities Sector Supplement). In our opinion, the<br />
non-financial report represents a reasonable and balanced<br />
representation of the Company’s corporate responsibility<br />
and sustainability performance.<br />
We recommend that the annual report be approved at<br />
the Annual General Meeting.<br />
Fritz H. Schur Lars Nørby Johansen Hanne Steen Andersen* Jakob Brogaard<br />
Chairman Deputy Chairman<br />
Benny Gøbel* Jørn P. Jensen Jens Kampmann Jytte Koed Madsen*<br />
Poul Arne Nielsen Jens Nybo Stilling Sørensen* Lars Rebien Sørensen Mogens Vinther<br />
* Employee representative<br />
<strong>DONG</strong> ENERGY <strong>ANNUAL</strong> <strong>REPORT</strong> <strong>2011</strong> – manaGEmEnt’s rEviEw 61<br />
stateMent BY THE ExECUTIVE BOARD AND THE BOARD OF DIRECTORS
consolIdated FINANCIAL STATEMENTS<br />
IndeX of notes<br />
notes<br />
1 Basis of reporting 72<br />
2 Critical accounting estimates and judgements 73<br />
notes to the statement of comprehensive income<br />
3 Segment information 76<br />
4 Revenue 81<br />
5 Fuel and energy 82<br />
6 Staff costs 82<br />
7 Research and development costs 84<br />
8 Fee to auditor appointed at the Annual General Meeting 85<br />
9 Other operating income and expenses 85<br />
10 Government grants 85<br />
11 Finance income 86<br />
12 Finance costs 86<br />
13 Income tax expense 87<br />
14 Earnings per share 88<br />
62 COnsOliDatED finanCial statEmEnts – <strong>DONG</strong> ENERGY <strong>ANNUAL</strong> <strong>REPORT</strong> <strong>2011</strong><br />
notes to the balance sheet<br />
15 Intangible assets 88<br />
16 Property, plant and equipment 92<br />
17 Associates and other securities 95<br />
18 Inventories 96<br />
19 Receivables 97<br />
20 Construction contracts 99<br />
21 Assets classified as held for sale 99<br />
22 Equity 100<br />
23 Deferred tax 102<br />
24 Provisions 104<br />
25 Loans and borrowings 105<br />
26 Interest-bearing debt and capital employed 106<br />
27 Income tax receivable and payable 107
notes to the statement of cash flows<br />
28 Acquisition of enterprises 107<br />
29 Disposal of enterprises 109<br />
30 Transactions with non-controlling interests 110<br />
31 Cash and cash equivalents and securities 111<br />
Other notes<br />
32 Credit and market risks 112<br />
33 Financial instruments 114<br />
34 Jointly controlled entities 122<br />
35 Lease commitments 123<br />
36 Contractual obligations and security arrangements 124<br />
37 Contingent assets and liabilities 124<br />
38 Related party transactions 126<br />
39 Events after the reporting period 127<br />
40 Description of accounting policies 128<br />
41 Licence overview 142<br />
42 Company overview 145<br />
<strong>DONG</strong> ENERGY <strong>ANNUAL</strong> <strong>REPORT</strong> <strong>2011</strong> – COnsOliDatED finanCial statEmEnts<br />
63
consolIdated STATEMENT OF COMPREHENSIVE INCOME<br />
Year ended 31 December<br />
DKK million Note<br />
Business<br />
perfor mance<br />
<strong>2011</strong> 2010<br />
adjustments<br />
IfRs<br />
Business<br />
perfor mance<br />
adjustments<br />
ifrs<br />
Revenue 3, 4, 10 56,842 1,595 58,437 54,616 (18) 54,598<br />
Fuel and energy 5 (31,605) 230 (31,375) (31,408) (28) (31,436)<br />
Other external expenses 7, 8 (7,884) - (7,884) (6,365) - (6,365)<br />
Staff costs 6 (3,593) - (3,593) (2,946) - (2,946)<br />
Other operating income 9, 10 280 - 280 295 - 295<br />
Other operating expenses 9 (270) - (270) (57) - (57)<br />
Operating profi t before depreciation,<br />
amortisation and impairment losses<br />
(EBitDa) 13,770 1,825 15,595 14,135 (46) 14,089<br />
Depreciation, amortisation and impairment<br />
losses on intangible assets and property,<br />
plant and equipment 3, 15, 16 (7,670) - (7,670) (6,015) - (6,015)<br />
Operating profi t (EBit) 6,100 1,825 7,925 8,120 (46) 8,074<br />
Gain on disposal of enterprises 29 225 - 225 905 - 905<br />
Share of profi t of associates 17 36 - 36 77 - 77<br />
Finance income 11 5,811 - 5,811 3,407 - 3,407<br />
Finance costs 12 (6,093) - (6,093) (5,002) - (5,002)<br />
profi t before tax 6,079 1,825 7,904 7,507 (46) 7,461<br />
Income tax expense 13 (3,197) (457) (3,654) (3,008) 11 (2,997)<br />
profi t for the year 2,882 1,368 4,250 4,499 (35) 4,464<br />
Other comprehensive income<br />
Value adjustments for the year (912) (979)<br />
Value adjustments transferred to revenue<br />
Value adjustments transferred to fuel and<br />
300 (1,052)<br />
energy (88) (128)<br />
Value adjustments transferred to net fi nance<br />
costs 147 7<br />
Value adjustments transferred to inventories - (204)<br />
Tax on value adjustments of hedging<br />
instruments 127 599<br />
Foreign exchange adjustments, foreign<br />
enterprises 463 716<br />
Foreign exchange adjustments, equity-like<br />
loans, etc. (216) 36<br />
Tax on foreign exchange adjustments, equitylike<br />
loans, etc. 42 (9)<br />
Other comprehensive income (137) (1,014)<br />
total comprehensive income 4,113 3,450<br />
60 64 COnsOliDatED finanCial statEmEnts – <strong>DONG</strong> ENERGY GROUP <strong>ANNUAL</strong> <strong>ANNUAL</strong> <strong>REPORT</strong> <strong>REPORT</strong> <strong>2011</strong><br />
<strong>2011</strong>
DKK million Note<br />
Business<br />
perfor mance<br />
<strong>2011</strong> 2010<br />
adjustments<br />
IfRs<br />
Business<br />
perfor mance<br />
adjustments<br />
ifrs<br />
profi t for the year is attributable to:<br />
Equity holders of <strong>DONG</strong> <strong>Energy</strong> A/S<br />
Hybrid capital holders of <strong>DONG</strong> <strong>Energy</strong> A/S<br />
2,428 1,368 3,796 4,272 (35) 4,237<br />
(adjusted for tax effect) 269 - 269 334 - 334<br />
Non-controlling interests 22 185 - 185 (107) - (107)<br />
profi t for the year 2,882 1,368 4,250 4,499 (35) 4,464<br />
total comprehensive income for the year is<br />
attributable to:<br />
Equity holders of <strong>DONG</strong> <strong>Energy</strong> A/S<br />
Hybrid capital holders of <strong>DONG</strong> <strong>Energy</strong> A/S<br />
3,422 3,268<br />
(adjusted for tax effect) 269 334<br />
Non-controlling interests 422 (152)<br />
total comprehensive income 4,113 3,450<br />
Earnings per share (EPS) and diluted earnings<br />
per share (DEPS) of DKK 10, in DKK 14 12.92 14.43<br />
<strong>DONG</strong> ENERGY <strong>DONG</strong> ENERGY GROUP <strong>ANNUAL</strong> <strong>REPORT</strong> <strong>2011</strong> – COnsOliDatED finanCial statEmEnts<br />
65<br />
consolIdated STATEMENT OF COMPREHENSIVE INCOME 61
consolIdated BALANCE SHEET<br />
At 31 December<br />
assets<br />
DKK million Note <strong>2011</strong> 2010<br />
Goodwill 373 651<br />
Rights 1,221 1,540<br />
CO 2 emissions allowances 834 182<br />
Completed development projects 279 357<br />
In-process development projects 22 21<br />
intangible assets 3, 15 2,729 2,751<br />
Land and buildings 4,142 2,859<br />
Production assets 65,438 57,502<br />
Exploration assets 1,611 975<br />
Fixtures and fi ttings, tools and equipment 282 205<br />
Property, plant and equipment under construction 23,037 19,144<br />
property, plant and equipment 3, 16 94,510 80,685<br />
Investments in associates 17 3,226 2,919<br />
Other securities and equity investments 17 418 374<br />
Deferred tax 23 181 404<br />
Receivables 19 3,314 2,862<br />
Other non-current assets 7,139 6,559<br />
non-current assets 104,378 89,995<br />
Inventories 18 4,244 3,091<br />
Receivables 19 32,492 31,614<br />
Income tax 27 19 27<br />
Securities 31 9,914 7,620<br />
Cash 31 2,342 4,147<br />
Current assets 49,011 46,499<br />
assets classifi ed as held for sale 21 684 845<br />
assets 154,073 137,339<br />
62 66 COnsOliDatED finanCial statEmEnts – <strong>DONG</strong> ENERGY GROUP <strong>ANNUAL</strong> <strong>ANNUAL</strong> <strong>REPORT</strong> <strong>REPORT</strong> <strong>2011</strong><br />
<strong>2011</strong>
Equity and liabilities<br />
DKK million Note <strong>2011</strong> 2010<br />
Share capital 2,937 2,937<br />
Reserves 7,913 8,287<br />
Retained earnings 27,943 26,278<br />
Proposed dividends 1,457 2,203<br />
Equity attributable to DOnG <strong>Energy</strong> a/s 40,250 39,705<br />
Hybrid capital 9,538 8,088<br />
Non-controlling interests 7,952 3,515<br />
Equity 22 57,740 51,308<br />
Deferred tax 23 9,336 8,188<br />
Pension obligations 6 15 22<br />
Provisions 24 11,936 9,418<br />
Bond loans 25 18,961 22,833<br />
Bank loans 25 15,754 10,673<br />
Other payables 25 2,329 1,688<br />
non-current liabilities 58,331 52,822<br />
Provisions 24 517 444<br />
Bond loans 25 3,717 3,737<br />
Bank loans 25 1,795 660<br />
Other payables 25 30,825 27,584<br />
Income tax 27 763 621<br />
Current liabilities 37,617 33,046<br />
liabilities 95,948 85,868<br />
liabilities associated with assets classifi ed as held for sale 21, 25 385 163<br />
Equity and liabilities 154,073 137,339<br />
<strong>DONG</strong> ENERGY <strong>DONG</strong> ENERGY GROUP <strong>ANNUAL</strong> <strong>REPORT</strong> <strong>2011</strong> – COnsOliDatED finanCial statEmEnts<br />
63 67<br />
consolIdated BALANCE SHEET
consolIdated STATEMENT OF CHANGES IN EQUITY<br />
Year ended 31 December<br />
DKK million Share capital<br />
Hedging reserve<br />
Translation reserve<br />
Share premium<br />
Retained earnings<br />
Proposed dividends<br />
Equity attributable<br />
to equity holders of<br />
<strong>DONG</strong> <strong>Energy</strong> A/S<br />
Equity at 1 January <strong>2011</strong> 2,937 (1,108) 147 9,248 26,278 2,203 39,705 8,088 3,515 51,308<br />
Comprehensive income for<br />
the year<br />
Pro t for the year - - - - 3,796 - 3,796 269 185 4,250<br />
Other comprehensive<br />
income<br />
Value adjustments for the<br />
year - (917) - - - - (917) - 5 (912)<br />
Value adjustments transferred<br />
to revenue - 300 - - - - 300 - - 300<br />
Value adjustments transferred<br />
to fuel and energy - (88) - - - - (88) - - (88)<br />
Value adjustments transferred<br />
to net nance costs - 147 - - - - 147 - - 147<br />
Foreign exchange adjustments,<br />
foreign enterprises - 15 215 - - - 230 - 233 463<br />
Foreign exchange adjustments,<br />
equity-like loans, etc. - - (216) - - - (216) - - (216)<br />
Tax on other comprehensive<br />
income - 128 42 - - - 170 - (1) 169<br />
Total comprehensive<br />
income 0 (415) 41 0 3,796 0 3,422 269 422 4,113<br />
Transactions with owners<br />
Coupon payments, hybrid<br />
capital - - - - - - 0 (515) - (515)<br />
Tax on coupon and costs,<br />
hybrid capital - - - - - - 0 246 - 246<br />
Addition, hybrid capital - - - - - - 0 5,127 - 5,127<br />
Disposal, hybrid capital - - - - - - 0 (3,802) - (3,802)<br />
Adjustments amortisation<br />
original hybrid capital - - - - (125) - (125) 125 - 0<br />
Proposed dividends - - - - (1,457) 1,457 0 - - 0<br />
Dividends paid - - - - - (2,203) (2,203) - (16) (2,219)<br />
Addition, non-controlling<br />
interests - - - - 96 - 96 - 4.080 4,176<br />
Disposal, non-controlling<br />
interests - - - - (41) - (41) - (35) (76)<br />
Adjustments disposals - - - - (604) - (604) - (14) (618)<br />
Changes in equity in <strong>2011</strong> 0 (415) 41 0 1,665 (746) 545 1,450 4,437 6,432<br />
Equity<br />
at 31 December <strong>2011</strong> 2,937 (1,523) 188 9,248 27,943 1,457 40,250 9,538 7,952 57,740<br />
64 68 COnsOliDatED finanCial statEmEnts – <strong>DONG</strong> ENERGY GROUP <strong>ANNUAL</strong> <strong>ANNUAL</strong> <strong>REPORT</strong> <strong>REPORT</strong> <strong>2011</strong><br />
<strong>2011</strong><br />
Hybrid capital<br />
Non-controlling<br />
interests<br />
Total
DKK million Share capital<br />
Hedging reserve<br />
Translation reserve<br />
Share premium<br />
Retained earnings<br />
Proposed dividends<br />
Equity attributable<br />
to equity holders of<br />
<strong>DONG</strong> <strong>Energy</strong> A/S<br />
Equity at 1 January 2010 2,937 658 (650) 9,248 23,944 481 36,618 8,088 102 44,808<br />
Comprehensive income for<br />
the year<br />
Pro t (loss) for the year - - - - 4,237 - 4,237 334 (107) 4,464<br />
Other comprehensive<br />
income<br />
Value adjustments for the<br />
year - (979) - - - - (979) - - (979)<br />
Value adjustments transferred<br />
to revenue - (1,059) - - - - (1,059) - 7 (1,052)<br />
Value adjustments transferred<br />
to fuel and energy - (128) - - - - (128) - - (128)<br />
Value adjustments transferred<br />
to net nance costs - 7 - - - - 7 - - 7<br />
Value adjustments transferred<br />
to inventories - (204) - - - - (204) - - (204)<br />
Foreign exchange adjustments,<br />
foreign enterprises - (2) 770 - - - 768 - (52) 716<br />
Foreign exchange adjustments,<br />
equity-like loans, etc. - - 36 - - - 36 - - 36<br />
Tax on other comprehensive<br />
income - 599 (9) - - 590 - - 590<br />
Total comprehensive<br />
income 0 (1,766) 797 0 4,237 0 3,268 334 (152) 3,450<br />
Transactions with owners<br />
Coupon payments, hybrid<br />
capital - - - - - - 0 (451) - (451)<br />
Tax on coupon hybrid capital - - - - - - 0 117 - 117<br />
Proposed dividends - - - - (2,203) 2,203 0 - - 0<br />
Dividends paid - - - - - (481) (481) - (16) (497)<br />
Addition, non-controlling<br />
interests - - - - 475 - 475 - 3,544 4,019<br />
Disposal, non-controlling<br />
interests - - - - (175) - (175) - 37 (138)<br />
Changes in equity in 2010 0 (1,766) 797 0 2,334 1,722 3,087 0 3,413 6,500<br />
Equity<br />
at 31 December 2010 2,937 (1,108) 147 9,248 26,278 2,203 39,705 8,088 3,515 51,308<br />
Hybrid capital<br />
Non-controlling<br />
interests<br />
<strong>DONG</strong> ENERGY <strong>DONG</strong> ENERGY GROUP <strong>ANNUAL</strong> <strong>REPORT</strong> <strong>2011</strong> – COnsOliDatED finanCial statEmEnts<br />
69 65<br />
Total<br />
consolIdated STATEMENT OF CHANGES IN EQUITY
consolIdated STATEMENT OF CASH FLOWS<br />
Year ended 31 December<br />
DKK million Note <strong>2011</strong> 2010<br />
Operating profi t before depreciation, amortisation and impairment<br />
losses (EBITDA) 15,595 14,089<br />
Other adjustments (1,413) (364)<br />
Interest income and similar items 5,979 3,743<br />
Interest expense and similar items (6,808) (4,864)<br />
Income tax paid 27 (1,647) (106)<br />
Cash fl ows from operating activities before change in<br />
net working capital (ffO) 11,706 12,498<br />
Change in inventories (1,144) 305<br />
Change in trade receivables 1,976 (1,501)<br />
Change in other receivables (949) 696<br />
Change in trade payables 749 1,072<br />
Change in other payables 286 1,144<br />
Change in net working capital 918 1,716<br />
Cash fl ows from operating activities 12,624 14,214<br />
Purchase of intangible assets and property, plant and equipment (17,851) (15,209)<br />
Sale of intangible assets and property, plant and equipment 1,936 939<br />
Acquisition of enterprises 28 (22) (33)<br />
Disposal of enterprises 29 45 2,279<br />
Acquisition of associates 17 (133) (57)<br />
Acquisition of other equity investments 17 (63) (248)<br />
Purchase of securities (8,124) (3,680)<br />
Sale of securities 6,061 1,303<br />
Change in other non-current assets (166) 99<br />
Financial transactions with associates (1,081) (245)<br />
Dividends received and capital reduction 17 60 59<br />
Cash fl ows from investing activities (19,338) (14,793)<br />
Proceeds from raising of loans 9,371 5,226<br />
Instalments on loans (7,121) (2,928)<br />
Coupon payments on hybrid capital (515) (451)<br />
Repurchase of hybrid capital (3,802) -<br />
Proceeds from issuing of hybrid capital 5,127 -<br />
Dividends paid (2,203) (481)<br />
Transactions with non-controlling interests 30 3,945 330<br />
Change in other non-current liabilities 116 (574)<br />
Cash fl ows from fi nancing activities 4,918 1,122<br />
net increase (decrease) in cash and cash equivalents (1,796) 543<br />
Cash and cash equivalents at 1 January 3,625 2,915<br />
Net increase (decrease) in cash and cash equivalents (1,796) 543<br />
Cash classifi ed as held for sale, etc. (352) -<br />
Foreign exchange adjustments of cash and cash equivalents (37) 167<br />
Cash and cash equivalents at 31 December 31 1,440 3,625<br />
66 70 COnsOliDatED finanCial statEmEnts – <strong>DONG</strong> ENERGY GROUP <strong>ANNUAL</strong> <strong>ANNUAL</strong> <strong>REPORT</strong> <strong>REPORT</strong> <strong>2011</strong><br />
<strong>2011</strong>
DKK million Note <strong>2011</strong> 2010<br />
supplementary information<br />
Cash fl ows from investing activities (19,338) (14,793)<br />
Dividends received and capital reduction, reversal (60) (59)<br />
Purchase and sale of securities, reversal 2,063 2,377<br />
Loans to jointly controlled entities, reversal<br />
Sale of property, plant and equipment and intangible assets as<br />
865 -<br />
well as enterprises, reversal (1,981) (3,217)<br />
Gross investments (18,451) (15,692)<br />
Transactions with non-controlling interests, change in interestbearing<br />
balances 19 (535) 3,615<br />
Transactions with non-controlling interests, other 30 3,945 330<br />
Sale of property, plant and equipment and intangible assets as<br />
well as enterprises 1,981 3,217<br />
net investments 1 (13,060) (8,530)<br />
Dividends, net (2,152) (422)<br />
Coupon payments on hybrid capital (515) (451)<br />
Dividends and hybrid capital coupon (2,667) (873)<br />
analysis of change in interest-bearing net debt<br />
Interest-bearing net debt at 1 January 22,139 26,929<br />
Cash fl ows from operating activities (12,624) (14,214)<br />
Net investments 13,060 8,530<br />
Dividends and hybrid capital coupon 2,667 873<br />
Repurchase and issuing of hybrid capital (1,325) -<br />
Foreign exchange adjustments of interest-bearing net debt (302) 21<br />
interest-bearing net debt at 31 December 23,615 22,139<br />
50% of hybrid capital due in 3005 2,206 4,044<br />
adjusted interest-bearing net debt at 31 December 25,821 26,183<br />
1 Net investments are defi ned as the effect on <strong>DONG</strong> <strong>Energy</strong>’s interest-bearing net debt of investments and acquisitions and disposals of enterprises.<br />
Defi nitions of fi nancial highlights are set out on the inside of the back cover.<br />
<strong>DONG</strong> ENERGY <strong>DONG</strong> ENERGY GROUP <strong>ANNUAL</strong> <strong>REPORT</strong> <strong>2011</strong> – COnsOliDatED finanCial statEmEnts<br />
67 71<br />
consolIdated STATEMENT OF CASH FLOWS
notes<br />
01 Basis of reporting<br />
<strong>DONG</strong> <strong>Energy</strong> A/S is a public limited company with its registered<br />
offi ce in Denmark. The annual report for the period 1<br />
January – 31 December <strong>2011</strong> comprises the consolidated fi nancial<br />
statements of <strong>DONG</strong> <strong>Energy</strong> A/S and its subsidiaries (the<br />
Group) as well as separate fi nancial statements for the parent<br />
company, <strong>DONG</strong> <strong>Energy</strong> A/S.<br />
The annual report has been prepared in accordance with<br />
International Financial Reporting Standards (IFRSs) as adopted<br />
by the EU and also complies with International Financial<br />
Reporting Standards issued by the IASB.<br />
The annual report has been prepared in accordance with<br />
Danish disclosure requirements for annual reports of listed<br />
and State-owned public limited companies, see the statutory<br />
order on adoption of IFRS issued pursuant to the Danish<br />
Financial Statements Act.<br />
The annual report is presented in Danish kroner (DKK), rounded<br />
to the nearest million, unless otherwise stated.<br />
The annual report has been prepared on the historical cost<br />
basis except that derivative fi nancial instruments, fi nancial<br />
instruments held for trading, fi nancial instruments classifi ed<br />
as available for sale and CO2 emissions allowances held for<br />
trading are measured at fair value.<br />
Non-current assets and disposal groups classifi ed as held for<br />
sale are stated at the lower of carrying amount before the reclassifi<br />
cation and fair value less costs to sell.<br />
The accounting policies described in note 40 in the complete<br />
annual report have been applied consistently to the fi nancial<br />
year and the comparative fi gures.<br />
Implementation of new standards<br />
and interpretations<br />
In <strong>2011</strong>, <strong>DONG</strong> <strong>Energy</strong> implemented the following standards<br />
(IASs and IFRSs) and interpretations (IFRICs), which are<br />
relevant to <strong>DONG</strong> <strong>Energy</strong> and will apply to reporting periods<br />
beginning on or after 1 January <strong>2011</strong>:<br />
• Revised IAS 24 Related Party Disclosures<br />
• Improvements to IFRSs May 2010<br />
The implementation has not had a material effect on the annual<br />
report for <strong>2011</strong>.<br />
New International Financial Reporting<br />
Standards and IFRIC Interpretations<br />
68 72 COnsOliDatED finanCial statEmEnts – <strong>DONG</strong> ENERGY GROUP <strong>ANNUAL</strong> <strong>ANNUAL</strong> <strong>REPORT</strong> <strong>REPORT</strong> <strong>2011</strong><br />
<strong>2011</strong><br />
The IASB has issued the following new or amended standards<br />
and interpretations that have not yet become effective and are<br />
consequently not mandatory in connection with the preparation<br />
of <strong>DONG</strong> <strong>Energy</strong>’s annual report for <strong>2011</strong>:<br />
adopted by the Eu<br />
• Amendments to IFRS 7 Financial Instruments: Disclosures<br />
<strong>DONG</strong> <strong>Energy</strong> has considered the effect of this fi nancial reporting<br />
standard. This amended standard is not expected to have a<br />
material effect on <strong>DONG</strong> <strong>Energy</strong>’s fi nancial reporting.<br />
not adopted by the Eu<br />
• Amendments to IFRS 7 Disclosures - Offsetting Financial<br />
Assets and Financial Liabilities<br />
• IFRS 9 Financial Instruments<br />
• IFRS 10 Consolidated Financial Statements<br />
• IFRS 11 Joint Arrangements<br />
• IFRS 12 Disclosures of Interests in Other Entities<br />
• IFRS 13 Fair Value Measurement<br />
• IAS 27 Separate Financial Statements<br />
• IAS 28 Investments in Associates and Joint Ventures<br />
• Deferred Tax: Recovery of Underlying Assets: Disclosure<br />
(Amendments to IAS 12)<br />
• Presentation of Items of Other Comprehensive Income<br />
(Amendments to IAS 1)<br />
• Amendments to IAS 19 Employee Benefi ts<br />
• Amendments to IAS 32 Offsetting Financial Assets and<br />
Financial Liabilities<br />
• IFRIC 20: Stripping Costs in the Production Phase of a<br />
Surface Mine<br />
<strong>DONG</strong> <strong>Energy</strong> has started assessing the effect of these fi nancial<br />
reporting standards and expects that IFRS 10 and 11 will<br />
have limited effect on the fi nancial reporting. IFRS 10 and 11<br />
become effective on 1 January 2013.<br />
<strong>DONG</strong> <strong>Energy</strong> expects to implement the new standards and<br />
interpretations from their mandatory effective dates.
02 Critical accounting estimates and judgements<br />
In the process of preparing the consolidated fi nancial statements,<br />
management makes a number of estimates and<br />
judgements that affect the reported amounts of assets and<br />
liabilities at the balance sheet date, the reported amounts of<br />
income and expenses in the reporting period and disclosures<br />
on contingent assets and contingent liabilities at the balance<br />
sheet date.<br />
Estimation uncertainties<br />
Estimates made are based on historical experience and other<br />
factors that are believed by management to be reasonable<br />
under the circumstances, but that, by their nature, are uncertain<br />
and unpredictable. The effect of such estimates and<br />
judgements may lead to results that differ signifi cantly from<br />
those that would result from the use of other judgements and<br />
assumptions.<br />
Again in <strong>2011</strong>, the international fi nancial crisis led to heightened<br />
focus on the estimates made in respect of, for example,<br />
discount rates and expectations concerning the future development<br />
of energy prices and exchange rates to ensure that<br />
the consolidated fi nancial statements are not affected by<br />
short-term fl uctuations that are not expected to apply in the<br />
long term.<br />
Estimates and judgements relating to impairment testing<br />
of intangible assets and property, plant and equipment, and<br />
relating to recoverable oil and gas reserves, have had a signifi -<br />
cant effect on the consolidated fi nancial statements for <strong>2011</strong>.<br />
These areas are described in the following.<br />
impairment testing<br />
<strong>DONG</strong> <strong>Energy</strong> has signifi cant investments in intangible assets<br />
and property, plant and equipment, including primarily<br />
production assets, DKK 65.4 billion (2010: DKK 57.5 billion),<br />
the values of which are sensitive to various factors, including<br />
changes in energy prices, exchange rates, interest rates and<br />
regulatory provisions.<br />
Goodwill and in-process development projects, DKK 0.4 billion<br />
(2010: DKK 0.7 billion), are tested annually for impairment.<br />
Other intangible assets and property, plant and equipment<br />
are tested if there are any indications of impairment. Such<br />
indications may include, for example, long-term changes in<br />
future market conditions, market prices of oil, gas, electricity,<br />
fuel and CO2 , changes in the weighted average cost of capital,<br />
reductions in estimated reserves, or changes in regulatory<br />
provisions.<br />
If a specifi c judgement indicates a possible impairment, and<br />
neither quoted market prices in active markets nor prices of<br />
similar assets are available, discounted cash fl ows are used<br />
to measure the recoverable amount to determine whether the<br />
value of the assets is impaired. The assumptions and criteria<br />
applied to determine the assets’ recoverable amounts constitute<br />
management’s best estimates based on the available<br />
information such as market prices, cost levels, revenue growth<br />
rates and reserve estimates.<br />
Determination of oil and gas reserves<br />
The evaluation of oil and gas reserves affects the assessment<br />
of the recoverable amount and depreciation profi le for <strong>DONG</strong><br />
<strong>Energy</strong>’s Exploration & Production’s assets, DKK 33.1 billion<br />
(2010: DKK 29.0 billion). The assessment of oil and gas<br />
reserves is based on estimates of both proved and probable<br />
reserves (Proved and Probable/2P). Proved reserves are the estimated<br />
volumes of oil and gas that, under existing economic<br />
conditions, are recoverable using known technology from<br />
reservoirs in which oil or gas has been proved. Oil and gas exploration<br />
and extraction technology is undergoing continuous<br />
development. Probable reserves are those additional reserves<br />
that are less likely to be recovered than proved reserves.<br />
<strong>DONG</strong> <strong>Energy</strong> conducts an annual internal evaluation and<br />
review of the Group’s reserves. An independent valuer has<br />
reviewed <strong>DONG</strong> <strong>Energy</strong>’s reserves classifi cation system and<br />
guidelines and has verifi ed that the internal guidelines are in<br />
agreement with the SPE-PRMS directives.<br />
useful lives and residual values for production assets<br />
The expected useful lives and residual values of production assets,<br />
DKK 65.4 billion (2010: DKK 57.5 billion), are determined<br />
based on historical experience and expectations concerning<br />
the future use of these assets. The depreciation profi le for<br />
production assets depends on the type of production asset<br />
and is described in note 40 in the complete annual report. The<br />
expected future applications and residual values may subsequently<br />
prove not to be realisable, which may require useful<br />
lives and residual values to be reviewed and may result in a<br />
need for the recognition of impairment losses or the charging<br />
of a loss on disposal of the assets. The depreciation periods<br />
applied are set out in note 40 in the complete annual report.<br />
investments in associates, other securities and equity<br />
investments, and other non-current investments<br />
Investments in associates, other securities and equity investments,<br />
and other non-current investments, DKK 7.1 billion in<br />
total (2010: DKK 6.6 billion), are tested for impairment if there<br />
are indications of impairment. Such indications may include<br />
changes in regulatory, fi nancial and technological factors and<br />
general market conditions.<br />
<strong>DONG</strong> ENERGY <strong>DONG</strong> ENERGY GROUP <strong>ANNUAL</strong> <strong>REPORT</strong> <strong>2011</strong> – COnsOliDatED finanCial statEmEnts<br />
69 73<br />
notes
notes<br />
02 Critical accounting estimates and judgements<br />
valuation of receivables<br />
Trade receivables etc. total DKK 16.4 billion (2010: DKK 17.2<br />
billion). Write-downs are made for bad and doubtful debts<br />
on the basis of due date and historical experience. These<br />
judgements are subject to uncertainties, as they are based<br />
on assessments of the counterparty’s ability and willingness<br />
to pay. The risk of bad debts remains higher than normal due<br />
to the international fi nancial crisis, and this has been taken<br />
into account in connection with the valuation of the Group’s<br />
receivables.<br />
receivables from the disposal of equity<br />
investments to non-controlling interests<br />
<strong>DONG</strong> <strong>Energy</strong>’s receivables from the disposal of equity investments<br />
to non-controlling interests total DKK 1.4 billion (2010:<br />
DKK 1.8 billion). The contracts entered into in connection with<br />
the disposal of equity investments to non-controlling interests<br />
may contain provisions that are contingent on specifi c future<br />
conditions. The determination of gains and the recognition of<br />
receivables are therefore subject to uncertainty. The gains and<br />
receivables recognised are based on management’s estimates<br />
of the most likely outcomes of future events.<br />
unlisted fi nancial contracts<br />
<strong>DONG</strong> <strong>Energy</strong> has concluded fi nancial contracts based on,<br />
among other things, oil, gas, electricity and coal that are unlisted<br />
and are measured at fair value, including a single longterm<br />
contract that runs until 2020. Fair values are determined<br />
based on fi xed valuation models by reference to market data<br />
and the outlook concerning long-term prices and exchange<br />
rates, etc., each of which is subject to uncertainty. Reference<br />
is made to the information about the fair value hierarchy in<br />
note 33.<br />
Decommissioning obligations<br />
<strong>DONG</strong> <strong>Energy</strong> has signifi cant decommissioning obligations,<br />
DKK 9.4 billion (2010: DKK 7.1 billion). The estimates of the<br />
Group’s decommissioning obligations are updated on a quarterly<br />
basis.<br />
Decommissioning obligations are affected by changes in expected<br />
decommissioning and restoration costs, the future date<br />
on which the costs will be incurred, and offi cial requirements.<br />
Expected decommissioning and restoration costs are based<br />
either on examinations carried out by external experts or internal<br />
estimates. Estimated costs include a risk premium, based<br />
on experience data. The discount rate applied refl ects the general<br />
risk-free interest rate level in the given market<br />
Onerous contracts<br />
In the course of the Group’s operations, a number of commercial<br />
contracts have been entered into with fi xed terms of<br />
70 74 COnsOliDatED finanCial statEmEnts – <strong>DONG</strong> ENERGY GROUP <strong>ANNUAL</strong> <strong>ANNUAL</strong> <strong>REPORT</strong> <strong>REPORT</strong> <strong>2011</strong><br />
<strong>2011</strong><br />
contract that may result in the contracts becoming onerous<br />
depending on market developments, etc., and the liabilities<br />
incurred by the Group as a result of these contracts may also<br />
be subject to uncertainty. The judgements concerning these<br />
complex contracts and their future effects are subject to signifi<br />
cant uncertainties.<br />
Other provisions and contingent items<br />
Management continuously evaluates provisions, DKK 3.1 billion<br />
(2010: DKK 2.7 billion), contingent assets and contingent<br />
liabilities as well as the probable outcome of pending and potential<br />
litigation, etc. The outcome depends on future factors,<br />
which, by their nature, are uncertain. Reference is made to the<br />
description of contingent assets and contingent liabilities in<br />
note 37.<br />
The factors taken into account when exercising a judgement<br />
about a potential liability are the nature of the litigation, claim<br />
or statement. Other factors taken into account are the development<br />
of the case, the judgements and recommendations<br />
of legal or other advisers, experience from similar cases, and<br />
management’s decision on how the Group will react to the litigation,<br />
claim or statement.<br />
The Group is a party to various litigation proceedings. The<br />
decision as to whether a provision should be made in such<br />
disputes requires conclusions to be drawn concerning various<br />
factual and legal matters outside the Group’s control. If the<br />
judgements do not refl ect the subsequent development or the<br />
fi nal outcome of the dispute, this will have a signifi cant impact<br />
on the Group’s future profi ts (losses), balance sheet and cash<br />
fl ows.<br />
Business combinations<br />
No business combinations were recognised in the years 2010<br />
and <strong>2011</strong>.<br />
On acquisitions, the acquiree’s assets, liabilities and contingent<br />
liabilities are recognised at fair value at the acquisition<br />
date. For a signifi cant part of the assets acquired and liabilities<br />
assumed, no effective markets exist on the basis of which the<br />
fair value can be determined. This applies to intangible assets,<br />
in particular. In such cases, fair value is determined using<br />
models that are based on calculations of present values of<br />
future cash fl ows. Management therefore makes estimates in<br />
connection with the determination of the fair value of assets,<br />
liabilities and contingent liabilities acquired. Depending on the<br />
nature of the items, these estimates, and therefore also the fair<br />
values, may be subject to uncertainty and may subsequently<br />
be adjusted.
The excess of the cost of the acquiree over the fair value of the<br />
assets, liabilities and contingent liabilities acquired is recognised<br />
as goodwill and allocated to the cash-generating units,<br />
which subsequently form the basis for impairment testing. In<br />
that connection, management makes estimates of acquired<br />
and existing cash-generating units and the associated allocation<br />
of goodwill.<br />
Judgements in connection<br />
with accounting policies<br />
As part of the Group’s accounting policies, management<br />
makes judgements, apart from those involving estimations,<br />
that may have a signifi cant effect on the consolidated fi nancial<br />
statements. These judgements primarily comprise a) choice<br />
of recognition methods for exploration assets, b) recognition<br />
and classifi cation of derivative fi nancial instruments and commodity<br />
contracts, c) classifi cation of hybrid capital, d) jointly<br />
controlled assets and entities, and e) business combinations.<br />
accounting treatment of exploration<br />
When capitalising exploration costs, <strong>DONG</strong> <strong>Energy</strong> applies<br />
the successful efforts method rather than the full cost method.<br />
Accordingly, general exploration costs and costs for unsuccessful<br />
exploration wells are expensed as incurred. <strong>DONG</strong><br />
<strong>Energy</strong> will therefore have a lower value of exploration assets<br />
than companies that apply the full cost method. At 31<br />
December <strong>2011</strong>, exploration assets amounted to DKK 1.6 billion<br />
(2010: DKK 1.0 billion). Depreciation of production assets<br />
that have been transferred from exploration assets will also be<br />
lower when applying the successful efforts method than when<br />
applying the full cost method.<br />
accounting treatment of derivative fi nancial<br />
instruments and commodity contracts<br />
<strong>DONG</strong> <strong>Energy</strong> hedges commodity, currency and interest rate<br />
risks. These hedging transactions predominantly relate to future<br />
income from the sale of oil, gas and electricity, and costs<br />
for the purchase of coal, gas and CO2. From and including 1<br />
January <strong>2011</strong>, new and existing commodity hedge transactions<br />
and related foreign currency exposures are no longer accounted<br />
for as cash fl ow hedge accounting.<br />
As part of its fi nancial risk management, the Group enters into<br />
transactions to hedge certain physical and fi nancial risks in oil,<br />
gas, coal, electricity, CO2 and related currency exposures. The<br />
Group considers the hedging transactions entered into on the<br />
basis of its internal processes for optimisation of its purchase,<br />
sale and consumption of oil, gas, coal, electricity and CO2 , as<br />
effective economic hedges. Some of the hedging transactions<br />
will meet IAS 39’s criteria for cash fl ow hedge accounting,<br />
while others will not. For this reason, the Group has elected to<br />
no longer apply the provisions on hedge accounting to these<br />
transactions from 1 January <strong>2011</strong>. When determining profi t for<br />
the year, fair value adjustments to these derivative fi nancial<br />
instruments are therefore recognised in the period in which<br />
they arise, regardless of the date of realisation of the hedged<br />
transaction. Value adjustments from fi nancial contracts therefore<br />
have a greater impact on the income statement for <strong>2011</strong><br />
than in previous years.<br />
Contracts to which the Group is a party are reviewed to assess<br />
whether they contain any components that are required to be<br />
recognised and measured as separate fi nancial instruments.<br />
The Group enters into contracts that include price formulas<br />
that are indexed to various energy prices, commodity indices,<br />
etc. Based on a review of these contracts, it has been judged<br />
that the individual components of the contracts feature identical<br />
characteristics and therefore do not differ signifi cantly.<br />
Separation of the individual components of the contracts is<br />
therefore not required, except in the case of the assessment of<br />
hybrid capital.<br />
Under IFRS, contracts that involve physical delivery must,<br />
under certain circumstances, be accounted for as derivative<br />
fi nancial instruments. The classifi cation is determined based<br />
on an evaluation of the purpose of the contract compared<br />
with the Group’s other activities. It is generally assumed that<br />
those of the Group’s contracts that are settled on physical delivery<br />
do not satisfy the criteria for classifi cation as derivative<br />
fi nancial instruments, as they are normal purchase and sale<br />
contracts. By contrast, contracts entered into in the course of<br />
the Group’s trading activities or as part of certain hedging activities<br />
are recognised as derivative fi nancial instruments, even<br />
though they are settled on physical delivery.<br />
accounting treatment of hybrid capital<br />
Hybrid capital, DKK 9.5 billion (2010: DKK 8.1 billion), comprises<br />
issued bonds that have been recognised in a special item<br />
in equity due to the special characteristics of the loan and the<br />
provisions on compound fi nancial instruments. Accordingly,<br />
any coupon payments are accounted for as dividends that<br />
are recognised directly in equity at the time the payment<br />
obligation arises. This is because the coupon payments are<br />
discretionary and relate to the part of the hybrid capital that<br />
is recognised in equity. Coupon payments consequently do<br />
not have any effect on profi t for the year and are recognised in<br />
fi nancing activities in the statement of cash fl ows in the same<br />
way as dividend payments.<br />
Jointly controlled assets and entities<br />
<strong>DONG</strong> <strong>Energy</strong> has opted to recognise the Group’s jointly<br />
controlled assets and entities using proportionate consolidation.<br />
These primarily comprise oil and gas exploration and<br />
production licences, and wind farms and power stations. New<br />
<strong>DONG</strong> ENERGY <strong>DONG</strong> ENERGY GROUP <strong>ANNUAL</strong> <strong>REPORT</strong> <strong>2011</strong> – COnsOliDatED finanCial statEmEnts<br />
75 71<br />
notes
notes<br />
02 Critical accounting estimates and judgments<br />
international fi nancial reporting standards (IFRS 10 and 11) relating<br />
to consolidation and jointly controlled assets will become<br />
effective from and including 2013. The new standards mean<br />
that the option to apply proportionate consolidation to jointly<br />
controlled entities will cease in some cases. In such cases, profi t<br />
must instead be presented as one aggregate amount, in the<br />
same way as the share of profi t (loss) of associates. In the balance<br />
sheet, assets and liabilities relating to jointly controlled<br />
entities must also be presented as a net amount in future, like<br />
investments in associates. This will mainly affect property, plant<br />
and equipment. The new standards are expected to have a limited<br />
effect on <strong>DONG</strong> <strong>Energy</strong>’s fi nancial statements.<br />
Business combinations<br />
In connection with acquisitions, the Group makes judgements<br />
of the contracts concluded in order to determine whether<br />
the acquiree should be classifi ed as a subsidiary, a jointly<br />
controlled entity or an associate. Such judgements are made<br />
on an acquisition-by-acquisition basis based on purchase<br />
contracts concluded, shareholders’ agreements and similar<br />
03 Segment information<br />
Segmentation<br />
Management has defi ned the Group’s operating segments based<br />
on the reporting regularly presented to the Group Executive<br />
Management, and which forms the basis for management’s<br />
strategic decisions. The Group Executive Management adopts a<br />
product-driven approach to the management of activities, managing<br />
each segment differently from a commercial point of view.<br />
With effect from 1 January <strong>2011</strong>, <strong>DONG</strong> <strong>Energy</strong> has elected to no<br />
longer apply the provisions on cash fl ow hedge accounting for<br />
certain derivative fi nancial instruments, see note 40 in the complete<br />
annual report. Accordingly, IFRS no longer refl ects the way<br />
in which management manages the business, and the Group’s<br />
internal management reporting has therefore been adjusted by<br />
the implementation of business performance results. The comparative<br />
fi gures for 2010 have been restated accordingly.<br />
Adjustments between business performance and IFRS consist<br />
of timing differences relating to movements in the market value<br />
of contracts, including hedging transactions, that are deferred to<br />
the period in which they are to be recognised. The adjustments<br />
column will accumulate to nil over time.<br />
Segment income, segment expense, segment assets and segment<br />
liabilities are those items that, in the internal management<br />
agreements, which determine the extent to which control of<br />
the acquiree has been transferred. The classifi cation is important,<br />
as the recognition of proportionately consolidated jointly<br />
controlled entities has a different effect on the fi nancial statements<br />
than full consolidation of a subsidiary or recognition of<br />
an associate using the equity method.<br />
No business combinations were recognised in 2010 and <strong>2011</strong>.<br />
Transactions with non-controlling interests are accounted for as<br />
transactions with the group of owners. If the acquisition of further<br />
ownership interests in a subsidiary results in a difference between<br />
the purchase price and the carrying amount of the acquired<br />
non-controlling interest, the difference is taken directly to equity.<br />
Gains and losses on disposal of equity investments to non-controlling<br />
interests are also recognised in equity to the extent that<br />
the sale does not result in a loss of control. The determination of<br />
whether a sale results in a loss of control relies on judgements on<br />
a case-by-case basis based on contracts concluded.<br />
reporting, are directly attributable to the individual segment<br />
or can be indirectly allocated to the individual segment on a<br />
reliable basis. Other activities primarily comprise income and<br />
expense, assets and liabilities, investing activities, income taxes,<br />
etc., relating to the Group’s administrative functions and certain<br />
initial stages of research and development that do not relate to<br />
the Group’s primary activities.<br />
The Group operates with two performance measures, with<br />
EBITDA as the primary performance measure and EBIT as the<br />
secondary performance measure. For defi nitions of gross investments,<br />
net working capital and capital employed, reference is<br />
made to the explanations of these terms. Intersegment transactions<br />
are priced on arm’s length terms.<br />
Reportable segments comprise the following products and<br />
services:<br />
72 76 COnsOliDatED finanCial statEmEnts – <strong>DONG</strong> ENERGY GROUP <strong>ANNUAL</strong> <strong>ANNUAL</strong> <strong>REPORT</strong> <strong>REPORT</strong> <strong>2011</strong><br />
<strong>2011</strong><br />
• Exploration & production: Oil and gas exploration and production<br />
in Denmark, Norway, the UK, the Faroe Islands and<br />
Greenland as well as an ownership interest in the Gassled<br />
natural gas pipeline network connecting the Norwegian<br />
fi elds with the European continent and the UK.
• wind power: Development, construction and operation of<br />
wind farms in Denmark, the UK, Poland, Norway, Sweden and<br />
Germany as well as an ownership interest in a hydro electric<br />
station in Sweden.<br />
• thermal power: Generation and sale of electricity and heat<br />
from thermal power stations in Denmark as well as ownership<br />
of gas-fi red power stations in the Netherlands and the<br />
UK and a demonstration plant for production of secondgeneration<br />
bioethanol in Denmark.<br />
• <strong>Energy</strong> markets: Optimisation and risk management of<br />
<strong>DONG</strong> <strong>Energy</strong>’s energy portfolio, including trading in natural<br />
gas and electricity with energy producers and wholesale<br />
customers and on European energy hubs and exchanges.<br />
• sales & Distribution: Sales and distribution of electricity<br />
and gas to wholesale and end customers in Denmark,<br />
Germany, the Netherlands and Sweden.<br />
Further details of the Group’s reportable segments are given in<br />
Management’s review.<br />
activities <strong>2011</strong><br />
DKK million Exploration &<br />
Production<br />
External revenue 5,784 3,589 9,711 25,320 12,504 56,908<br />
Intragroup revenue 4,685 723 954 8,369 505 15,236<br />
revenue 10,469 4,312 10,665 33,689 13,009 72,144<br />
EBitDa 5,684 1,799 2,255 1,963 2,027 13,728<br />
Depreciation and amortisation (2,480) (943) (1,562) (585) (1,184) (6,754)<br />
Impairment losses - - 59 (600) (277) (818)<br />
Operating profi t (EBit) 3,204 856 752 778 566 6,156<br />
adjusted operating profi t 1 1,628 861 720 751 584 4,544<br />
1 Adjusted operating profi t is defi ned as EBIT corrected for hydrocarbon tax plus profi t of associates less the interest element of decommissioning<br />
obligations.<br />
Wind Power<br />
Geographical breakdown<br />
<strong>DONG</strong> <strong>Energy</strong> primarily sells products and services in the market<br />
in Northern Europe. A large part of the Group’s sales takes place<br />
via power exchanges and gas hubs in Europe, the physical location<br />
of which does not refl ect the Group’s market risks. Segment<br />
information in respect of geographical markets is determined<br />
by breaking revenue down, as far as possible, by customer location<br />
based on supply point. When delivery is made directly from<br />
production platforms in the North Sea, the fi nal supply point is<br />
not known to <strong>DONG</strong> <strong>Energy</strong>. In such cases, customer location is<br />
defi ned on the basis of invoicing address.<br />
Non-current assets are broken down geographically based on<br />
the physical location of the assets and comprise intangible assets<br />
and property, plant and equipment.<br />
No single customer accounts for more than 10% of consolidated<br />
revenue.<br />
Reference is made to note 4 for a breakdown of the Group’s sales<br />
by products and services.<br />
Thermal Power<br />
<strong>DONG</strong> ENERGY <strong>DONG</strong> ENERGY GROUP <strong>ANNUAL</strong> <strong>REPORT</strong> <strong>2011</strong> – COnsOliDatED finanCial statEmEnts<br />
73 77<br />
<strong>Energy</strong> Markets<br />
Sales &<br />
Distribution<br />
Reportable<br />
segments<br />
notes
notes<br />
03 Segment information<br />
activities <strong>2011</strong> – continued<br />
DKK million Reportable<br />
segments<br />
External revenue 56,908 (66) - 56,842 1,595 58,437<br />
Intragroup revenue 15,236 2,261 (17,497) 0 - 0<br />
revenue 72,144 2,195 (17,497) 56,842 1,595 58,437<br />
EBitDa 13,728 42 - 13,770 1,825 15,595<br />
Depreciation and amortisation (6,754) (98) - (6,852) - (6,852)<br />
Impairment losses (818) - - (818) - (818)<br />
Operating profi t (EBit) 6,156 (56) 0 6,100 1,825 7,925<br />
adjusted operating profi t 4,544 (100) 0 4,444 1,825 6,269<br />
DKK million Exploration &<br />
Production<br />
Wind Power<br />
Thermal Power<br />
Net working capital, external<br />
transactions (951) (2,767) 299 2,717 965 263 (463) 19 (181)<br />
Net working capital, intragroup<br />
transactions 808 (53) (199) (175) (698) (317) 336 (19) 0<br />
net working capital (143) (2,820) 100 2,542 267 (54) (127) 0 (181)<br />
Gross investments (5,626) (10,872) (714) (333) (810) (18,355) (96) - (18,451)<br />
Segment assets 33,087 48,027 33,155 32,625 22,197 169,091 78,275 (93,493) 153,873<br />
Capital employed 18,186 29,443 17,882 6,553 10,944 83,008 (1,653) - 81,355<br />
Adjusted capital employed 1 7,859 13,733 13,785 6,420 9,967 51,764 (1,574) - 50,190<br />
1 Adjusted capital employed is defi ned as capital employed less property, plant and equipment under construction and exploration assets, and less<br />
production assets transferred from property, plant and equipment under construction in the past six months.<br />
Oil and gas exploration expenditure of DKK 997 million has<br />
been recognised in Exploration & Production. Oil and gas exploration<br />
assets and liabilities amounted to DKK 2,758 million<br />
and<br />
Other activities<br />
<strong>Energy</strong> Markets<br />
Sales &<br />
Distribution<br />
74 78 COnsOliDatED finanCial statEmEnts – <strong>DONG</strong> ENERGY GROUP <strong>ANNUAL</strong> <strong>ANNUAL</strong> <strong>REPORT</strong> <strong>REPORT</strong> <strong>2011</strong><br />
<strong>2011</strong><br />
Eliminations<br />
Reportable<br />
segments<br />
Business<br />
performance<br />
Other activities<br />
Adjustments<br />
Eliminations<br />
IfRs<br />
IfRs<br />
DKK 395 million respectively on 31 December <strong>2011</strong>. Operating<br />
and investing cash fl ows arising from oil and gas exploration<br />
absorbed DKK 2,108 million and DKK 984 million respectively.
Geographical breakdown <strong>2011</strong><br />
DKK million Denmark UK Germany Netherlands<br />
activities 2010<br />
DKK million Exploration &<br />
Production<br />
External revenue 5,016 2,510 11,564 21,971 13,739 54,800<br />
Intragroup revenue 3,248 442 167 9,545 446 13,848<br />
revenue 8,264 2,952 11,731 31,516 14,185 68,648<br />
EBitDa 5,051 1,730 2,228 2,959 2,036 14,004<br />
Depreciation and amortisation, excluding<br />
purchased CO 2 emissions allowances (1,950) (771) (1,270) (565) (970) (5,526)<br />
Impairment losses - - (401) - (9) (410)<br />
Operating profi t (EBit) 3,101 959 557 2,394 1,057 8,068<br />
adjusted operating profi t 2,036 979 511 2,386 1,072 6,984<br />
DKK million reportable<br />
segments<br />
Wind Power<br />
Other activities<br />
Thermal Power<br />
Eliminations<br />
<strong>Energy</strong> Markets<br />
Business<br />
performance<br />
Rest<br />
of World<br />
External revenue 54,800 (184) - 54,616 (18) 54,598<br />
Intragroup revenue 13,848 1,780 (15,628) 0 - 0<br />
revenue 68,648 1,596 (15,628) 54,616 (18) 54,598<br />
EBitDa 14,004 131 - 14,135 (46) 14,089<br />
Depreciation and amortisation, excluding<br />
purchased CO 2 emissions allowances (5,526) (79) - (5,605) - (5,605)<br />
Impairment losses (410) - - (410) - (410)<br />
Operating profi t (EBit) 8,068 52 0 8,120 (46) 8,074<br />
adjusted operating profi t 6,984 1 0 6,985 (46) 6,939<br />
Sales &<br />
Distribution<br />
Adjustments<br />
consolidated<br />
total<br />
Revenue 28,646 13,512 8,222 3,747 4,310 58,437<br />
DKK million Denmark UK Norway<br />
Rest<br />
of World<br />
consolidated<br />
total<br />
Intangible assets and property, plant<br />
and equipment 42,428 31,860 17,930 5,021 97,239<br />
<strong>DONG</strong> ENERGY <strong>DONG</strong> ENERGY GROUP <strong>ANNUAL</strong> <strong>REPORT</strong> <strong>2011</strong> – COnsOliDatED finanCial statEmEnts<br />
79 75<br />
reportable<br />
segments<br />
ifrs<br />
notes
notes<br />
03 Segment information<br />
activities 2010 – continued<br />
DKK million Exploration &<br />
Production<br />
Wind Power<br />
Thermal Power<br />
Net working capital, external<br />
transactions (430) (420) 163 2,162 1,953 3,428 (983) 21 2,466<br />
Net working capital, intragroup<br />
transactions 1,099 (49) 28 557 (1,611) 24 (3) (21) 0<br />
net working capital 669 (469) 191 2,719 342 3,452 (986) 0 2,466<br />
Gross investments (4,023) (6,378) (3,853) (477) (858) (15,589) (103) - (15,692)<br />
Segment assets 29,026 35,203 33,522 30,745 22,423 150,919 60,141 (74,152) 136,908<br />
Capital employed 17,122 21,097 19,085 4,327 12,064 73,695 (247) - 73,448<br />
Adjusted capital employed 9,373 12,822 10,144 4,221 11,046 47,606 (1,300) - 46,306<br />
Oil and gas exploration expenditure of DKK 420 million has<br />
been recognised in Exploration & Production. Oil and gas<br />
exploration assets and liabilities amounted to DKK 1,404 million<br />
and DKK 371 million respectively at 31 December 2010.<br />
Geographical breakdown 2010<br />
<strong>Energy</strong> Markets<br />
Sales &<br />
Distribution<br />
DKK million Denmark UK Germany Netherlands<br />
reportable<br />
segments<br />
Other activities<br />
Eliminations<br />
Operating and investing cash fl ows arising from oil and gas<br />
exploration absorbed DKK 625 million and DKK 346 million<br />
respectively.<br />
Rest<br />
of World<br />
ifrs<br />
Consolidated<br />
total<br />
Revenue 31,364 6,226 7,364 6,319 3,325 54,598<br />
DKK million Denmark UK Norway<br />
Rest<br />
of World<br />
Consolidated<br />
total<br />
Intangible assets and property, plant and<br />
equipment 43,348 16,809 18,916 4,363 83,436<br />
76 80 COnsOliDatED finanCial statEmEnts – <strong>DONG</strong> ENERGY GROUP <strong>ANNUAL</strong> <strong>ANNUAL</strong> <strong>REPORT</strong> <strong>REPORT</strong> <strong>2011</strong><br />
<strong>2011</strong>
econciliations<br />
DKK million <strong>2011</strong> 2010<br />
EBitDa for reportable segments<br />
Depreciation, amortisation and impairment losses for reportable segments,<br />
13,728 14,004<br />
excluding purchased CO2 emissions allowances (7,572) (5,936)<br />
EBit for reportable segments 6,156 8,068<br />
EBIT other activities (56) 52<br />
EBit business performance 6,100 8,120<br />
Adjustments (from business performance to IFRS) 1,825 (46)<br />
EBit ifrs, see consolidated statement of comprehensive income, page 60 7,925 8,074<br />
Gain on disposal of enterprises 225 905<br />
Share of profi t of associates 36 77<br />
Net fi nance costs (282) (1,595)<br />
profi t before tax, see consolidated statement of comprehensive income, page 60 7,904 7,461<br />
segment assets for reportable segments 169,091 150,919<br />
Assets, other activities 78,275 60,141<br />
Assets, eliminations (93,493) (74,152)<br />
Deferred tax 181 404<br />
Income tax receivable 19 27<br />
total assets, see consolidated balance sheet, page 62 154,073 137,339<br />
04 Revenue<br />
Business performance IFRS<br />
DKK million <strong>2011</strong> 2010 <strong>2011</strong> 2010<br />
Sales and transportation of natural gas 23,308 23,464 24,993 23,464<br />
Sales and transportation of oil 5,769 4,356 5,769 4,356<br />
Sales of electricity 16,376 15,217 15,757 14,981<br />
Sales of district heat 2,532 2,701 2,532 2,701<br />
Distribution and storage of natural gas 1,387 1,210 1,387 1,210<br />
Distribution of electricity 3,281 3,444 3,281 3,444<br />
Construction contracts 483 469 483 469<br />
Trading activities, net 633 478 633 478<br />
Effect of economic hedges, net 38 723 897 (111)<br />
Effect of hedge accounting, net - - (330) 1,052<br />
Other revenue 3,035 2,554 3,035 2,554<br />
revenue 56,842 54,616 58,437 54,598<br />
<strong>DONG</strong> ENERGY <strong>DONG</strong> ENERGY GROUP <strong>ANNUAL</strong> <strong>REPORT</strong> <strong>2011</strong> – COnsOliDatED finanCial statEmEnts<br />
77 81<br />
notes
notes<br />
05 Fuel and energy<br />
Business performance IFRS<br />
DKK million <strong>2011</strong> 2010 <strong>2011</strong> 2010<br />
Natural gas (17,540) (17,850) (17,540) (17,850)<br />
Electricity (5,466) (5,023) (5,466) (5,023)<br />
Coal (2,000) (1,982) (2,000) (1,982)<br />
Biomass (1,256) (1,343) (1,256) (1,343)<br />
Oil (220) (320) (220) (320)<br />
Transportation costs, etc. (3,320) (3,609) (3,320) (3,609)<br />
Economic hedging (32) (208) 157 (364)<br />
Hedge accounting - - 41 128<br />
Costs associated with construction<br />
contracts (223) - (223) -<br />
Other cost of sales (1,548) (1,073) (1,548) (1,073)<br />
fuel and energy (31,605) (31,408) (31,375) (31,436)<br />
06 Staff costs<br />
DKK million <strong>2011</strong> 2010<br />
Wages, salaries and remuneration (3,669) (3,246)<br />
Pensions (312) (295)<br />
Other social security costs (83) (66)<br />
Other staff costs (39) (36)<br />
staff costs before transfer to assets (4,103) (3,643)<br />
Transfer to assets 510 697<br />
staff costs (3,593) (2,946)<br />
The Group’s pension plans are primarily defi ned contribution<br />
plans that do not commit <strong>DONG</strong> <strong>Energy</strong> beyond the amounts<br />
contributed. The defi ned benefi t plans relate to obligations to<br />
pay a defi ned benefi t to a few power station employees that<br />
are no longer with the company and to public servants taken<br />
78 82 COnsOliDatED finanCial statEmEnts – <strong>DONG</strong> ENERGY GROUP <strong>ANNUAL</strong> <strong>ANNUAL</strong> <strong>REPORT</strong> <strong>REPORT</strong> <strong>2011</strong><br />
<strong>2011</strong><br />
over from municipally owned regional companies. In <strong>2011</strong>,<br />
these obligations amounted to DKK 15 million (2010: DKK 22<br />
million). The average number of employees in <strong>DONG</strong> <strong>Energy</strong> in<br />
<strong>2011</strong> was 5,966 (2010: 5,800 employees).
emuneration of Board of Directors, Executive Board and other senior executives in <strong>2011</strong><br />
DKK ‘000 Salaries Bonus Pension total<br />
parent company Board of Directors:<br />
Chairman (500) - - (500)<br />
Deputy Chairman (300) - - (300)<br />
Other members1 (1,838) - - (1,838)<br />
audit and risk Committee:<br />
Chairman (100) - - (100)<br />
Other members2 (138) - - (138)<br />
remuneration Committee:<br />
Chairman (50) - - (50)<br />
Other member (44) - - (44)<br />
Executive Board and other senior<br />
executives in the Group:<br />
CEO (5,006) (1,084) (2) (6,092)<br />
CFO (4,565) (1,141) (2) (5,708)<br />
Other senior executives in the Group (12,956) (3,014) (1,931) (17,901)<br />
remuneration (25,497) (5,239) (1,935) (32,671)<br />
1 Annual remuneration was DKK 175 thousand per member in <strong>2011</strong>.<br />
2 Annual remuneration was DKK 50 thousand per member in <strong>2011</strong>.<br />
At 31 December <strong>2011</strong>, the Executive Board and other senior executives<br />
consisted of six persons in total (2010: six persons).<br />
<strong>DONG</strong> <strong>Energy</strong> has prepared a remuneration policy for the<br />
remuneration of the Board of Directors and for the Executive<br />
Board registered with the Danish Business Authority, and<br />
overall guidelines for incentive pay for these offi cers were<br />
adopted at <strong>DONG</strong> <strong>Energy</strong>’s Annual General Meeting in January<br />
2008. Both the remuneration policy and the overall guidelines<br />
for incentive pay can be viewed on <strong>DONG</strong> <strong>Energy</strong>’s website.<br />
Remuneration of the Board of Directors and of the Executive<br />
Board registered with the Danish Business Authority complied<br />
with the remuneration policy and the overall guidelines for<br />
incentive pay in <strong>2011</strong>.<br />
The service contract of the CEO includes a termination package<br />
under which he will be entitled to salary equivalent to<br />
33½ months’ salary, including pension, if his service contract<br />
is terminated by the company (2010: 33½ months) consisting<br />
of salary during the notice period (12 months) and termination<br />
benefi t (21½ months).<br />
The CFO and the Group’s other senior executives will be entitled<br />
to 24 months’ salary, including pension, if their contracts<br />
of service are terminated by the company (2010: 24 months)<br />
consisting of salary during the notice period (12 months) and<br />
termination benefi t (12 months).<br />
Further details of the Group Executive Management are provided<br />
in the Corporate governance sections on pages 52-53<br />
and the section on the Board of Directors and the Group Executive<br />
Management on pages 56-60 of Management’s review.<br />
<strong>DONG</strong> ENERGY <strong>DONG</strong> ENERGY GROUP <strong>ANNUAL</strong> <strong>REPORT</strong> <strong>2011</strong> – COnsOliDatED finanCial statEmEnts<br />
83 79<br />
notes
notes<br />
06 Staff costs<br />
remuneration of Board of Directors, Executive Board and other senior executives in 2010<br />
DKK ‘000 Salaries Bonus Pension total<br />
parent company Board of Directors:<br />
Chairman (500) - - (500)<br />
Deputy Chairman (300) - - (300)<br />
Other members1 (1,706) - - (1,706)<br />
audit and risk Committee:<br />
Chairman (100) - - (100)<br />
Other members2 (100) - - (100)<br />
remuneration Committee:<br />
Chairman (50) - - (50)<br />
Other member (25) - - (25)<br />
Executive Board and other senior<br />
executives in the Group:<br />
CEO (4,822) (827) (2) (5,651)<br />
CFO (4,399) (1,198) (2) (5,599)<br />
Other senior executives in the Group (12,930) (1,889) (1,658) (16,477)<br />
remuneration (24,932) (3,914) (1,662) (30,508)<br />
1 Annual remuneration was DKK 175 thousand per member in 2010.<br />
2 Annual remuneration was DKK 50 thousand per member in 2010.<br />
07 Research and development costs<br />
DKK million <strong>2011</strong> 2010<br />
Research and development costs incurred during the year<br />
Amortisation and impairment losses on development costs<br />
(669) (821)<br />
recognised in intangible assets (105) (97)<br />
Development costs recognised in intangible assets 48 137<br />
research and development costs recognised in profi t for the year (726) (781)<br />
Research and development costs incurred in <strong>2011</strong> comprised<br />
primarily development of wind farms in Denmark, the UK,<br />
Germany and Poland, development of bioethanol technology,<br />
biogas technology and biomass conversion as well as IT<br />
80 84 COnsOliDatED finanCial statEmEnts – <strong>DONG</strong> ENERGY GROUP <strong>ANNUAL</strong> <strong>ANNUAL</strong> <strong>REPORT</strong> <strong>REPORT</strong> <strong>2011</strong><br />
<strong>2011</strong><br />
systems. In 2010, research and development costs primarily<br />
included development of wind farms in Denmark, development<br />
of thermal generation, bioethanol technology and IT systems.
08 Fee to auditor appointed at the Annual General Meeting<br />
DKK million <strong>2011</strong> 2010<br />
Audit fees (12) (12)<br />
Other assurance engagements (2) (1)<br />
Tax and VAT advice (7) (6)<br />
Non-audit services (30) (7)<br />
total fees to pricewaterhouseCoopers (51) (26)<br />
09 Other operating income and expenses<br />
DKK million <strong>2011</strong> 2010<br />
Gain on sale of intangible assets and property, plant and equipment 165 184<br />
Miscellaneous operating income 115 111<br />
Other operating income 280 295<br />
Loss on sale of intangible assets and property, plant and equipment (229) (46)<br />
Miscellaneous operating expenses (41) (11)<br />
Other operating expenses (270) (57)<br />
Other operating income and expenses, net 10 238<br />
The gain on sale of intangible assets and property, plant and<br />
equipment comprised primarily sale of the Gunfl eet Sands<br />
and Barrow Offshore Wind offshore wind farm transmission<br />
networks and 50% of the Walney network (Walney 1). The loss<br />
10 Government grants<br />
on sale of intangible assets and property, plant and equipment<br />
was attributable to a loss on scrapping of production assets on<br />
the Gyda oil fi eld. The gain in 2010 comprised primarily Nysted<br />
Offshore Wind Farm 1.<br />
DKK million <strong>2011</strong> 2010<br />
Government grants recognised in profi t for the year as revenue 311 315<br />
Government grants recognised in profi t for the year as other operating income 21 20<br />
Government grants recognised in the balance sheet 4 (15)<br />
Government grants recognised during the year 336 320<br />
Grants recognised as revenue related to electricity generation<br />
based on biomass and waste, and natural gas at small-scale<br />
power stations.<br />
<strong>DONG</strong> <strong>Energy</strong> also received grants for feasibility studies in<br />
connection with the establishment of installations and for<br />
the construction of facilities. Government grants received<br />
have been recognised in liabilities and transferred to other<br />
operating income as the assets to which the grants relate are<br />
depreciated.<br />
<strong>DONG</strong> ENERGY <strong>DONG</strong> ENERGY GROUP <strong>ANNUAL</strong> <strong>REPORT</strong> <strong>2011</strong> – COnsOliDatED finanCial statEmEnts<br />
85 81<br />
notes
notes<br />
11 Finance income<br />
DKK million <strong>2011</strong> 2010<br />
Interest income from cash, etc. 642 356<br />
Interest income and capital gains on securities at fair value 513 376<br />
Foreign exchange gains 2,815 2,531<br />
Value adjustments of derivative fi nancial instruments 1,818 137<br />
Other fi nance income 23 7<br />
finance income 5,811 3,407<br />
12 Finance costs<br />
DKK million <strong>2011</strong> 2010<br />
Interest expense relating to payables (1,921) (2,227)<br />
Transfers to assets 373 328<br />
Interest element of decommissioning obligations (176) (196)<br />
Capital loss on securities at fair value (22) (73)<br />
Foreign exchange losses (2,658) (2,677)<br />
Value adjustments of derivative fi nancial instruments (1,654) (152)<br />
Other fi nance costs (35) (5)<br />
finance costs (6,093) (5,002)<br />
Foreign exchange adjustments are recognised in revenue and<br />
cost of sales for the year with DKK 340 million (2010: DKK 253<br />
million) and in profi t for the year with DKK 497 million (2010:<br />
DKK 107 million).<br />
82 86 COnsOliDatED finanCial statEmEnts – <strong>DONG</strong> ENERGY GROUP <strong>ANNUAL</strong> <strong>ANNUAL</strong> <strong>REPORT</strong> <strong>REPORT</strong> <strong>2011</strong><br />
<strong>2011</strong><br />
Borrowing costs transferred to assets under construction were<br />
calculated at the weighted average effective interest rate for<br />
general borrowing, which was 4.42% (2010: 4.46%).
13 Income tax expense<br />
DKK million <strong>2011</strong> 2010<br />
Income tax expense (3,654) (2,997)<br />
Tax on other comprehensive income 169 590<br />
tax for the year (3,485) (2,407)<br />
tax for the year can be broken down as follows:<br />
Current tax (income tax and hydrocarbon tax) calculated applying normal tax rates (1,218) (1,145)<br />
Current tax, hydrocarbon tax calculated applying higher tax rate (1,076) (568)<br />
Deferred tax, calculated applying normal tax rates (1,021) (810)<br />
Deferred tax, hydrocarbon tax calculated applying higher tax rate (439) (448)<br />
Effect of reduction of income tax rate (4) 1<br />
Adjustments to current tax in respect of prior years 85 (65)<br />
Adjustments to deferred tax in respect of prior years 19 38<br />
income tax expense (3,654) (2,997)<br />
<strong>2011</strong> dkk million %<br />
income tax expense can be explained as follows:<br />
Calculated 25% tax on profi t before tax (1,976) 25<br />
Adjustments of calculated income tax in foreign subsidiaries in relation to 25% (92) 1<br />
Hydrocarbon tax<br />
tax effect of:<br />
(1,515) 19<br />
Non-taxable income 107 (2)<br />
Capitalisation of tax assets not previously capitalised 77 (1)<br />
Non-deductible expenses (161) 2<br />
Unrecognised tax assets (126) 2<br />
Effect of reduction of income tax rate (4) -<br />
Share of profi t of associates 9 -<br />
Adjustments to tax in respect of prior years 27 -<br />
Effective tax for the year (3,654) 46<br />
2010 DKK million %<br />
income tax expense can be explained as follows:<br />
Calculated 25% tax on profi t before tax (1,865) 25<br />
Adjustments of calculated income tax in foreign subsidiaries in relation to 25% (62) 1<br />
Hydrocarbon tax<br />
tax effect of:<br />
(1,017) 14<br />
Non-taxable income 283 (4)<br />
Capitalisation of tax assets not previously capitalised (26) -<br />
Non-deductible expenses (256) 3<br />
Unrecognised tax assets (73) 1<br />
Share of profi t of associates 19 -<br />
Effective tax for the year (2,997) 40<br />
<strong>DONG</strong> ENERGY <strong>DONG</strong> ENERGY GROUP <strong>ANNUAL</strong> <strong>REPORT</strong> <strong>2011</strong> – COnsOliDatED finanCial statEmEnts<br />
83 87<br />
notes
notes<br />
14 Earnings per share<br />
DKK million <strong>2011</strong> 2010<br />
Profi t for the year 4,250 4,464<br />
Coupon on hybrid capital after tax (269) (334)<br />
Attributable to non-controlling interests (185) 107<br />
attributable to DOnG <strong>Energy</strong> Group 3,796 4,237<br />
Average number of shares of DKK 10 293,709,900 293,709,900<br />
Earnings per share (EPS) and diluted earnings per share (DEPS) of DKK 10, in DKK 12.92 14.43<br />
15 Intangible assets<br />
DKK million Goodwill<br />
Cost at 1 January <strong>2011</strong> 651 3,198 476 995 21 5,341<br />
Foreign exchange adjustments (1) (1) - - 2 0<br />
Additions - 86 652 15 34 787<br />
Disposals - (26) (201) - (3) (230)<br />
Transfers - 22 - 13 (32) 3<br />
Cost at 31 December <strong>2011</strong> 650 3,279 927 1,023 22 5,901<br />
Amortisation and impairment losses<br />
at 1 January <strong>2011</strong> - (1,658) (294) (638) - (2,590)<br />
Amortisation, disposals - 26 201 - - 227<br />
Amortisation charge - (351) - (106) - (457)<br />
Impairment charge (277) (73) - - - (350)<br />
Transfers - (2) - - - (2)<br />
amortisation and impairment losses<br />
at 31 December <strong>2011</strong> (277) (2,058) (93) (744) 0 (3,172)<br />
Carrying amount at 31 December <strong>2011</strong> 373 1,221 834 279 22 2,729<br />
Rights<br />
CO2 emissions<br />
allowances<br />
84 88 COnsOliDatED finanCial statEmEnts – <strong>DONG</strong> ENERGY GROUP <strong>ANNUAL</strong> <strong>ANNUAL</strong> <strong>REPORT</strong> <strong>REPORT</strong> <strong>2011</strong><br />
<strong>2011</strong><br />
Completed development<br />
projects<br />
In-process development<br />
projects<br />
total
DKK million Goodwill<br />
Cost at 1 January 2010 663 3,163 597 827 144 5,394<br />
Foreign exchange adjustments 1 - 29 - - 30<br />
Adjustments relating to acquisition of enterprises (13) - - - - (13)<br />
Additions - - 384 6 131 521<br />
Disposals - (4) (187) (34) (7) (232)<br />
Transfers - 39 - 196 (235) 0<br />
Reclassifi cations - - (347) - (12) (359)<br />
Cost at 31 December 2010 651 3,198 476 995 21 5,341<br />
Amortisation and impairment losses<br />
at 1 January 2010 - (1,474) (186) (582) - (2,242)<br />
Foreign exchange adjustments - - - 1 - 1<br />
Amortisation, disposals - - 187 29 - 216<br />
Amortisation charge - (184) (202) (86) - (472)<br />
Impairment charge - - (93) - - (93)<br />
amortisation and impairment losses<br />
at 31 December 2010 0 (1,658) (294) (638) 0 (2,590)<br />
Carrying amount at 31 December 2010 651 1,540 182 357 21 2,751<br />
Impairment testing<br />
Goodwill and in-process development projects are tested for<br />
impairment annually. The carrying amounts of rights, CO2 emissions allowances and completed development projects<br />
are assessed annually to determine whether there is any indication<br />
of impairment. If any such indication exists, an impairment<br />
test is carried out.<br />
In an impairment test, the asset’s recoverable amount is<br />
compared with its carrying amount. An impairment loss is recognised<br />
whenever the carrying amount of an asset or its cashgenerating<br />
unit (CGU) exceeds its recoverable amount.<br />
The recoverable amount of an intangible asset is the higher<br />
of its fair value less expected disposal costs and the present<br />
value of the expected future net cash fl ows (value in use).<br />
Goodwill<br />
Testing for impairment is carried out for the business areas or<br />
activities that represent the lowest level of CGUs to which the<br />
carrying amount of goodwill can be allocated on a reasonable<br />
and consistent basis.<br />
Rights<br />
CO2 emissions<br />
allowances<br />
Completed development<br />
projects<br />
In-process development<br />
projects<br />
total<br />
Acquired enterprises are established either as new activities or<br />
are integrated as quickly as possible with existing activities to<br />
utilise potential synergies. For acquisitions that are not established<br />
as separate activities the implication of this is that, after<br />
a short time, it will no longer be possible to allocate the carrying<br />
amount of goodwill to the acquirees on a reasonable and<br />
consistent basis, and it will therefore no longer be possible to<br />
test goodwill from each acquisition for impairment.<br />
The recoverable amount of CGUs is determined as a value in<br />
use, where net cash fl ows are determined on the basis of business<br />
plans and budgets that have been approved by management.<br />
For some CGUs, value in use is determined on the basis<br />
of a defi nite period of years, while, for other CGUs, a terminal<br />
value after the budget period is determined based on the general<br />
growth outlook for the relevant markets. Net cash fl ows<br />
have been discounted using a discount rate before tax that<br />
refl ects the cost of capital associated with the activity.<br />
The goodwill allocation for each CGU and signifi cant assumptions<br />
applied in connection with the impairment tests carried<br />
out are set out below:<br />
<strong>DONG</strong> ENERGY <strong>DONG</strong> ENERGY GROUP <strong>ANNUAL</strong> <strong>REPORT</strong> <strong>2011</strong> – COnsOliDatED finanCial statEmEnts<br />
89 85<br />
notes
notes<br />
15 Intangible assets<br />
<strong>2011</strong><br />
In <strong>2011</strong>, a goodwill impairment of DKK 277 million was recognised<br />
in respect of <strong>DONG</strong> <strong>Energy</strong> Sales B.V. due to changed<br />
pricing in the Dutch market.<br />
The result of the year’s other impairment tests was that the<br />
recoverable amount exceeded the carrying amount of goodwill.<br />
It was consequently not deemed necessary to write down<br />
goodwill further in <strong>2011</strong>.<br />
Central power stations<br />
The main criteria used for determining the recoverable amount<br />
are the green dark spread and the discount rate. The calculation<br />
of expected net cash fl ows is based on the Group’s own<br />
forecasting model, which forecasts net cash fl ows for the<br />
period 2012-2030. The model is designed so as to take into<br />
account the history of each power station and the Group’s<br />
experience in power station operation, including useful lives,<br />
maintenance, etc.<br />
a2sEa<br />
A2SEA specialises in the construction of offshore wind farms.<br />
The main criteria used for determining the recoverable amount<br />
are the utilisation rate, daily rates for A2SEA’s vessels, synergies<br />
in the installation process for offshore wind turbines and<br />
Central<br />
power stations A2SEA<br />
<strong>Energy</strong><br />
Markets<br />
Segment Thermal Power Wind Power <strong>Energy</strong> Markets<br />
Share of consolidated goodwill, in DKK million 125 157 91<br />
Share of consolidated goodwill (%) 34 42 24<br />
Discount rate before tax (%) 8 12 10<br />
Expected growth in net cash fl ows in terminal period (%) n.a. n.a 2<br />
2010<br />
Central<br />
power stations A2SEA<br />
Segment Thermal power Wind Power<br />
<strong>Energy</strong><br />
Markets<br />
<strong>Energy</strong><br />
Markets<br />
<strong>DONG</strong> <strong>Energy</strong><br />
Sales B.V.<br />
Sales &<br />
Distribution<br />
Share of consolidated goodwill,<br />
in DKK million 125 157 92 277<br />
Share of consolidated goodwill (%) 19 24 14 43<br />
Discount rate before tax (%) 9 11 9 9<br />
Expected growth in net cash fl ows<br />
in terminal period (%) n.a. n.a. 2 2<br />
86 90 COnsOliDatED finanCial statEmEnts – <strong>DONG</strong> ENERGY GROUP <strong>ANNUAL</strong> <strong>ANNUAL</strong> <strong>REPORT</strong> <strong>REPORT</strong> <strong>2011</strong><br />
<strong>2011</strong><br />
the discount rate. The assumptions on which budgeted utilisation<br />
rates are based include the existence of contracts for part<br />
of revenue and the setting-up of projects in the immediate<br />
future. Budgeted daily rates are based on evaluation of the<br />
current level of daily rates and the prices of vessel newbuilds.<br />
The determination of net cash fl ows is based on the company’s<br />
business plan and expected net cash fl ows for the period<br />
2012-2032.<br />
<strong>Energy</strong> markets<br />
<strong>Energy</strong> Markets optimises <strong>DONG</strong> <strong>Energy</strong>’s energy portfolio,<br />
forming the link between the Group’s procurement and sale of<br />
energy.<br />
The main criteria used for determining the recoverable amount<br />
are oil and gas prices, gross margins, portfolio composition and<br />
the discount rate used. The determination of expected net cash<br />
fl ows is based on budgets and forecasts for the period 2012-<br />
2020. The model has been prepared so that account is taken of<br />
contract composition during the period and the Group’s portfolio<br />
management experience.<br />
DOnG <strong>Energy</strong> sales B.v.<br />
<strong>DONG</strong> <strong>Energy</strong> Sales B.V. sells gas and electricity to end users<br />
in the Netherlands.
The main criteria used for determining the recoverable amount<br />
are gross margins and the discount rate applied. Budgeted<br />
gross margins are based on recently realised margins.<br />
Expected net cash fl ows have been determined on the basis<br />
of the company’s business plan and budgets for the period<br />
2012-2018.<br />
As mentioned above, a goodwill impairment of DKK 277 million<br />
was recognised, to the effect that the goodwill relating to<br />
<strong>DONG</strong> <strong>Energy</strong> Sales B.V. has been fully written off. The impairment<br />
was recognised in the Sales & Distribution segment.<br />
rights<br />
Rights consist predominantly of gas purchase rights and<br />
a connection right relating to gas transportation. At 31<br />
December <strong>2011</strong>, the carrying amount of gas purchase<br />
rights was calculated at DKK 768 million (2010: DKK<br />
875 million) and the carrying amount of the connection<br />
right at DKK 170 million (2010: DKK 292 million).<br />
In June <strong>2011</strong>, the Danish <strong>Energy</strong> Regulatory Authority (DERA)<br />
declared that the tariff for <strong>DONG</strong> <strong>Energy</strong>’s gas pipelines must<br />
only amount to DKK 0.07/m3 compared with the current tariff<br />
of DKK 0.13/ m3 . As a consequence of this, in <strong>2011</strong>, a DKK 73<br />
million impairment loss was recognised on the connection<br />
right relating to gas transportation and DKK 527 million on<br />
the offshore gas pipelines from the North Sea to Denmark<br />
(recognised in production assets). The impairment loss<br />
refl ects a reduction of the tariff to DKK 0.10/m3 , equivalent<br />
to the tariff reduction offered by <strong>DONG</strong> <strong>Energy</strong> to DERA. The<br />
impairment was recognised in the <strong>Energy</strong> Markets segment.<br />
There were no other indications of impairment<br />
of rights in <strong>2011</strong>. Consequently, no further<br />
impairment testing of rights was carried out.<br />
CO2 emissions allowances<br />
CO2 emissions allowances for own use amounted to DKK<br />
834 million (2010: DKK 182 million). There were no indications<br />
of impairment of CO2 emissions allowances in <strong>2011</strong>.<br />
Consequently, these were not tested for impairment. In 2010,<br />
a DKK 93 million impairment loss was recognised in respect of<br />
rights relating to CO2 emissions allowances. The impairment<br />
loss refl ected a change in the Group’s estimate relating to the<br />
allocation of CO2 emissions allowances in the Netherlands.<br />
CO2 emissions allowances are recognised in the Thermal<br />
Power segment.<br />
Completed development projects<br />
Completed development projects relate primarily to IT software<br />
and development of technical solutions, for example for the<br />
electricity grid. The carrying amount of completed development<br />
projects was DKK 279 million at 31 December <strong>2011</strong> (2010: DKK<br />
357 million).<br />
There were no indications of impairment of completed development<br />
projects. Consequently, these were not tested for<br />
impairment.<br />
in-process development projects<br />
In-process development projects are tested annually for<br />
impairment.<br />
In-process development projects relate primarily to the implementation<br />
of new IT systems. The carrying amount of inprocess<br />
development projects stood at DKK 22 million at 31<br />
December <strong>2011</strong> (2010: DKK 21 million).<br />
The Group tested the carrying amounts of recognised in-process<br />
development projects for impairment in <strong>2011</strong>. The result<br />
of the year’s other impairment tests was that the recoverable<br />
amount exceeded the carrying amount of in-process development<br />
projects. It was consequently not deemed necessary to<br />
write down in-process development projects.<br />
<strong>DONG</strong> ENERGY <strong>DONG</strong> ENERGY GROUP <strong>ANNUAL</strong> <strong>REPORT</strong> <strong>2011</strong> – COnsOliDatED finanCial statEmEnts<br />
87 91<br />
notes
notes<br />
16 Property, plant and equipment<br />
DKK million Land and<br />
buildings<br />
Production<br />
assets<br />
Exploration<br />
assets<br />
Fixtures and<br />
ttings, tools and<br />
equipment<br />
Property, plant and<br />
equipment under<br />
construction<br />
Cost at 1 January <strong>2011</strong> 3,507 86,249 975 482 19,161 110,374<br />
Foreign exchange adjustments 1 472 39 - 466 978<br />
Additions 126 3,339 1,073 79 17,490 22,107<br />
Disposals (54) (322) (476) (16) (188) (1,056)<br />
Transfers to assets classi ed as held for sale (25) (1,642) - (5) (120) (1,792)<br />
Transfers 1,521 12,073 - 158 (13,755) (3)<br />
Cost at 31 December <strong>2011</strong> 5,076 100,169 1,611 698 23,054 130,608<br />
Depreciation and impairment losses<br />
at 1 January <strong>2011</strong> (648) (28,747) - (277) (17) (29,689)<br />
Foreign exchange adjustments - (64) - - - (64)<br />
Depreciation and impairment losses, disposals 1 34 - 10 - 45<br />
Depreciation charge (199) (6,115) - (81) - (6,395)<br />
Impairment charge - (527) - - - (527)<br />
Impairment losses reversed - 59 - - - 59<br />
Transfers to assets classi ed as held for sale 2 466 - 3 - 471<br />
Transfers (90) 163 - (71) - 2<br />
Depreciation and impairment losses<br />
at 31 December <strong>2011</strong> (934) (34,731) 0 (416) (17) (36,098)<br />
Carrying amount at 31 December <strong>2011</strong> 4,142 65,438 1,611 282 23,037 94,510<br />
88 92 COnsOliDatED finanCial statEmEnts – <strong>DONG</strong> ENERGY GROUP <strong>ANNUAL</strong> <strong>ANNUAL</strong> <strong>REPORT</strong> <strong>REPORT</strong> <strong>2011</strong><br />
<strong>2011</strong><br />
Total
DKK million Land and<br />
Impairment testing<br />
<strong>DONG</strong> <strong>Energy</strong> tests property, plant and equipment for impairment<br />
if there is any indication of impairment.<br />
In an impairment test, the asset’s recoverable amount is<br />
compared with its carrying amount. An impairment loss is<br />
recognised whenever the carrying amount of an asset or its<br />
cash-generating unit (CGU) exceeds its recoverable amount.<br />
The recoverable amount of property, plant and equipment<br />
is the higher of the assets’ fair value less expected disposal<br />
costs and the present value of the expected future net cash<br />
fl ows (value in use).<br />
production assets<br />
Oil and gas fi elds<br />
Producing oil and gas fi elds in the Exploration & Production<br />
segment were tested for impairment in <strong>2011</strong>. Based on the<br />
impairment testing of oil and gas-producing fi elds, it was estimated<br />
that the recoverable amount exceeded the carrying<br />
buildings<br />
Production<br />
assets<br />
Exploration<br />
assets<br />
Fixtures and<br />
ttings, tools and<br />
equipment<br />
Property, plant and<br />
equipment under<br />
construction<br />
Cost at 1 January 2010 3,482 74,257 2,997 473 13,043 94,252<br />
Foreign exchange adjustments 2 1,426 49 - 433 1,910<br />
Additions 20 2,840 386 12 13,046 16,304<br />
Disposals (27) (744) (100) (13) (196) (1,080)<br />
Transfers to assets classi ed as held for sale (4) (1,046) - (1) (1) (1,052)<br />
Transfers 6 9,516 (2,357) 11 (7,176) 0<br />
Reclassi cations 28 - - - 12 40<br />
Cost at 31 December 2010 3,507 86,249 975 482 19,161 110,374<br />
Depreciation and impairment losses<br />
at 1 January 2010 (469) (23,430) - (206) (17) (24,122)<br />
Foreign exchange adjustments - (324) - (1) - (325)<br />
Depreciation, disposals 11 171 - 13 - 195<br />
Depreciation charge (141) (5,111) - (84) - (5,336)<br />
Impairment charge (23) (294) - - - (317)<br />
Transfers to assets classi ed as held for sale 2 241 1 - 244<br />
Reclassi cations (28) - - - - (28)<br />
Depreciation and impairment losses<br />
at 31 December 2010 (648) (28,747) 0 (277) (17) (29,689)<br />
Carrying amount at 31 December 2010 2,859 57,502 975 205 19,144 80,685<br />
Total<br />
amount, and no impairment losses were therefore recognised on<br />
the Group’s producing oil and gas fi elds in <strong>2011</strong>.<br />
The main criteria used for determining the recoverable amount<br />
are the expectations concerning reserves, oil and gas prices,<br />
exchange rates and discount rates.<br />
Electricity distribution network<br />
The electricity distribution network was tested for impairment<br />
in <strong>2011</strong>. The electricity distribution network is recognised in the<br />
Sales & Distribution segment.<br />
Based on the impairment testing of the electricity distribution<br />
network, it is estimated that the recoverable amount exceeds<br />
the carrying amount. No impairment loss was consequently recognised<br />
on the Group’s electricity distribution network in <strong>2011</strong>.<br />
The main criteria in connection with the determination of the<br />
recoverable amount are the regulatorily permitted return, discount<br />
rates, expected volume of transported kWh, operation and<br />
maintenance as well as the associated investment level.<br />
<strong>DONG</strong> ENERGY <strong>DONG</strong> ENERGY GROUP <strong>ANNUAL</strong> <strong>REPORT</strong> <strong>2011</strong> – COnsOliDatED finanCial statEmEnts<br />
89 93<br />
notes
notes<br />
16 Property, plant and equipment<br />
Other production assets<br />
As described under rights in note 15, a DKK 527 million impairment<br />
loss was recognised on the offshore gas pipelines from the<br />
North Sea to Denmark in <strong>2011</strong>. The impairment was recognised<br />
in the <strong>Energy</strong> Markets segment.<br />
Other signifi cant production assets were tested for impairment,<br />
including primarily power stations and wind farms. It is estimated<br />
that the recoverable amount of other production assets<br />
exceeds the carrying amount, and no impairment losses were<br />
consequently recognised in respect of other production assets.<br />
In 2010, a DKK 317 million impairment loss was recognised, including<br />
DKK 299 million in respect of small-scale power stations.<br />
Part of this impairment loss related to the small-scale Maribo-<br />
Sakskøbing CHP plant, which was subsequently sold in <strong>2011</strong>.<br />
Therefore, of the impairment loss recognised in 2010, DKK 59<br />
million has been reversed.<br />
Exploration assets<br />
Exploration assets are tested for impairment when suffi cient<br />
data have been obtained to assess each asset’s technical<br />
and commercial potential and if there is any indication of<br />
impairment. Impairment testing is also carried out at the<br />
time commercial fi nds of oil and/or gas have been identifi ed,<br />
and when exploration assets are reclassifi ed to assets under<br />
construction.<br />
90 94 COnsOliDatED finanCial statEmEnts – <strong>DONG</strong> ENERGY GROUP <strong>ANNUAL</strong> <strong>ANNUAL</strong> <strong>REPORT</strong> <strong>REPORT</strong> <strong>2011</strong><br />
<strong>2011</strong><br />
Signifi cant parameters in connection with the determination of<br />
the recoverable amount of exploration assets are expectations<br />
concerning reserves, oil and gas prices, exchange rates and<br />
discount rates.<br />
There were no indications of impairment in <strong>2011</strong>, and no<br />
impairment losses were therefore recognised in <strong>2011</strong> on the<br />
Group’s exploration assets.<br />
property, plant and equipment under construction<br />
Signifi cant items of property, plant and equipment under<br />
construction, including wind farms and oil and gas fi elds, were<br />
tested for impairment. It is estimated that the recoverable<br />
amount of property, plant and equipment under construction<br />
exceeds the carrying amount.<br />
Other property, plant and equipment<br />
The carrying amounts of other property, plant and equipment<br />
are assessed annually to determine whether there is any indication<br />
of impairment. If any such indication exists, an impairment<br />
test is carried out.<br />
Based on the impairment testing of other property, plant<br />
and equipment, it is estimated that the recoverable amount<br />
exceeds the carrying amount. No impairment losses were consequently<br />
recognised in <strong>2011</strong> in respect of the Group’s other<br />
property, plant and equipment.
17 Associates and other securities<br />
Investments in associates Other equity investments Other securities<br />
DKK million <strong>2011</strong> 2010 <strong>2011</strong> 2010 <strong>2011</strong> 2010<br />
Cost at 1 January 3,317 4,143 517 269 - 1,173<br />
Foreign exchange adjustments 5 7 - - - -<br />
Additions 133 57 63 248 - 130<br />
Disposals - - (19) - - (1,303)<br />
Disposal on disposal of associates - (1,103) - - - -<br />
Capital contributions 259 232 - - - -<br />
Capital reductions (9) - - - - -<br />
Transfers to assets classifi ed as held for sale - (19) - - - -<br />
Cost at 31 December 3,705 3,317 561 517 0 0<br />
Value adjustments at 1 January (398) (538) (143) (68) - -<br />
Foreign exchange adjustments 17 309 - - - -<br />
Share of profi t for the year 36 77 - - - -<br />
Disposal on disposal of associates - (196) - - - -<br />
Dividends received (51) (59) - - - -<br />
Impairment charge - - - (75) - -<br />
Value adjustments carried directly in equity<br />
of associates (83) - - - - -<br />
Transfers to assets classifi ed as held for sale - 9 - - - -<br />
value adjustments at 31 December (479) (398) (143) (143) 0 0<br />
Carrying amount at 31 December 3,226 2,919 418 374 0 0<br />
Investments in associates include rights with indefi nite useful<br />
lives. These rights have been tested for impairment. There was<br />
deemed to be no need to write down rights with indefi nite useful<br />
lives in <strong>2011</strong> and 2010.<br />
Other equity investments comprise investments in unlisted securities<br />
classifi ed as assets available for sale. The investments<br />
are measured at the lower of cost and recoverable amount, as<br />
the fair value of the assets cannot be determined reliably.<br />
No impairment losses were charged in respect of other equity<br />
investments in <strong>2011</strong>. In 2010, <strong>DONG</strong> <strong>Energy</strong> recognised a DKK<br />
75 million impairment loss on the Group’s participation in development<br />
project companies.<br />
<strong>DONG</strong> ENERGY <strong>DONG</strong> ENERGY GROUP <strong>ANNUAL</strong> <strong>REPORT</strong> <strong>2011</strong> – COnsOliDatED finanCial statEmEnts<br />
95 91<br />
notes
notes<br />
17 Associates and other securities<br />
DKK million <strong>2011</strong> 2010<br />
Revenue 2,134 4,867<br />
Profi t 144 313<br />
profi t attributable to DOnG <strong>Energy</strong> 36 77<br />
Assets 13,470 13,417<br />
Liabilities 1,344 2,324<br />
Equity 12,126 11,093<br />
Equity attributable to DOnG <strong>Energy</strong> 3,226 2,919<br />
The accounting fi gures disclosed in the note have been determined<br />
on the basis of the recognised values in the Group. For<br />
18 Inventories<br />
an overview of the Group’s ownership interests in associates,<br />
reference is made to note 42 in the complete annual report.<br />
DKK million <strong>2011</strong> 2010<br />
Raw materials and consumables 96 102<br />
Fuel 1,158 1,125<br />
Natural gas and crude oil 2,179 1,118<br />
CO 2 emissions allowances 79 513<br />
Green certifi cates 726 230<br />
Other inventories 6 3<br />
inventories at 31 December 4,244 3,091<br />
The bulk of the inventories is expected to be used within one year.<br />
92 96 COnsOliDatED finanCial statEmEnts – <strong>DONG</strong> ENERGY GROUP <strong>ANNUAL</strong> <strong>ANNUAL</strong> <strong>REPORT</strong> <strong>REPORT</strong> <strong>2011</strong><br />
<strong>2011</strong>
19 Receivables<br />
DKK million <strong>2011</strong> 2010<br />
Receivables from associates 546 542<br />
Receivables from jointly controlled entities 328 12<br />
Receivables from the disposal of activities 108 103<br />
Receivables from the disposal of equity investments to non-controlling interests 185 76<br />
Assets held under fi nance leases 2.056 2.027<br />
Other receivables 91 102<br />
non-current receivables at 31 December 3.314 2.862<br />
Trade receivables 7.634 9.451<br />
Receivables from associates 11 2<br />
Receivables from jointly controlled entities 542 259<br />
Receivables from the disposal of activities 101 131<br />
Receivables from the disposal of equity investments to non-controlling interests 1.160 1.664<br />
Receivable capital contributions from non-controlling interests 2.103 2.212<br />
Assets held under fi nance leases 38 73<br />
Fair value of derivative fi nancial instruments, see note 33 16.060 14.461<br />
Deposits 246 102<br />
Construction contracts, see note 20 41 61<br />
Other receivables 4.556 3.198<br />
Current receivables at 31 December 32.492 31.614<br />
Current and non-current receivables at 31 December 35.806 34.476<br />
Other receivables include VAT, other indirect taxes, prepayments,<br />
etc.<br />
Apart from the fair value of derivative fi nancial instruments,<br />
current receivables fall due within one year of the close of the<br />
fi nancial year. The remaining maturity of derivative fi nancial<br />
instruments appears from note 33.<br />
Further details of credit risks associated with receivables are<br />
disclosed in the Credit risks section in the Risk and risk management<br />
chapter in Management’s review, pages 44-51, and<br />
in note 32.<br />
<strong>DONG</strong> ENERGY <strong>DONG</strong> ENERGY GROUP <strong>ANNUAL</strong> <strong>REPORT</strong> <strong>2011</strong> – COnsOliDatED finanCial statEmEnts<br />
93 97<br />
notes
notes<br />
19 Receivables<br />
assets held under fi nance leases with DOnG <strong>Energy</strong> as lessor<br />
DKK million<br />
Present<br />
value Interest<br />
<strong>2011</strong> 2010<br />
Minimum<br />
lease<br />
income<br />
Present<br />
value Interest<br />
Minimum<br />
lease<br />
income<br />
0 - 1 year 38 (120) 158 73 (122) 195<br />
1 - 5 years 207 (454) 661 183 (466) 649<br />
More than 5 years 1,849 (902) 2,751 1,844 (1,069) 2,913<br />
assets held under fi nance<br />
leases 2,094 (1,476) 3,570 2,100 (1,657) 3,757<br />
Assets held under fi nance leases with <strong>DONG</strong> <strong>Energy</strong> as the<br />
lessor comprise a gas-fi red power station constructed for Statoil<br />
in Mongstad in Norway. The lease has a 20-year term, but<br />
includes an option for two fi ve-year extensions.<br />
receivables that are past due but not individually impaired<br />
The present value of the lease has been calculated applying<br />
the interest rate implicit in the lease. There is no contingent<br />
rent under the lease.<br />
DKK million <strong>2011</strong> 2010<br />
Days past due:<br />
Up to 30 days 442 653<br />
30 - 90 days 108 92<br />
More than 90 days 715 173<br />
General write-offs (152) (148)<br />
trade receivables that are past due but not individually impaired 1,113 770<br />
General write-downs on trade receivables are assessed on the<br />
basis of due date and historical experience. Write-downs are<br />
recorded on a summary account.<br />
movements in general and individual write-downs<br />
The Group’s trade receivables at 31 December <strong>2011</strong> include receivables<br />
totalling DKK 26 million (2010: DKK 171 million) that<br />
have been written down to DKK 11 million following individual<br />
assessment (2010: DKK 130 million). The individual writedown<br />
on trade receivables was DKK 15 million (2010: DKK 41<br />
million).<br />
DKK million <strong>2011</strong> 2010<br />
Write-downs at 1 January 189 183<br />
Write-downs for the year 60 72<br />
Reversal of previous write-downs (6) (3)<br />
Receivables written off (76) (63)<br />
write-downs at 31 December 167 189<br />
94 98 COnsOliDatED finanCial statEmEnts – <strong>DONG</strong> ENERGY GROUP <strong>ANNUAL</strong> <strong>ANNUAL</strong> <strong>REPORT</strong> <strong>REPORT</strong> <strong>2011</strong><br />
<strong>2011</strong>
20 Construction contracts<br />
DKK million <strong>2011</strong> 2010<br />
Selling price of construction contracts 481 43<br />
Progress billings (901) -<br />
net value of construction contracts at 31 December (420) 43<br />
which can be broken down as follows:<br />
Construction contracts (assets) 41 61<br />
Construction contracts (liabilities) (461) (18)<br />
net value of construction contracts at 31 December (420) 43<br />
Selling price and progress billings at 31 December <strong>2011</strong> relate<br />
primarily to the construction of 50% of Anholt offshore wind<br />
farm, which is owned by external parties. The offshore wind<br />
farm is scheduled for completion and start-up in autumn 2013.<br />
21 Assets classifi ed as held for sale<br />
Construction contracts are recognised as receivables, see note<br />
19, and payables, see note 25.<br />
DKK million <strong>2011</strong> 2010<br />
Property, plant and equipment 320 805<br />
Other non-current assets - 13<br />
non-current assets 320 818<br />
Current assets 364 27<br />
assets classifi ed as held for sale at 31 December 684 845<br />
Non-current liabilities 355 66<br />
Current liabilities 30 97<br />
liabilities relating to assets classifi ed as held for sale at 31 December 385 163<br />
Assets classifi ed as held for sale at 31 December <strong>2011</strong> comprise<br />
<strong>DONG</strong> <strong>Energy</strong>’s oil terminals and the small-scale CHP<br />
plants Ringsted CHP plant, Masnedø CHP plant, Slagelse CHP<br />
plant, Køge CHP plant, Haslev CHP plant, Grenå CHP plant<br />
and DTU CHP plant. The oil terminals and three of the CHP<br />
plants have been sold and transferred in 2012 (Thermal Power<br />
segment).<br />
Assets classifi ed as held for sale at 31 December 2010 comprise<br />
certain completed offshore transmission networks in the<br />
UK (Wind Power segment), Odense CHP plant and Frederikshavn<br />
Affaldskraftvarmeværk (Thermal Power segment) as<br />
well as <strong>DONG</strong> <strong>Energy</strong>’s ownership interest in DELPRO (Sales<br />
& Distribution segment), which was sold in <strong>2011</strong>. Reference is<br />
made to note 29.<br />
<strong>DONG</strong> ENERGY <strong>DONG</strong> ENERGY GROUP <strong>ANNUAL</strong> <strong>REPORT</strong> <strong>2011</strong> – COnsOliDatED finanCial statEmEnts<br />
99 95<br />
notes
notes<br />
22 Equity<br />
share capital<br />
DKK million <strong>2011</strong> 2010<br />
Share capital at 1 January 2,937 2,937<br />
share capital at 31 December 2,937 2,937<br />
The company’s share capital is DKK 2,937,099,000, divided<br />
into shares of DKK 10. All shares rank equally. There are no<br />
restrictions on voting rights. The shares are fully paid up. The<br />
shares may only be assigned or otherwise transferred with the<br />
written consent of the Danish Finance Minister.<br />
Resolutions concerning amendments to the Articles of<br />
Association or <strong>DONG</strong> <strong>Energy</strong> A/S’s dissolution require at least<br />
two thirds of the votes cast and of the voting share capital to<br />
be represented at the general meeting in order to be carried.<br />
Dividends<br />
The Board of Directors recommends that dividend of DKK 1,457<br />
million be paid for the <strong>2011</strong> fi nancial year, equivalent to 60% of the<br />
business performance result determined as the share of the business<br />
performance result after tax (i.e. excluding coupon to hybrid<br />
capital holders and non-controlling interests) that is attributable<br />
to the company’s shareholders, equivalent to DKK 4.96 per share<br />
(2010: DKK 7.50 per share). It is the Board of Directors’ intention<br />
to distribute DKK 7.75 per share in 2012, and, in the years after the<br />
2012 fi nancial year and until a decision, if any, on an IPO is made,<br />
to generally increase distributions by DKK 0.25 per share per year,<br />
although in such a way that the payout ratio does not fall below<br />
40% or exceed 60% of the business performance result for the<br />
year determined as the shareholders’ share of the business performance<br />
result after tax (i.e. excluding coupon to hybrid capital<br />
holders and non-controlling interests).<br />
Dividend distributions to shareholders have no tax implications<br />
for <strong>DONG</strong> <strong>Energy</strong> A/S. Dividend paid per share (DPS) of DKK 10<br />
amounted to DKK 7.50 (2010: DKK 1.64).<br />
Cash management and capital structure<br />
Management continuously evaluates the Group’s capital<br />
structure to ensure that it is aligned with the Group’s and the<br />
shareholders’ interests and supports the Group’s strategy.<br />
<strong>DONG</strong> <strong>Energy</strong>’s liquidity and fi nancing risks are managed centrally<br />
in accordance with principles and delegated authorities<br />
laid down by the Board of Directors. One of the most important<br />
fi nancial management tasks in <strong>DONG</strong> <strong>Energy</strong> is to secure<br />
suffi cient and fl exible fi nancial resources in relation to the dayto-day<br />
operations and the Group’s investment programme.<br />
To this end, internal management targets have been set for<br />
the required level of fi nancial resources, taking into account<br />
primarily factors such as the investment programme, cash<br />
fl ows from operating activities and debt maturity profi le.<br />
Equity, hybrid capital and bond and mortgage loans are considered<br />
to be capital.<br />
It is <strong>DONG</strong> <strong>Energy</strong>’s fi nancing policy to concentrate loans in<br />
the parent company in order to optimise the loan portfolio on a<br />
consolidated basis. Non-current assets are primarily fi nanced<br />
by cash fl ows from operating activities, supplemented by the<br />
raising of debt.<br />
<strong>DONG</strong> <strong>Energy</strong> manages its debt profi le and cash resources via<br />
various policies aimed at minimising refi nancing risks. This is<br />
achieved partly via a spread of sources of funding and maturities,<br />
and partly by ensuring that cash resources are sound, either<br />
in the form of committed borrowing facilities or cash and cash<br />
equivalents. At the end of <strong>2011</strong>, cash resources stood at DKK 23.1<br />
billion, including undrawn committed borrowing facilities of DKK<br />
13.4 billion and cash and securities of DKK 9.7 billion.<br />
To secure fi nancing on attractive terms at all times, <strong>DONG</strong><br />
<strong>Energy</strong> has set targets for its credit rating and capital structure.<br />
The credit rating target is to maintain ratings of at least<br />
BBB+ and Baa1 respectively with the rating agencies Standard<br />
& Poor’s and Moody’s. <strong>DONG</strong> <strong>Energy</strong> considers that poorer<br />
ratings would restrict its scope for effective implementation of<br />
the investment programme that is part of its strategy. <strong>DONG</strong><br />
<strong>Energy</strong> has been rated A- by Standard & Poor’s and Baa1 by<br />
Moody’s, both with a stable outlook.<br />
Up to and including <strong>2011</strong>, the capital structure target was for<br />
adjusted net debt not to exceed three times cash fl ows from<br />
operating activities. From and including 2012, the target has<br />
been changed so that adjusted net debt must not exceed 2.5<br />
times EBITDA.<br />
Hybrid capital<br />
96 100 COnsOliDatED finanCial statEmEnts – <strong>DONG</strong> ENERGY GROUP <strong>ANNUAL</strong> <strong>ANNUAL</strong> <strong>REPORT</strong> <strong>REPORT</strong> <strong>2011</strong><br />
<strong>2011</strong><br />
The hybrid capital totalling DKK 9,538 million (EUR 1.3 billion<br />
nominal value) comprises the EUR hybrid bonds issued<br />
in the European capital markets to which a series of special<br />
terms are attached. The hybrid capital is subordinate to the<br />
Group’s other creditors. The purpose of issuing hybrid capital<br />
was to strengthen the Group’s capital base and to fund<br />
the Group’s CAPEx and acquisitions.<br />
The total hybrid capital consists of hybrid bonds due in 3005<br />
and hybrid bonds due in 3010. Further details of the two hybrid<br />
capital issues are given in the table below.<br />
Coupon on the hybrid capital is settled annually. Coupon payments<br />
and their tax effect are recognised directly in equity.
Hybrid capital due 3005 Hybrid capital due 3010<br />
Carrying amount DKK 4,411 million DKK 5,127 million<br />
Principal amount EUR 600 million (DKK 4,460 million) EUR 700 million (DKK 5,204 million)<br />
Issued June 2005 January <strong>2011</strong><br />
Maturing June 3005 June 3010<br />
First call date 29 June 2015 1 June 2021<br />
Coupon<br />
Deferral of coupon payment Optional deferral option<br />
Coupon for the fi rst ten years is fi xed at 5.5%<br />
p.a., after which it becomes fl oating at 3 months’<br />
EURIBOR + 3.2%<br />
<strong>DONG</strong> <strong>Energy</strong> A/S may, at its sole discretion, omit or defer<br />
coupon payments to bond holders. However, deferred coupon<br />
payments will fall due for payment in the event of <strong>DONG</strong><br />
<strong>Energy</strong> A/S subsequently making any distributions to its<br />
shareholders. So far, <strong>DONG</strong> <strong>Energy</strong> A/S has not used the option<br />
to defer coupon payments.<br />
For the hybrid capital due in 3010, <strong>DONG</strong> <strong>Energy</strong> A/S must<br />
defer coupon payments to bond holders in the event of S&P<br />
downgrading <strong>DONG</strong> <strong>Energy</strong> A/S’s credit rating to BB+ or<br />
less. In the event of such mandatory deferral, the coupon<br />
must not be paid until fi ve years after the deferral date, or<br />
when the credit rating again exceeds BB+.<br />
Via a trust deed in connection with the issuing of the hybrid<br />
bonds due in 3010, <strong>DONG</strong> <strong>Energy</strong> A/S has committed to not<br />
DKK million<br />
Coupon for the fi rst ten years is fi xed at 7.75%<br />
p.a., after which it becomes variable at 12<br />
months’ EURIBOR + 5.5%<br />
Optional deferral option, plus mandatory deferral<br />
in the event of <strong>DONG</strong> <strong>Energy</strong> A/S’s credit rating<br />
with S&P being downgraded to BB+ or less<br />
redeeming these bonds without replacing them with similar<br />
bonds or other subordinated capital contributions. This commitment,<br />
which has been made to the investors at any given<br />
time in one or more of <strong>DONG</strong> <strong>Energy</strong> A/S’s other bond issues,<br />
will remain in effect until 2046. <strong>DONG</strong> <strong>Energy</strong> A/S may<br />
be released from this obligation subject to certain conditions<br />
being met.<br />
Of the hybrid bonds due in 3005, <strong>DONG</strong> <strong>Energy</strong> repurchased<br />
bonds with a nominal value of EUR 0.5 billion in January<br />
<strong>2011</strong> while at the same time issuing new hybrid bonds with a<br />
nominal value of EUR 0.7 billion due in 3010.<br />
Non-controlling interests<br />
Non-controlling interests’ share of recognised profi t and equity<br />
in the Group relates to:<br />
<strong>2011</strong> 2010<br />
Profi t for<br />
the year equity<br />
Profi t for<br />
the year Equity<br />
<strong>DONG</strong> <strong>Energy</strong> Sales GmbH - - 5 -<br />
<strong>DONG</strong> <strong>Energy</strong> Kraftwerke Greifswald GmbH & Co. KG - - (43) -<br />
<strong>DONG</strong> <strong>Energy</strong> Nysted I A/S 6 43 - 67<br />
EnergiGruppen Jylland F&B A/S 6 7 (15) -<br />
<strong>DONG</strong> <strong>Energy</strong> Germany AG - - 2 32<br />
MIG Business Development A/S - - - 1<br />
A2SEA A/S 42 746 (7) 318<br />
Storrun Vindkraft AB 2 62 1 61<br />
Walney (UK) Windfarms Ltd. 62 5,417 (50) 3,036<br />
Gunfl eet Sands Holding Ltd. 67 1,677 - -<br />
non-controlling interests 185 7,952 (107) 3,515<br />
<strong>DONG</strong> ENERGY <strong>DONG</strong> ENERGY GROUP <strong>ANNUAL</strong> <strong>REPORT</strong> <strong>2011</strong> – COnsOliDatED finanCial statEmEnts<br />
101 97<br />
notes
notes<br />
23 Deferred tax<br />
DKK million <strong>2011</strong> 2010<br />
Deferred tax at 1 January 7,784 6,385<br />
Foreign exchange adjustments 29 179<br />
Addition on acquisition of individual assets (59) -<br />
Deferred tax for the year recognised in profi t for the year 1,460 1,258<br />
Deferred tax for the year recognised in other comprehensive income 1 (1)<br />
Adjustments in respect of prior years (19) (38)<br />
Transfers to assets classifi ed as held for sale (45) 2<br />
Effect of reduction of income tax rate 4 (1)<br />
Deferred tax at 31 December 9,155 7,784<br />
Deferred tax is recognised in the balance sheet as follows:<br />
Deferred tax (assets) (181) (404)<br />
Deferred tax (liabilities) 9,336 8,188<br />
Deferred tax at 31 December, net 9,155 7,784<br />
Deferred tax relates to:<br />
Intangible assets (10) 479<br />
Property, plant and equipment 11,597 9,785<br />
Other non-current assets 27 89<br />
Current assets 158 (154)<br />
Non-current liabilities (3,311) (3,063)<br />
Current liabilities (125) (6)<br />
Retaxation 2,548 1,701<br />
Tax loss carryforwards (1,729) (1,047)<br />
Deferred tax at 31 December 9,155 7,784<br />
Deferred tax assets not recognised in the balance sheet relate to:<br />
Temporary differences (2,626) (1,305)<br />
Tax loss carryforwards 15,973 12,114<br />
unrecognised deferred tax assets at 31 December 13,347 10,809<br />
Of the deferred tax totalling DKK 9,155 million (2010: DKK<br />
7,784 million), DKK 9,155 million is due for payment after 12<br />
months (2010: DKK 7,784 million).<br />
The tax base of taxable losses includes DKK 0 million (2010:<br />
DKK 144 million) relating to unutilised deductible net fi nance<br />
costs.<br />
98 102 COnsOliDatED finanCial statEmEnts – <strong>DONG</strong> ENERGY GROUP <strong>ANNUAL</strong> <strong>ANNUAL</strong> <strong>REPORT</strong> <strong>REPORT</strong> <strong>2011</strong><br />
<strong>2011</strong><br />
Unrecognised deferred tax assets relate primarily to unutilised<br />
losses in hydrocarbon income. It is considered unlikely that the<br />
losses will be utilised in the foreseeable future.
Change in temporary differences in <strong>2011</strong><br />
DKK million Balance sheet<br />
at 1 January<br />
Foreign exchange<br />
adjustments<br />
Additions, individual<br />
assets<br />
Recognised in<br />
profi t for the year<br />
Recognised in<br />
other comprehensive<br />
income<br />
Adjustments in<br />
respect of prior<br />
years<br />
Transfers to assets<br />
classifi ed as held<br />
for sale<br />
Intangible assets 479 - - (444) - - (45) - (10)<br />
Property, plant and<br />
equipment 9,785 61 - 1,187 2 566 - (4) 11,597<br />
Other non-current assets 89 (1) - (12) - (49) - - 27<br />
Current assets (154) - - 209 65 38 - - 158<br />
Non-current liabilities (3,063) (8) - (242) 63 (61) - - (3,311)<br />
Current liabilities (6) (2) - (162) (95) 140 - - (125)<br />
Retaxation 1,701 - - 839 - 8 - - 2,548<br />
Tax loss carryforwards (1,047) (21) (59) 85 (34) (661) - 8 (1,729)<br />
Deferred tax 7,784 29 (59) 1,460 1 (19) (45) 4 9,155<br />
Change in temporary differences in 2010<br />
DKK million Balance sheet<br />
at 1 January<br />
Foreign exchange<br />
adjustments<br />
Additions, individual<br />
assets<br />
Recognised in<br />
profi t for the year<br />
Recognised in<br />
other comprehensive<br />
income<br />
Adjustments in<br />
respect of prior<br />
years<br />
Transfers to assets<br />
classifi ed as held<br />
for sale<br />
Intangible assets 470 - - 32 - (23) - - 479<br />
Property, plant and<br />
equipment 8,380 210 - 1,280 - (50) (28) (7) 9,785<br />
Other non-current assets 27 - - 144 - (82) - - 89<br />
Current assets (125) - - (20) - (7) (2) - (154)<br />
Non-current liabilities (2,646) (35) - (328) (69) 6 9 - (3,063)<br />
Current liabilities (1) (1) - (116) 102 (13) 23 - (6)<br />
Retaxation 1,049 - - 549 - 103 - - 1,701<br />
Tax loss carryforwards (769) 5 - (283) (34) 28 - 6 (1,047)<br />
Deferred tax 6,385 179 0 1,258 (1) (38) 2 (1) 7,784<br />
<strong>DONG</strong> ENERGY <strong>DONG</strong> ENERGY GROUP <strong>ANNUAL</strong> <strong>REPORT</strong> <strong>2011</strong> – COnsOliDatED finanCial statEmEnts<br />
103 99<br />
Effect of change in<br />
tax rate<br />
Effect of change in<br />
tax rate<br />
Balance sheet<br />
at 31 december<br />
Balance sheet<br />
at 31 Decembe<br />
notes
notes<br />
24 Provisions<br />
DKK million<br />
<strong>2011</strong> 2010<br />
Decommissioning<br />
obligations Other total<br />
Decommissioning<br />
obligations Other total<br />
Provisions at 1 January 7,123 2,739 9,862 5,667 1,805 7,472<br />
Foreign exchange adjustments 47 3 50 123 2 125<br />
Provisions used during the year (7) (220) (227) (20) (80) (100)<br />
Provisions reversed during the year (50) (225) (275) - - 0<br />
Provisions made during the year 1,417 677 2,094 363 1,012 1,375<br />
Change in interest rate estimates 799 - 799 798 - 798<br />
Change in estimates of other<br />
factors 311 - 311 62 - 62<br />
Transfers to/from assets classifi ed<br />
as held for sale (349) 12 (337) (66) - (66)<br />
Reclassifi cations (81) 81 0 - - 0<br />
Interest element of decommissioning<br />
obligations 176 - 176 196 - 196<br />
provisions at 31 December 9,386 3,067 12,453 7,123 2,739 9,862<br />
Decommissioning obligations relate to expected future costs<br />
for decommissioning of production facilities, including primarily<br />
decommissioning of power stations and wind farms, and<br />
restoration of gas and oil drilling sites. The equivalent value<br />
of these obligations is recognised in production assets (property,<br />
plant and equipment) and depreciated together with the<br />
production assets. The increase in the provision for decommissioning<br />
obligations in <strong>2011</strong> was primarily due to new wind<br />
farms and gas and oil drilling sites.<br />
Provisions, others, include guarantee obligations; expected<br />
repayments to electricity consumers, etc., relating to litigation;<br />
contractual disputes; and provisions for onerous contracts, etc.<br />
Provisions are determined as expected future payments with<br />
addition of a risk premium and discounted to present value.<br />
The discount rate applied refl ects the general risk-free interest<br />
rate level in the given country. The range is 1.75%-5.75%<br />
(2010: 2.75%-5.75%).<br />
DKK million <strong>2011</strong> 2010<br />
0 - 1 year 517 444<br />
1 - 5 years 3,418 3,445<br />
5 - 10 years 3,304 2,202<br />
10 - 20 years 2,225 2,220<br />
20 - 30 years 1,854 621<br />
30 - 40 years 1,133 608<br />
More than 40 years 2 322<br />
provisions at 31 December 12,453 9,862<br />
100 104 COnsOliDatED finanCial statEmEnts – <strong>DONG</strong> ENERGY GROUP <strong>ANNUAL</strong> <strong>ANNUAL</strong> <strong>REPORT</strong> <strong>REPORT</strong> <strong>2011</strong><br />
<strong>2011</strong>
25 Loans and borrowings<br />
DKK million Current<br />
liabilities<br />
<strong>2011</strong> 2010<br />
non-derivative fi nancial instruments:<br />
Bond loans 3,717 18,961 22,678 3,737 22,833 26,570<br />
Bank overdrafts 114 - 114 19 - 19<br />
Other bank loans 1,681 15,754 17,435 641 10,673 11,314<br />
Trade payables 9,377 - 9,377 6,148 - 6,148<br />
Payables to associates 10 - 10 43 - 43<br />
Other payables<br />
Derivative fi nancial instruments:<br />
Fair value of derivative fi nancial instruments,<br />
6,793 616 7,409 7,416 54 7,470<br />
see note 33 13,095 - 13,095 13,350 - 13,350<br />
non-fi nancial liabilities:<br />
Construction contracts, see note 20 461 - 461 18 - 18<br />
Deferred income 1,089 1,713 2,802 609 1,634 2,243<br />
loans and borrowings before obligations relating<br />
to assets classifi ed as held for sale 36,337 37,044 73,381 31,981 35,194 67,175<br />
Liabilities relating to assets classifi ed as held for<br />
sale 385 - 385 163 - 163<br />
loans and borrowings at 31 December, incl.<br />
obligations relating to assets classifi ed as held<br />
for sale 36,722 37,044 73,766 32,144 35,194 67,338<br />
At 31 December <strong>2011</strong>, <strong>DONG</strong> <strong>Energy</strong> had loans totalling DKK<br />
11,851 million (2010: DKK 9,097 million) from the European<br />
Investment Bank and the Nordic Investment Bank to fund<br />
certain assets, including marine gas pipelines, Avedøre power<br />
station and a number of offshore wind farms in Denmark and<br />
the UK. The loans offered by these multilateral fi nancial institutions<br />
include loans to co-fund infrastructure and energy<br />
projects on favourable terms and with maturities that often<br />
exceed those normally available in the commercial banking<br />
market.<br />
In connection with these loans, the Group may be met with demands<br />
concerning collateral in the event of a player other than<br />
the Danish State acquiring more than 50% of the share capital<br />
or voting rights in <strong>DONG</strong> <strong>Energy</strong> A/S (change of control), or in<br />
the event of Moody’s or Standard & Poor’s downgrading <strong>DONG</strong><br />
<strong>Energy</strong> A/S’s rating to Baa3 or BBB- or less respectively.<br />
Non-current<br />
liabilities<br />
total<br />
Current<br />
liabilities<br />
Non-current<br />
liabilities<br />
total<br />
At 31 December <strong>2011</strong>, the Group also had non-cancellable<br />
revolving credit facilities totalling EUR 1.6 billion (2010: EUR<br />
1.0 billion). These revolving credit facilities are primarily used<br />
as cash resources and remained undrawn at 31 December<br />
<strong>2011</strong>. In connection with these credit facilities, the Group may<br />
be met with demands concerning collateral in the event of<br />
other players than a group consisting of the Danish State and<br />
Danish electricity distribution companies acquiring more than<br />
50% of the share capital or voting rights in <strong>DONG</strong> <strong>Energy</strong> A/S,<br />
or in the event of the Danish State ceasing to hold at least<br />
20% of the share capital.<br />
The Group’s fi nancing agreements are not subject to any other<br />
unusual terms or conditions. Pledging of collateral in connection<br />
with loans is disclosed in note 36.<br />
<strong>DONG</strong> ENERGY <strong>DONG</strong> ENERGY GROUP <strong>ANNUAL</strong> <strong>REPORT</strong> <strong>2011</strong> – COnsOliDatED finanCial statEmEnts<br />
105 101<br />
notes
notes<br />
26 Interest-bearing debt and capital employed<br />
DKK million <strong>2011</strong> 2010<br />
interest-bearing net debt can be broken down as follows:<br />
interest-bearing debt<br />
Bond loans 22,678 26,570<br />
Bank loans 17,549 11,333<br />
Payables to associates 10 43<br />
Other interest-bearing liabilities 724 450<br />
interest-bearing debt 40,961 38,396<br />
interest-bearing assets<br />
Securities 9,914 7,620<br />
Cash 2,342 4,147<br />
Of which non-interest-bearing (48) (15)<br />
Receivables from associates and jointly controlled entities 1,427 815<br />
Of which non-interest-bearing (11) (262)<br />
Receivables from the disposal of equity investments to non-controlling interests 1,345 1,740<br />
Capital contributions receivable from non-controlling interests 2,103 2,212<br />
Interest-bearing assets classifi ed as held for sale 274 -<br />
interest-bearing assets 17,346 16,257<br />
interest-bearing net debt 23,615 22,139<br />
Capital employed can be broken down as follows:<br />
Operating assets<br />
Total assets 154,073 137,339<br />
Interest-bearing assets (17,346) (16,257)<br />
non-interest-bearing assets 136,727 121,082<br />
Operating liabilities<br />
Total liabilities 96,333 86,031<br />
Interest-bearing debt (40,961) (38,396)<br />
non-interest-bearing debt 55,372 47,635<br />
non-interest-bearing net assets 81,355 73,447<br />
reconciliation<br />
Non-interest-bearing net assets 81,355 73,447<br />
Interest-bearing net debt (23,615) (22,139)<br />
Equity 57,740 51,308<br />
102 106 COnsOliDatED finanCial statEmEnts – <strong>DONG</strong> ENERGY GROUP <strong>ANNUAL</strong> <strong>ANNUAL</strong> <strong>REPORT</strong> <strong>REPORT</strong> <strong>2011</strong><br />
<strong>2011</strong>
27 Income tax receivable and payable<br />
DKK million <strong>2011</strong> 2010<br />
Income tax payable at 1 January, net 594 (383)<br />
Foreign exchange adjustments 4 12<br />
Adjustments to current tax in respect of prior years (85) 65<br />
Payments in respect of prior years (505) 451<br />
Current tax for the year 2,294 1,713<br />
Current tax for the year from other comprehensive income (170) (590)<br />
Current tax for the year relating to hybrid capital (246) (117)<br />
Payments for the year (1,142) (557)<br />
income tax payable at 31 December, net 744 594<br />
income tax at 31 December is recognised as follows:<br />
Income tax receivable (assets) 19 27<br />
Income tax payable (liabilities) (763) (621)<br />
income tax payable at 31 December, net (744) (594)<br />
28 Acquisition of enterprises<br />
acquisition of enterprises in <strong>2011</strong><br />
There were no business combinations in <strong>2011</strong> or 2010. Reversal<br />
of provisions relating to acquisitions in previous years<br />
amounted to DKK 22 million in <strong>2011</strong> (2010: DKK 33 million).<br />
acquisition of enterprises in 2012<br />
In January 2012, <strong>DONG</strong> <strong>Energy</strong> obtained control of CT Offshore<br />
A/S when it exercised a purchase option. The ownership interest<br />
was previously classifi ed as an associate and recognised<br />
using the equity method.<br />
Existing ownership interests are valued at fair value, with recognition<br />
of the DKK 17 million fair value adjustment in gain on<br />
disposal of enterprises. The allocation of the cost of identifi -<br />
able assets, liabilities and contingent liabilities had yet to be<br />
fi nalised at the time of publication of the consolidated fi nancial<br />
statements for <strong>2011</strong>, and the items in the opening balance<br />
sheet may therefore subsequently be changed. The accounting<br />
DKK million<br />
Existing<br />
ownership<br />
interest<br />
Ownership<br />
interest<br />
acquired<br />
<strong>DONG</strong><br />
<strong>Energy</strong><br />
ownership<br />
interest,<br />
total<br />
CT Offshore A/S 29% 37.67% 66.67%<br />
treatment of the acquisition will be completed within one year<br />
in accordance with IFRS 3.<br />
The step acquisition of CT Offshore is in keeping with <strong>DONG</strong><br />
<strong>Energy</strong>’s strategy in offshore wind. Goodwill relates to employee<br />
skills and expected cost synergies. The goodwill recognised<br />
in respect of the transaction is not deductible for tax purposes.<br />
The fair value of non-controlling interests is based on the<br />
present value of the acquiree’s expected future cash fl ows. The<br />
key assumptions applied are expected daily rates for vessels<br />
and the level of activity.<br />
Assets acquired in stages include trade receivables of DKK 38<br />
million. None of the trade receivables acquired was deemed to<br />
be uncollectible at the date of acquisition.<br />
Acquisition<br />
date<br />
9 January<br />
2012<br />
Core<br />
activity Cost<br />
cash<br />
purchase<br />
price, net<br />
Offshore<br />
cable<br />
installation 244 153<br />
<strong>DONG</strong> ENERGY <strong>DONG</strong> ENERGY GROUP <strong>ANNUAL</strong> <strong>REPORT</strong> <strong>2011</strong> – COnsOliDatED finanCial statEmEnts<br />
103 107<br />
notes
notes<br />
28 Acquisition of enterprises<br />
DKK million ct offshore<br />
Consideration for ownership interest acquired 153<br />
Fair value of existing ownership interest 91<br />
Consideration 244<br />
Fair value of identifi able assets, liabilities and contingent liabilities 251<br />
Non-controlling interests (82)<br />
Goodwill 75<br />
total 244<br />
Determination of gain on value adjustment of existing ownership interest in enterprise acquired in<br />
stages:<br />
Fair value of existing ownership interest 91<br />
Carrying amount of existing ownership interest (74)<br />
Gain recognised in gain on disposal of enterprises 17<br />
DKK million<br />
carrying amount<br />
before<br />
acquisition date<br />
Ct Offshore<br />
fair value at<br />
acquisition date<br />
Intangible assets - 75<br />
Property, plant and equipment 238 406<br />
Receivables 45 45<br />
Non-current liabilities (97) (138)<br />
Current liabilities (61) (61)<br />
net assets 125 327<br />
Non-controlling interests (83)<br />
DOnG <strong>Energy</strong>’s share of net assets 244<br />
Intragroup debt acquired -<br />
Cash acquired -<br />
Cash purchase price, net 244<br />
108 104 COnsOliDatED finanCial statEmEnts – <strong>DONG</strong> ENERGY <strong>ANNUAL</strong> GROUP <strong>ANNUAL</strong> <strong>REPORT</strong> <strong>REPORT</strong> <strong>2011</strong><br />
<strong>2011</strong>
29 Disposal of enterprises<br />
DKK million <strong>2011</strong> 2010<br />
Other non-current assets 14 1,373<br />
Other current assets 406 48<br />
Current liabilities (395) (28)<br />
Adjustment of purchase price (221) -<br />
Gain on disposal of enterprises 225 905<br />
selling price 29 2,298<br />
Of which selling price receivable (4) -<br />
Received in respect of prior year disposals 30 -<br />
Cash transferred (10) (19)<br />
cash selling price 45 2,279<br />
<strong>2011</strong><br />
DKK million gain/(loss)<br />
Elsamprojekt Polska (Thermal Power) 1<br />
Odense Kraftvarmeværk A/S (Thermal Power) -<br />
Frederikshavn Affaldskraftvarmeværk A/S (Thermal Power) -<br />
DELPRO A/S and adjustment Fiber Newco A/S earn-out (Sales & Distribution)<br />
Purchase price adjustment relating to Energi E2 Renewables Ibericas S.L. (Wind<br />
3<br />
Power) 221<br />
Gain on disposal of enterprises 225<br />
An amount of DKK 221 million has been recognised as income<br />
in respect of purchase price adjustment relating to the dis-<br />
2010<br />
posal of Energi E2 Renewables Ibericas S.L. (wind activities in<br />
Spain and Portugal) in 2007.<br />
DKK million Gain/(loss)<br />
Nordkraft AS and Salten Kraftsamband AS (Wind Power) 696<br />
Elsam France S.A.S. (Wind Power) 25<br />
Dansk Gasteknisk Center A/S (Sales & Distribution) -<br />
Swedegas AB (<strong>Energy</strong> Markets) 184<br />
Gain on disposal of enterprises 905<br />
<strong>DONG</strong> ENERGY <strong>DONG</strong> ENERGY GROUP <strong>ANNUAL</strong> <strong>REPORT</strong> <strong>2011</strong> – COnsOliDatED finanCial statEmEnts<br />
109 105<br />
notes
notes<br />
30 Transactions with non-controlling interests<br />
transactions with non-controlling interests<br />
DKK million <strong>2011</strong> 2010<br />
Dividends paid to non-controlling interests (16) -<br />
Acquisition of equity investments from non-controlling interests (76) (138)<br />
Disposal of equity investments to non-controlling interests 1,541 119<br />
Other capital transactions with non-controlling interests 2,496 349<br />
transactions with non-controlling interests 3,945 330<br />
acquisition of equity investments from non-controlling interests<br />
DKK million <strong>2011</strong> 2010<br />
Purchase price 76 138<br />
Of which payable - -<br />
Cash purchase price 76 138<br />
Acquisition of equity investments from non-controlling interests<br />
in <strong>2011</strong> comprises the acquisition of 16.43% of <strong>DONG</strong><br />
<strong>Energy</strong> Germany AG and the payment of contingent consideration<br />
relating to Borkum Riffgrund I Holding A/S.<br />
Disposal of equity investments to non-controlling interests<br />
Acquisition of equity investments from non-controlling interests<br />
in 2010 comprises the acquisition of 25.1% of <strong>DONG</strong> <strong>Energy</strong><br />
Kraftwerke Greifswald GmbH & Co. KG and 25% of <strong>DONG</strong><br />
<strong>Energy</strong> Sales GmbH.<br />
DKK million <strong>2011</strong> 2010<br />
Selling price 1,767 1,666<br />
Transaction costs (53) (41)<br />
Of which receivables (173) (1,506)<br />
Cash selling price 1,541 119<br />
Disposal of equity investments to non-controlling<br />
interests in <strong>2011</strong><br />
Disposal of equity investments to non-controlling interests<br />
comprises the disposal of 49.9% of Gunfl eet Sands Holding<br />
Limited and adjustments in respect of prior year disposals.<br />
The selling price for Gunfl eet Sands Holding Limited is contingent<br />
on certain future conditions. The selling price was<br />
determined based on management’s best estimate of the<br />
probability of these conditions being met.<br />
106 110 COnsOliDatED finanCial statEmEnts – <strong>DONG</strong> ENERGY GROUP <strong>ANNUAL</strong> <strong>ANNUAL</strong> <strong>REPORT</strong> <strong>REPORT</strong> <strong>2011</strong><br />
<strong>2011</strong><br />
Disposal of equity investments to non-controlling<br />
interests in 2010<br />
Disposal of equity investments to non-controlling interests<br />
comprises the disposal of 24.8% of Walney (UK) Offshore<br />
Windfarms Ltd. and 14.5% of <strong>DONG</strong> <strong>Energy</strong> Nysted I A/S.<br />
The selling price for Walney (UK) Offshore Windfarms Ltd. is<br />
contingent on certain future conditions being met. The selling<br />
price was determined based on management’s best estimate<br />
of the probability of these conditions being met.
Other capital transactions with non-controlling interests<br />
DKK million <strong>2011</strong> 2010<br />
Capital contributions from non-controlling interests 2,668 2,613<br />
Other payments from non-controlling interests 1,931 -<br />
Of which receivables (2,103) (2,264)<br />
Cash contribution 2,496 349<br />
Cash contribution primarily represents contributions from<br />
non-controlling interests in respect of the construction of wind<br />
farms.<br />
31 Cash and cash equivalents and securities<br />
DKK million <strong>2011</strong> 2010<br />
Available cash 1,554 3,644<br />
Bank overdrafts that are part of the ongoing cash management, see note 25 (114) (19)<br />
Cash and cash equivalents at 31 December, see statement of cash fl ows 1,440 3,625<br />
Cash can be broken down into the following balance sheet items:<br />
Available cash 1,554 3,644<br />
Cash not available for use 788 503<br />
Cash at 31 December 2,342 4,147<br />
securities can be broken down into the following balance sheet items:<br />
Available securities 8,129 7,470<br />
Securities not available for use 1,785 150<br />
securities at 31 December 9,914 7,620<br />
Cash not available for use primarily comprises cash and cash<br />
equivalents tied up for use in jointly controlled wind turbine<br />
projects, cash and cash equivalents pledged as collateral for<br />
trading in fi nancial instruments, cash and cash equivalents to<br />
cover insurance-related provisions, and cash and cash equivalents<br />
received from the users of the North Sea oil pipeline for<br />
use for pipeline maintenance.<br />
The securities are part of <strong>DONG</strong> <strong>Energy</strong>’s ongoing cash management.<br />
In accordance with IAS 7, cash fl ows from securities<br />
are recognised in cash fl ows from investing activities.<br />
The securities are primarily highly liquid AAA-rated Danish<br />
mortgage bonds that qualify for repos in the Danish Central<br />
Bank.<br />
Securities not available for use comprise securities that form<br />
part of genuine sale and repurchase transactions (repo transactions)<br />
amounting to DKK 1,536 million (2010: DKK 0 million)<br />
and securities used to cover insurance-related provisions.<br />
<strong>DONG</strong> ENERGY <strong>DONG</strong> ENERGY GROUP <strong>ANNUAL</strong> <strong>REPORT</strong> <strong>2011</strong> – COnsOliDatED finanCial statEmEnts<br />
107 111<br />
notes
notes<br />
32 Credit and market risks<br />
DKK million<br />
Clearing<br />
centres AAA/Aaa AA/Aa A/A BBB/Baa Other total<br />
<strong>2011</strong> 3,430 8,350 5,226 8,621 1,471 9,078 36,176<br />
2010 7,153 7,097 4,883 8,212 357 7,897 35,599<br />
Credit risks<br />
The table above provides an overview of the credit quality of<br />
the market value of derivative fi nancial instruments, cash and<br />
bond portfolios and trade receivables at 31 December <strong>2011</strong><br />
in the <strong>DONG</strong> <strong>Energy</strong> Group based on the individual counterparty’s<br />
ratings with Standard & Poor’s and Moody’s.<br />
The amounts stated do not include any collateral and therefore<br />
do not refl ect the actual credit risk.<br />
Like previous years, <strong>DONG</strong> <strong>Energy</strong>’s counterparty risks are<br />
concentrated on companies with a rating of A/A or above. The<br />
AA/Aa and A/A categories cover trading with large international<br />
energy companies and banks. Such trading is regulated<br />
under standard agreements, such as EFET and ISDA agreements,<br />
which feature credit rating and netting provisions. The<br />
AAA/Aaa category covers <strong>DONG</strong> <strong>Energy</strong>’s position in Danish<br />
AAA-rated mortgage bonds.<br />
The value of trading at clearing centres decreased signifi cantly<br />
compared with 2010, whereas the other categories increased.<br />
This refl ected a combination of changed trading activity in<br />
connection with hedging of <strong>DONG</strong> <strong>Energy</strong>’s market risk and<br />
market value changes in relation to the date of conclusion<br />
of each transaction determined at 31 December. The ‘Other’<br />
group predominantly consists of trade receivables from customers,<br />
such as end users and PSO customers.<br />
Further details of the Group’s risk management are provided<br />
in the chapter on Risk and risk management on pages 44-49<br />
of Management’s review.<br />
market risks<br />
The market risk on commodities primarily relates to portfolio<br />
management and trading activities. The Group is exposed<br />
to two types of energy risk: fl uctuations in market prices and<br />
fl uctuations in volumes due to the fl uctuating needs of the<br />
underlying business.<br />
By virtue of its day-to-day activities, the Group is exposed to<br />
fl uctuations in the prices of gas, oil, electricity, coal and CO2 108 112 COnsOliDatED finanCial statEmEnts – <strong>DONG</strong> ENERGY GROUP <strong>ANNUAL</strong> <strong>ANNUAL</strong> <strong>REPORT</strong> <strong>REPORT</strong> <strong>2011</strong><br />
<strong>2011</strong><br />
and, to a lesser extent, other commodities. The Group trades<br />
actively in these commodities in the relevant markets to hedge<br />
and optimise its supply requirements and secure the Group’s<br />
supply chain. In this connection, the Group uses derivatives to<br />
hedge its positions.<br />
The sensitivity analysis below shows the effect of market value<br />
changes assuming a relative price change at 31 December<br />
<strong>2011</strong>. The illustrated effect on profi t comprises fi nancial instruments<br />
that remained open at the balance sheet date and have<br />
an effect on profi t in the fi nancial year in question. Besides<br />
derivative fi nancial instruments on commodities and currency,<br />
fi nancial instruments in this context include receivables and<br />
payables in foreign currencies.<br />
It should be noted that the illustrated sensitivities only comprise<br />
the Group’s fi nancial instruments and therefore exclude<br />
the effect from contracts concluded under which physical<br />
delivery of the underlying assets is made, as these are not<br />
recognised as fi nancial instruments in accordance with IAS<br />
39. The sensitivity thus only comprises the derivative fi nancial<br />
instruments and not the physical contracts they hedge.<br />
The implementation of business performance has made the<br />
Group more sensitive to changes in commodity prices and<br />
exchange rates in the statement of comprehensive income, but<br />
has reduced its sensitivity in equity. The fi nancial instruments<br />
that form part of the sensitivity analysis are fi nancial instruments<br />
and fi nancial contracts measured at market value and<br />
the Group’s receivables, cash and trade payables and its external<br />
fi nancing such as bank loans and bond loans.<br />
Net investments and associated hedging of net investments in<br />
foreign subsidiaries are not included, as the effect of the sum<br />
of the investment and the hedging is considered to be neutral<br />
to price changes. For further details of the Group’s net investments<br />
and hedging of same, reference is made to note 33.
Risk Price change<br />
Effect on<br />
profi t before tax<br />
At 31 December <strong>2011</strong> At 31 December 2010<br />
Effect on<br />
equity before tax<br />
Effect on<br />
profi t before tax<br />
Effect on<br />
equity before tax<br />
Oil +10% 751 - 867 (427)<br />
-10% (719) - (923) 522<br />
Gas +10% (1,572) - (17) -<br />
-10% 1,572 - 17 -<br />
Electricity +10% (636) - 523 (308)<br />
-10% 599 - (524) 308<br />
Coal +10% 25 - (173) 176<br />
-10% (25) - 173 (176)<br />
USD +10% 393 - (152) 1,531<br />
-10% (393) - 152 (1,531)<br />
GBP +10% (369) (94) 17 156<br />
-10% 369 94 (17) (156)<br />
NOK +10% (205) (5) (282) 21<br />
-10% 205 5 282 (21)<br />
SEK +10% 75 (3) 70 (43)<br />
-10% (68) 3 (70) 43<br />
EUR +10% (535) - (1,479 (75)<br />
-10% 535 - 1,479 75<br />
Other +10% 2 9 - -<br />
-10% (2) (9) - -<br />
Interest +100 basis points (237) 448 (482) 279<br />
<strong>DONG</strong> ENERGY <strong>DONG</strong> ENERGY GROUP <strong>ANNUAL</strong> <strong>REPORT</strong> <strong>2011</strong> – COnsOliDatED finanCial statEmEnts<br />
109 113<br />
notes
notes<br />
33 Financial instruments<br />
maturity analysis of fi nancial liabilities, including interest payments<br />
<strong>2011</strong><br />
DKK million Carrying<br />
amount<br />
Payment<br />
obligation<br />
2012 2013 2014 2015 2016<br />
Bond loans 22,678 35,618 4,856 1,009 4,726 827 4,544 19,656<br />
Bank overdrafts 114 114 114 - - - - -<br />
Other bank loans 17,435 20,679 2,126 2,361 1,022 791 1,282 13,097<br />
Trade payables 9,377 9,377 9,377 - - - - -<br />
Payables to associates 10 10 10 - - - - -<br />
Fair value of derivative<br />
fi nancial instruments 13,095 13,378 9,374 1,830 729 139 110 1,196<br />
Other payables 7,409 7,409 6,793 616 - - - -<br />
at 31 December 70,118 86,585 32,650 5,816 6,477 1,757 5,936 33,949<br />
In this connection, on 31 December <strong>2011</strong>, <strong>DONG</strong> <strong>Energy</strong> issued<br />
hybrid capital with a principal of DKK 9,664 million and<br />
maturity in the year 3005 (DKK 4,460 million) and 3010 (DKK<br />
5,204 million).<br />
The maturity analysis is based on undiscounted cash fl ows<br />
relating to fi nancial liabilities. Derivative fi nancial instruments<br />
2010<br />
DKK million Carrying<br />
amount<br />
Payment<br />
obligation<br />
After<br />
2016<br />
have been used to hedge interest rate and currency risks on<br />
the Group’s loan portfolio.<br />
Apart from the fair value of derivative fi nancial instruments,<br />
current liabilities fall due for payment less than one year after<br />
the end of the fi nancial year. Other liabilities predominantly<br />
comprised VAT and indirect taxes as well as deferred income.<br />
<strong>2011</strong> 2012 2013 2014 2015<br />
Bond loans 26,570 40,401 5,044 4,980 1,004 4,728 822 23,823<br />
Bank overdrafts 19 19 19 - - - - -<br />
Other bank loans 11,314 13,260 879 383 2,194 617 539 8,648<br />
Trade payables 6,148 6,148 6,148 - - - - -<br />
Payables to associates 43 43 43 - - - - -<br />
Fair value of derivative<br />
fi nancial instruments 13,350 13,350 10,542 1,519 523 153 17 596<br />
Other payables 7,470 7,470 7,416 54 - - - -<br />
at 31 december 64,914 80,691 30,091 6,936 3,721 5,498 1,378 33,067<br />
110 114 COnsOliDatED finanCial statEmEnts – <strong>DONG</strong> ENERGY GROUP <strong>ANNUAL</strong> <strong>ANNUAL</strong> <strong>REPORT</strong> <strong>REPORT</strong> <strong>2011</strong><br />
<strong>2011</strong><br />
After<br />
2015
Categories of fi nancial instruments<br />
DKK million Carrying<br />
amount<br />
<strong>2011</strong> 2010<br />
Derivative fi nancial instruments included in trading portfolio 16,301 16,301 10,359 10,359<br />
Securities 9,914 9,914 7,620 7,620<br />
financial assets measured at fair value via profi t for the year 26,215 26,215 17,979 17,979<br />
Derivative fi nancial instruments entered into to hedge future cash fl ows - - 4,174 4,174<br />
Derivative fi nancial instruments entered into to hedge net investments in<br />
foreign enterprises 455 455 203 203<br />
Derivative fi nancial instruments entered into to hedge fair values 405 405 170 170<br />
financial assets used as hedging instruments 860 860 4,547 4,547<br />
Trade receivables 7,634 7,634 9,451 9,451<br />
Receivables from the disposal of activities 1,554 1,554 1,974 1,974<br />
Other receivables 8,530 8,530 7,525 7,525<br />
Cash 2,342 2,342 4,147 4,147<br />
loans and receivables 20,060 20,060 23,097 23,097<br />
Other equity investments 418 418 374 374<br />
financial assets available for sale 418 418 374 374<br />
Derivative fi nancial instruments included in trading portfolio 11,755 11,755 8,681 8,681<br />
financial liabilities measured at fair value via profi t for the year 11,755 11,755 8,681 8,681<br />
Derivative fi nancial instruments entered into to hedge future cash fl ows<br />
Derivative fi nancial instruments entered into to hedge net investments in<br />
1,028 1,028 4,545 4,545<br />
foreign enterprises 1,293 1,293 433 433<br />
Derivative fi nancial instruments entered into to hedge fair values 120 120 136 136<br />
financial liabilities used as hedging instruments 2,441 2,441 5,114 5,114<br />
Bond loans 22,678 25,228 26,570 28,149<br />
Bank loans 17,549 18,271 11,333 11,770<br />
Other payables 12,546 12,546 12,205 12,205<br />
financial liabilities measured at amortised cost 52,773 56,045 50,108 52,124<br />
The fair value has been determined as the present value of<br />
expected future instalments and interest payments using the<br />
Group’s current interest rate on loans as discount rate.<br />
Fair value<br />
Carrying<br />
amount<br />
The nominal value of bond loans, bank overdrafts and other<br />
bank loans was DKK 40,584 million (2010: DKK 38,028<br />
million).<br />
<strong>DONG</strong> ENERGY <strong>DONG</strong> ENERGY GROUP <strong>ANNUAL</strong> <strong>REPORT</strong> <strong>2011</strong> – COnsOliDatED finanCial statEmEnts<br />
115 111<br />
Fair value<br />
notes
notes<br />
33 Financial instruments<br />
fair value of derivative fi nancial instruments<br />
<strong>2011</strong> 2010<br />
DKK million Positive Negative net Positive Negative net<br />
Commodities:<br />
Oil swaps 2,255 (1,952) 303 1,346 (1,171) 175<br />
Oil options 514 (101) 413 829 - 829<br />
Gas swaps 4,083 (2,538) 1,545 1,258 (1,369) (111)<br />
Electricity swaps 6,566 (4,731) 1,835 8,850 (8,407) 443<br />
Electricity options 23 (529) (506) 6 (7) (1)<br />
CO2 emissions allowances 417 (130) 287 131 (126) 5<br />
Coal forwards<br />
Currency:<br />
715 (797) (82) 1,099 (855) 244<br />
Forward exchange contracts 920 (939) (19) 368 (607) (239)<br />
Currency swaps<br />
interest:<br />
423 (449) (26) 340 (199) 141<br />
Interest rate swaps 144 (929) (785) 234 (609) (375)<br />
at 31 December 16,060 (13,095) 2,965 14,461 (13,350) 1,111<br />
<strong>2011</strong> 2010<br />
DKK million Positive Negative net Positive Negative net<br />
0-6 months 7,612 (6,288) 1,324 6,808 (7,232) (424)<br />
6-12 months 3,739 (3,018) 721 3,284 (3,310) (26)<br />
1-2 years 2,495 (1,789) 706 2,049 (1,519) 530<br />
2-3 years 936 (709) 227 829 (523) 306<br />
More than 3 years 1,278 (1,291) (13) 1,491 (766) 725<br />
at 31 December 16,060 (13,095) 2,965 14,461 (13,350) 1,111<br />
The Group uses derivative fi nancial instruments as part of its<br />
risk management, trading and when position taking. The<br />
112 116 COnsOliDatED finanCial statEmEnts – <strong>DONG</strong> ENERGY GROUP <strong>ANNUAL</strong> <strong>ANNUAL</strong> <strong>REPORT</strong> <strong>REPORT</strong> <strong>2011</strong><br />
<strong>2011</strong><br />
maturity analysis for interest rate swaps refl ects the expected<br />
maturity for each contract.
securities<br />
<strong>2011</strong><br />
DKK million Nominal<br />
value<br />
Carrying<br />
amount<br />
Avg. interest<br />
rate (%)<br />
Maturity<br />
2012 2013 2014 2015 2016<br />
Fixed-interest 4,929 4,968 2.94 205 559 2,125 206 1,148 725<br />
Floating-rate 3,156 3,161 1.51 1,724 397 687 - 353 -<br />
Distributable securities 8,085 8,129 1,929 956 2,812 206 1,501 725<br />
Fixed-rate securities forming part<br />
of repo transactions 1,502 1,536 2.00 - 509 - 1,027 - -<br />
Fixed-interest securities pledged as<br />
collateral in respect of insurancerelated<br />
provisions 250 249 2.60 249 - - - - -<br />
at 31 December 9,837 9,914 2,178 1,465 2,812 1,233 1,501 725<br />
2010<br />
DKK million Nominal<br />
value<br />
Carrying<br />
amount<br />
Avg. interest<br />
rate (%)<br />
Maturity<br />
<strong>2011</strong> 2012 2013 2014 2015<br />
Fixed-interest 5,551 5,569 3.20 4,014 - 502 - 483 570<br />
Floating-rate 1,896 1,901 1.43 398 1,503 - - - -<br />
Distributable securities 7,447 7,470 4,412 1,503 502 0 483 570<br />
Fixed-interest securities pledged as<br />
collateral in respect of insurancerelated<br />
provisions 150 150 4.00 150 - - - - -<br />
at 31 December 7,597 7,620 4,562 1,503 502 0 483 570<br />
In <strong>2011</strong>, <strong>DONG</strong> <strong>Energy</strong> started using genuine sale and repurchase<br />
transactions (repo transactions) in connection with the<br />
management of the Group’s ongoing cash fl ow management.<br />
After<br />
2016<br />
After<br />
2015<br />
In this connection, <strong>DONG</strong> <strong>Energy</strong> uses its bond portfolio as<br />
sales instrument.<br />
<strong>DONG</strong> ENERGY <strong>DONG</strong> ENERGY GROUP <strong>ANNUAL</strong> <strong>REPORT</strong> <strong>2011</strong> – COnsOliDatED finanCial statEmEnts<br />
113 117<br />
notes
notes<br />
33 Financial instruments<br />
trading portfolio, economic hedging and cash fl ow hedging<br />
<strong>2011</strong><br />
Total<br />
Trading portfolio<br />
and economic hedging<br />
DKK million Notional amount Fair value Notional amount Fair value<br />
commodities:<br />
Oil swaps 6,129 303 6,129 303<br />
Oil options 1,192 413 1,192 413<br />
Gas swaps 22,032 1,545 22,032 1,545<br />
Electricity swaps 19,006 1,835 19,006 1,835<br />
Electricity options 444 (506) 444 (506)<br />
CO2 emissions allowances 512 287 512 287<br />
Coal forwards<br />
Currency:<br />
1,636 (82) 1,636 (82)<br />
Forward exchange contracts 9,240 300 3,751 467<br />
Currency swaps<br />
interest:<br />
7,014 352 6,177 367<br />
Interest rate swaps 10,033 (929) 550 (83)<br />
total derivative fi nancial instruments 77,238 3,518 61,429 4,546<br />
Cash fl ow hedging<br />
DKK million Notional<br />
amount<br />
Fair value<br />
Recognised<br />
in equity<br />
Expected date<br />
of transfer to profi t for the year<br />
2012 2013 2014<br />
commodities:<br />
Oil swaps - - (184) (90) (39) (55) -<br />
Oil options - - 317 208 109 - -<br />
Gas swaps - - - - - - -<br />
Electricity swaps - - (69) (65) (4) - -<br />
Electricity options - - - - - - -<br />
CO2 emissions allowances - - - - - - -<br />
Coal forwards<br />
Currency:<br />
- - 56 45 11 - -<br />
Forward exchange contracts 5,489 (167) (1,457) (392) (486) (477) (102)<br />
Currency swaps<br />
interest:<br />
837 (15) 153 20 34 64 35<br />
Interest rate swaps 9,483 (846) (848) (6) (25) (5) (812)<br />
total derivative fi nancial<br />
instruments 15,809 (1,028) (2,032) (280) (400) (473) (879)<br />
114 118 COnsOliDatED finanCial statEmEnts – <strong>DONG</strong> ENERGY GROUP <strong>ANNUAL</strong> <strong>ANNUAL</strong> <strong>REPORT</strong> <strong>REPORT</strong> <strong>2011</strong><br />
<strong>2011</strong><br />
After<br />
2014
trading portfolio, economic hedging and cash fl ow hedging<br />
2010 Total<br />
Trading portfolio<br />
and economic hedging<br />
DKK million Notional amount Fair value Notional amount Fair value<br />
commodities:<br />
Oil swaps 11,603 175 9,794 557<br />
Oil options 8,148 829 - -<br />
Gas swaps 1,272 (111) 1,272 (111)<br />
Electricity swaps 13,848 442 8,689 1,257<br />
CO2 emissions allowances 258 34 258 34<br />
Coal forwards<br />
Currency:<br />
1,959 244 71 14<br />
Forward exchange contracts 7,563 (141) - -<br />
Currency swaps<br />
interest:<br />
10,778 221 5,305 53<br />
Interest rate swaps 18,494 (386) 13,650 (126)<br />
total derivative fi nancial instruments 73,923 1,307 39,039 1,678<br />
Cash fl ow hedging<br />
DKK million Notional<br />
commodities:<br />
amount<br />
Fair value<br />
Recognised<br />
in equity<br />
Expected date of transfer<br />
to profi t for the year<br />
<strong>2011</strong> 2012 2013<br />
Oil swaps 1,809 (382) (370) (186) (90) (39) (55)<br />
Oil options 8,148 829 493 176 208 109 -<br />
Gas swaps - - - - - - -<br />
Electricity swaps 5,159 (815) (552) (482) (65) (4) (1)<br />
CO 2 emissions allowances - - - - - - -<br />
Coal forwards 1,888 230 144 70 63 11 -<br />
Currency:<br />
Forward exchange contracts 7,563 (141) (1,280) (64) (220) (423) (573)<br />
Currency swaps<br />
interest:<br />
5,473 168 339 163 73 (3) 106<br />
Interest rate swaps 4,844 (260) (265) - - (26) (239)<br />
total derivative fi nancial<br />
instruments 34,884 (371) (1,491) (323) (31) (375) (762)<br />
After<br />
2013<br />
<strong>DONG</strong> ENERGY <strong>DONG</strong> ENERGY GROUP <strong>ANNUAL</strong> <strong>REPORT</strong> <strong>2011</strong> – COnsOliDatED finanCial statEmEnts<br />
119 115<br />
notes
notes<br />
33 Financial instruments<br />
In <strong>2011</strong>, in connection with the introduction of business performance,<br />
the Group discontinued the application of hedge<br />
accounting for commodities and related currency exposures.<br />
Commodity hedge transactions, DKK 120 million, all of which<br />
relate to hedging transactions entered into in or before 2010<br />
are recognised in hedging of future cash fl ows. All commodity<br />
hedges and related currency exposures recognised in hedging<br />
of future cash fl ows are expected to be realised by 2014.<br />
Hedging of fair values, currency<br />
<strong>2011</strong><br />
DKK million Assets<br />
Liabilities<br />
Hedged using<br />
hedging<br />
instruments<br />
net position<br />
Fair value<br />
of hedging<br />
instrument<br />
EUR 16,592 (40,252) 18,095 (5,565) (5)<br />
USD 4,607 (7,659) 1,439 (1,613) (48)<br />
GBP 6,155 (9,085) - (2,930) -<br />
SEK 1,154 (84) - 1,070 -<br />
NOK 919 (2,964) - (2,045) -<br />
Other 137 (118) - 19 -<br />
total 29,564 (60,162) 19,534 (11,064) (53)<br />
2010<br />
DKK million Assets<br />
Liabilities<br />
Hedged using<br />
hedging<br />
instruments<br />
net position<br />
Fair value<br />
of hedging<br />
instrument<br />
EUR 15,921 (43,262) 12,553 (14,788) 41<br />
USD 2,020 (4,707) 1,437 (1,250) (82)<br />
GBP 7,333 (6,459) - 874 -<br />
SEK 725 (61) - 664 -<br />
NOK 478 (3,298) - (2,820) -<br />
Other 182 (68) - 114 -<br />
total 26,659 (57,855) 13,990 (17,206) (41)<br />
In addition to the above, the fair value of the Group’s interest<br />
payments has been hedged in the form of interest rate<br />
swaps from fi xed to fl oating-rate. Interest swaps with a total<br />
value of DKK 4,386 million were entered into (2010: DKK<br />
4,398 million) and a fair value of DKK 144 million (2010: DKK<br />
11 million). Recognised value adjustments amounted to DKK<br />
133 million (2010: DKK 11 million), which was offset by fair<br />
116 120 COnsOliDatED finanCial statEmEnts – <strong>DONG</strong> ENERGY GROUP <strong>ANNUAL</strong> <strong>ANNUAL</strong> <strong>REPORT</strong> <strong>REPORT</strong> <strong>2011</strong><br />
<strong>2011</strong><br />
Ineffectiveness arising from hedging of future cash fl ows from<br />
commodity hedging and related currency exposures is recognised<br />
in the item effect of economic hedging with DKK 30<br />
million (2010: DKK 390 million), see note 4, and in fual and<br />
energy with DKK 47 million (2010: loss of DKK 9 million).<br />
Ineffectiveness of interest rate and currency hedging amounted<br />
to DKK 27 million (2010: DKK 7 million).<br />
value adjustments of a share of the portfolio that matures<br />
in 2014-2016 with a total amount outstanding of DKK 4,386<br />
million (2010: maturity 2014-2016 and outstanding amount<br />
DKK 4,398 million). The value adjustment of the hedging of<br />
the Group’s portfolio of CO 2 emissions allowances was DKK 0<br />
in <strong>2011</strong> (2010: loss of DKK 55 million), which was offset by fair<br />
value adjustment of the hedged CO 2 emissions allowance.
Hedging of net investments in foreign subsidiaries<br />
DKK million Net investment<br />
including equitylike<br />
loans<br />
Hedged amount<br />
in currency<br />
<strong>2011</strong> 2010<br />
net position<br />
Foreign exchangeadjustmentsrecognised<br />
in equity<br />
Net investment<br />
including equitylike<br />
loans<br />
Hedged amount<br />
in currency<br />
net position<br />
Foreign exchangeadjustmentsrecognised<br />
in equity<br />
GBP 25,771 (22,400) 3,371 236 21,678 (15,886) 5,792 147<br />
NOK 10,932 (3,361) 7,571 349 10,437 (3,962) 6,475 399<br />
SEK 2,776 (1,407) 1,369 (254) 2,714 (1,782) 932 (261)<br />
EUR 5,974 - 5,974 (9) 5,143 0 5,143 7<br />
PLN 1,243 (1,183) 60 (38) 1,457 (1,265) 192 (17)<br />
total 46,696 (28,351) 18,345 284 41,429 (22,895) 18,534 275<br />
Ineffectiveness relating to hedging of net investments in foreign<br />
subsidiaries was DKK 28 million (2010: DKK 3 million).<br />
fair value hierarchy of fi nancial instruments<br />
DKK million<br />
Quoted<br />
prices<br />
(Level 1)<br />
Observable<br />
inputs<br />
(Level 2)<br />
<strong>2011</strong> 2010<br />
Non-observable<br />
inputs<br />
(Level 3) total<br />
Quoted<br />
prices<br />
(Level 1)<br />
Observable<br />
inputs<br />
(Level 2)<br />
Non-observable<br />
inputs<br />
(Level 3) total<br />
Derivative fi nancial<br />
instruments - 13,967 2,093 16,060 - 12,819 1,642 14,461<br />
Securities 9,914 - - 9,914 7,620 - - 7,620<br />
assets 9,914 13,967 2,093 25,974 7,620 12,819 1,642 22,081<br />
Derivative fi nancial<br />
instruments - (12,135) (960) (13,095) - (13,312) (38) (13,350)<br />
liabilities 0 (12,135) (960) (13,095) 0 (13,312) (38) (13,350)<br />
Level 1 comprises quoted securities that are traded in active<br />
markets.<br />
Level 2 comprises derivative fi nancial instruments, where valuation<br />
models with observable inputs are used to measure fair<br />
value, but with discounting to present value applying one of<br />
the discount rates set by the Group. Level 2 also comprises<br />
quoted securities that have not been traded in the market suffi<br />
ciently for a reliable fair value to be obtained.<br />
Level 3 comprises primarily long-term contracts on purchase/<br />
sale of, in particular, electricity and gas, and oil options. The<br />
fair values are based on assumptions concerning the longterm<br />
prices of, in particular, electricity, gas, coal, USD, EUR,<br />
volatilities as well as risk premiums in respect of liquidity and<br />
market risks and are determined by discounting of expected<br />
cash fl ows. Level 3 also includes other fi nancial instruments in<br />
which primarily electricity, oil and gas prices have been estimated,<br />
and where the sum of these estimated, non-observable<br />
inputs may affect fair value.<br />
<strong>DONG</strong> ENERGY <strong>DONG</strong> ENERGY GROUP <strong>ANNUAL</strong> <strong>REPORT</strong> <strong>2011</strong> – COnsOliDatED finanCial statEmEnts<br />
121 117<br />
notes
notes<br />
33 Financial instruments<br />
reconciliation of fi nancial instruments based on non-observable inputs<br />
DKK million<br />
Derivative fi nancial<br />
instruments<br />
(assets)<br />
34 Jointly controlled entities<br />
<strong>DONG</strong> <strong>Energy</strong> has ownership interests in jointly controlled entities<br />
that primarily comprise ownership and operation of wind<br />
farms and power stations. The Group’s ownership interests in<br />
jointly controlled entities appear from note 42 in the complete<br />
annual report.<br />
<strong>DONG</strong> <strong>Energy</strong> has assumed investment obligations through<br />
its participation in jointly controlled entities and has made<br />
<strong>2011</strong> 2010<br />
Derivative fi nancial<br />
instruments<br />
(liabilities)<br />
Derivative fi nancial<br />
instruments<br />
(assets)<br />
Derivative fi nancial<br />
instruments<br />
(liabilities)<br />
Opening at 1 January 1,642 (38) 1,600 (126)<br />
Gains and losses recognised in profi t for<br />
the year as revenue (54) (449) (421) 103<br />
Purchases 561 (196) 12 (15)<br />
Other transfers to and from Level 3 (56) (277) 451 -<br />
Closing at 31 December 2,093 (960) 1,642 (38)<br />
A loss in respect of assets and liabilities that are valued based<br />
on non-observable inputs and were still recognised in the balance<br />
sheet at 31 December <strong>2011</strong> was recognised with DKK 137<br />
million (2010: loss of DKK 323 million) in profi t for the year as<br />
revenue.<br />
The fair value of fi nancial instruments based on non-observable<br />
inputs is signifi cantly affected by the non-observable<br />
inputs used. As a result of the long-term and illiquid nature<br />
of the contracts, the fair value may change signifi cantly in the<br />
event of a change in the Group’s reasonable expectations relating<br />
to the non-observable inputs used.<br />
capital commitments to jointly controlled entities, as shown in<br />
note 36.<br />
Contingent liabilities relating to jointly controlled entities are<br />
shown in note 37.<br />
The Group’s recognised share of the profi ts, costs, assets and<br />
liabilities of jointly controlled entities is as follows:<br />
DKK million <strong>2011</strong> 2010<br />
Income 854 570<br />
Expenses (589) (421)<br />
Non-current assets 15,160 5,823<br />
Current assets 2,286 1,481<br />
assets at 31 December 17,446 7,304<br />
Non-current liabilities 4,299 378<br />
Current liabilities 4,246 465<br />
liabilities at 31 December 8,545 843<br />
118 122 COnsOliDatED finanCial statEmEnts – <strong>DONG</strong> ENERGY GROUP <strong>ANNUAL</strong> <strong>ANNUAL</strong> <strong>REPORT</strong> <strong>REPORT</strong> <strong>2011</strong><br />
<strong>2011</strong>
35 Lease commitments<br />
<strong>2011</strong><br />
DKK million<br />
Assets held under operating leases comprise land and seabed<br />
relating to wind farms in the UK, Poland and Germany until<br />
2037, natural gas storage facilities in Germany until 2023, a<br />
power station site in the Netherlands until 2037, offi ce premises<br />
until 2022 and vehicles etc.<br />
Lease payments in respect of leasing of sea bed relating to<br />
wind farms in the UK vary with the MWh generated, but with<br />
agreed minimum lease payments.<br />
The Group has concluded operating leases in respect of an installation<br />
vessel for the construction of wind farms for the period<br />
2013-2015, a port in Belfast in Northern Ireland for the period<br />
2013-2017 and seabed for wind farms in the UK from 2012<br />
and up to 50 years thereafter (including options for extension).<br />
The lease relating to the port includes an option under which it<br />
may be extended by fi ve years.<br />
Operating leases Finance leases<br />
Minimum<br />
lease<br />
payments Subleasing net<br />
Minimum<br />
lease<br />
payments Interest<br />
Present<br />
value<br />
0-1 year 306 - 306 30 (3) 27<br />
1-5 years 850 - 850 28 (8) 20<br />
More than 5 years 1,257 - 1,257 29 (27) 2<br />
minimum lease payments 2,413 0 2,413 87 (38) 49<br />
2010<br />
DKK million<br />
Operating leases Finance leases<br />
Minimum<br />
lease<br />
payments Subleasing net<br />
Minimum<br />
lease<br />
payments Interest<br />
present<br />
value<br />
0-1 year 415 (177) 238 40 (2) 38<br />
1-5 years 692 - 692 156 (20) 136<br />
Over 5 years 813 - 813 46 (33) 13<br />
minimum lease payments 1,920 (177) 1,743 242 (55) 187<br />
The minimum lease payments under these leases amount to<br />
DKK 1,153 million and have not been recognised in the above<br />
calculation of minimum lease payments under lease arrangements<br />
commenced.<br />
In <strong>2011</strong>, operating lease payments totalling DKK 414 million<br />
were recognised (2010: DKK 529 million) in profi t for the year.<br />
Obligations relating to assets held under fi nance leases are<br />
recognised in bank loans. The present value of minimum lease<br />
payments has been calculated using the interest rate in the<br />
respective leases. There is no contingent rent under the leases.<br />
Assets held under fi nance leases are recognised as property,<br />
plant and equipment in the balance sheet at 31 December,<br />
with the following carrying amounts:<br />
DKK million <strong>2011</strong> 2010<br />
Production assets 18 32<br />
Property, plant and equipment under construction 98 91<br />
Carrying amount at 31 December 116 123<br />
<strong>DONG</strong> ENERGY <strong>DONG</strong> ENERGY GROUP <strong>ANNUAL</strong> <strong>REPORT</strong> <strong>2011</strong> – COnsOliDatED finanCial statEmEnts<br />
123 119<br />
notes
notes<br />
36 Contractual obligations and security arrangements<br />
DKK million <strong>2011</strong> 2010<br />
investment obligations relating to jointly controlled entities:<br />
Share of jointly controlled entities’ investment obligations 2,060 2,518<br />
Investment obligations in relation to participation in jointly controlled entities - 1,413<br />
Obligations relating to natural gas and oil exploration and production licences:<br />
Share of licences’ investment obligations 6,788 6,211<br />
Other investment obligations:<br />
Investment obligations relating to property, plant and equipment 19,746 24,621<br />
Contractual obligations<br />
Investment obligations in respect of jointly controlled entities<br />
and other investment obligations relate primarily to wind<br />
farms.<br />
The Group is a party to a number of long-term purchase and<br />
sales contracts entered into in the course of the Group’s ordinary<br />
operations. Apart from the liabilities already recognised<br />
in the balance sheet, the Group does not expect to incur any<br />
signifi cant fi nancial losses as a result of the performance of<br />
these contracts.<br />
37 Contingent assets and liabilities<br />
Contingent assets<br />
Signifi cant unrecognised contingent assets comprise deferred<br />
tax assets at DKK 13.3 billion (2010: DKK 10.8 billion).<br />
Reference is made to note 23.<br />
<strong>DONG</strong> <strong>Energy</strong> has advanced claims against a few trading partners<br />
and insurance companies. Management is of the opinion<br />
that the claims are justifi ed. The claims have not been recognised,<br />
as the existence of these assets is subject to several uncertain<br />
future events that are outside <strong>DONG</strong> <strong>Energy</strong>’s control.<br />
In previous fi nancial years, the Group concluded agreements<br />
on the sale of companies that feature contingent consideration.<br />
This consideration has not been recognised, as its existence<br />
is subject, in part, to several uncertain future events that<br />
are outside <strong>DONG</strong> <strong>Energy</strong>’s control.<br />
Security arrangements<br />
Mortgage loans totalling DKK 1,502 million (2010: DKK 1,502<br />
million) were secured on power stations with a carrying<br />
amount of DKK 2,812 million (2010: DKK 3,238 million).<br />
Furthermore, the Group provided cash collateral in respect of<br />
trading in fi nancial instruments, see note 31.<br />
Contingent liabilities<br />
120 124 COnsOliDatED finanCial statEmEnts – <strong>DONG</strong> ENERGY GROUP <strong>ANNUAL</strong> <strong>ANNUAL</strong> <strong>REPORT</strong> <strong>REPORT</strong> <strong>2011</strong><br />
<strong>2011</strong><br />
liability to pay compensation<br />
According to the legislation, <strong>DONG</strong> <strong>Energy</strong>’s natural gas<br />
companies <strong>DONG</strong> Oil Pipe A/S, <strong>DONG</strong> E&P A/S and <strong>DONG</strong><br />
E&P Grønland A/S are liable to pay compensation for damage<br />
caused by their gas and oil activities, even where there is no<br />
proof of negligence (strict liability). The usual insurance has<br />
been taken out to cover any such claims.<br />
Guarantees<br />
<strong>DONG</strong> <strong>Energy</strong> A/S has furnished the Danish Ministry of<br />
Economic Affairs and the Interior with a guarantee for fulfi lment<br />
of all obligations and liability to the Danish State or third<br />
parties incurred by <strong>DONG</strong> E&P A/S as co-holder of the licences<br />
in which the company participates, irrespective of whether the<br />
obligations and liability rest on <strong>DONG</strong> E&P A/S alone or jointly<br />
and severally with others. However, the guarantee is limited<br />
to a sum corresponding to twice <strong>DONG</strong> E&P’s share of each<br />
obligation or liability.
As a condition for approval of its participation in gas and oil<br />
exploration and production on the Norwegian, UK, Greenland<br />
and Faroese continental shelves, <strong>DONG</strong> <strong>Energy</strong> A/S has provided<br />
a guarantee under which it assumes primary liability as<br />
normally required by the local authorities. The guarantee covers<br />
obligations and liability incurred or assumed by the <strong>DONG</strong><br />
E&P Group in connection with its exploration and production<br />
activities. The guarantee has no maximum limit and the <strong>DONG</strong><br />
E&P Group is jointly and severally liable with the other partners<br />
for obligations and liability.<br />
Through subsidiaries and jointly controlled assets and entities,<br />
<strong>DONG</strong> <strong>Energy</strong> participates in gas and oil exploration and production,<br />
construction and operation of wind farms, geothermal<br />
plants and natural gas facilities. The Group has provided guarantees,<br />
and guarantees under which the Group assumes primary<br />
liability, in respect of the construction and operation of<br />
facilities, and leases, decommissioning obligations, purchase<br />
and sales contracts, etc.<br />
Joint and several liability<br />
<strong>DONG</strong> <strong>Energy</strong> participates in a number of jointly controlled<br />
assets and entities, including renewable energy projects and<br />
gas and oil exploration and production licences. The Group<br />
is jointly and severally liable with the other joint venturers for<br />
obligations and liability under agreements concluded.<br />
<strong>DONG</strong> <strong>Energy</strong> Power A/S is liable as a partner for fi nancial<br />
losses at certain CHP plants.<br />
litigation<br />
<strong>DONG</strong> <strong>Energy</strong> is a party to actions relating to the competition<br />
authorities’ claim that Elsam A/S and Elsam Kraft A/S charged<br />
excessive prices in the Danish wholesale electricity market in<br />
some periods. Following a merger in 2008, Elsam Kraft A/S is<br />
part of <strong>DONG</strong> <strong>Energy</strong> Power A/S.<br />
The Competition Appeals Tribunal has concluded that Elsam<br />
A/S and Elsam Kraft A/S abused their dominant positions in<br />
the wholesale electricity market in Western Denmark to some<br />
extent in the periods 1 July 2003 to 31 December 2004 and 1<br />
January 2005 to 30 June 2006 by charging excessive prices.<br />
<strong>DONG</strong> <strong>Energy</strong> disputes the rulings and has appealed them to<br />
the Copenhagen Maritime and Commercial Court.<br />
A group of power consumers has fi led a claim with the<br />
Copenhagen Maritime and Commercial Court for compensation<br />
of up to DKK 4.4 billion with addition of interest in connection<br />
with the above actions relating to excessive prices in<br />
Western Denmark. <strong>DONG</strong> <strong>Energy</strong> has recognised a provision<br />
of DKK 298 million, which has been determined on the basis of<br />
the Danish Competition Council’s calculation of the consumers’<br />
losses.<br />
In connection with collaboration agreements entered into by<br />
the Group concerning jointly controlled assets and entities,<br />
etc., various minor litigation cases are pending, the outcome<br />
of which is not expected, either individually or collectively, to<br />
have any signifi cant effect on the Group’s fi nancial position.<br />
The Group is also a party to a number of litigation proceedings<br />
and legal disputes that will not have any signifi cant<br />
effect on the Group’s fi nancial position, either individually or<br />
collectively.<br />
<strong>DONG</strong> ENERGY <strong>DONG</strong> ENERGY GROUP <strong>ANNUAL</strong> <strong>REPORT</strong> <strong>2011</strong> – COnsOliDatED finanCial statEmEnts<br />
125 121<br />
notes
notes<br />
38 Related party transactions<br />
Related parties<br />
Related parties that have control over the Group comprise the<br />
Danish State, represented by the Danish Ministry of Finance,<br />
which owns 76% of the parent company.<br />
Other related parties are the Group’s Board of Directors,<br />
Executive Board, senior executives and close members of<br />
their families. Related parties also comprise companies that<br />
are controlled or jointly controlled by the persons referred to<br />
above.<br />
Related parties also include the Group’s jointly controlled entities,<br />
i.e. companies that are jointly controlled by <strong>DONG</strong> <strong>Energy</strong><br />
and other venturers, and associates in which <strong>DONG</strong> <strong>Energy</strong><br />
has signifi cant infl uence. Reference is made to note 42 in the<br />
complete annual report for an overview of the Group’s jointly<br />
controlled entities and associates.<br />
Related party transactions<br />
Remuneration to the Board of Directors, the Executive Boards<br />
and other senior executives is disclosed in note 6.<br />
The Group had the following transactions with jointly controlled<br />
entitles and associates during the fi nancial year:<br />
Jointly controlled entities Associates<br />
DKK million <strong>2011</strong> 2010 <strong>2011</strong> 2010<br />
Dividends received 178 39 51 59<br />
Capital transactions, net 625 643 - -<br />
Trade receivables 2,179 81 5 1<br />
Trade payables (55) (40) (435) (126)<br />
Purchase of property, plant and<br />
equipment (1,792) - - -<br />
Interest, net - - 64 32<br />
Receivables 870 271 557 544<br />
Payables - (271) (10) (43)<br />
There were no other transactions with related parties during the<br />
year under review.<br />
126 122 COnsOliDatED finanCial statEmEnts – <strong>DONG</strong> ENERGY <strong>ANNUAL</strong> GROUP <strong>ANNUAL</strong> <strong>REPORT</strong> <strong>REPORT</strong> <strong>2011</strong><br />
<strong>2011</strong><br />
Transactions with related parties are made on arm’s length<br />
terms.
39 Events after the reporting period<br />
Sterling-denominated bond issue<br />
In January 2012, <strong>DONG</strong> <strong>Energy</strong> issued a GBP 750 million bond<br />
with a maturity of 20 years. The bond carries a coupon of<br />
4.875%. The bond was issued under the company’s existing<br />
bond programme (EMTN programme) and the transaction will<br />
strengthen <strong>DONG</strong> <strong>Energy</strong>’s strong liquidity position.<br />
Disposal of Oil Terminals<br />
In June <strong>2011</strong>, <strong>DONG</strong> <strong>Energy</strong> and the Canadian energy infrastructure<br />
business Inter Pipeline Fund agreed that Inter<br />
Pipeline Fund would take over <strong>DONG</strong> <strong>Energy</strong> Oil Terminals.<br />
The selling price for <strong>DONG</strong> <strong>Energy</strong> Oil Terminals was DKK 2.9<br />
billion. The transaction was completed in January 2012, yielding<br />
a gain before tax of approx. DKK 2.6 billion.<br />
Development of the Danish Hejre fi eld<br />
<strong>DONG</strong> <strong>Energy</strong> and Bayerngas have decided to develop the<br />
Hejre fi eld in the Danish sector of the North Sea. <strong>DONG</strong><br />
<strong>Energy</strong> is the operator and has a 60% stake in the fi eld.<br />
Bayerngas owns 40%. <strong>DONG</strong> <strong>Energy</strong>’s investment totals DKK<br />
9.2 billion. The development of the fi eld represents DKK 7.3<br />
billion, equivalent to 60% of the total development costs. The<br />
remaining DKK 1.9 billion represents costs for the expansion of<br />
<strong>DONG</strong> <strong>Energy</strong>’s terminal in Fredericia, which will be processing<br />
the oil from the Hejre fi eld. <strong>DONG</strong> <strong>Energy</strong> estimates the<br />
total reserves of the Hejre fi eld at approx. 170 million barrels of<br />
oil equivalent and expects fi rst oil from the end of 2015.<br />
Disposal of stake in the German offshore<br />
wind farm Borkum Riffgrund 1<br />
In February 2012, the LEGO Group’s parent company, KIRKBI<br />
A/S, and the Oticon Foundation, via its wholly-owned investment<br />
company, William Demant Invest A/S, signed an<br />
agreement with <strong>DONG</strong> <strong>Energy</strong> to acquire 50% of the German<br />
Borkum Riffgrund 1 offshore wind farm for a sum of approx.<br />
DKK 4.7 billion. The transaction is subject to approval by the<br />
competition authorities and is expected to be completed in<br />
the second quarter of 2012. Borkum Riffgrund 1 will consist<br />
of 77 3.6 MW wind turbines from Siemens Wind Power. The<br />
wind farm will be able to supply CO2-free power equivalent<br />
to the annual electricity consumption of more than 285,000<br />
households. Construction of Borkum Riffgrund 1 is expected<br />
to commence in 2013, and fi rst power is expected to be generated<br />
in 2014.<br />
<strong>DONG</strong> ENERGY <strong>DONG</strong> ENERGY GROUP <strong>ANNUAL</strong> <strong>REPORT</strong> <strong>2011</strong> – COnsOliDatED finanCial statEmEnts<br />
123 127<br />
notes
notes<br />
40 Description of accounting policies<br />
Basis of preparation<br />
Changed presentation<br />
<strong>DONG</strong> <strong>Energy</strong> has changed the presentation of its statement<br />
of comprehensive income so that it is now classified by nature<br />
instead of function, which means that EBITDA features directly<br />
in the statement of comprehensive income. This ensures better<br />
cohesion with Management’s review, in which EBITDA is used<br />
as one of the Group’s most important performance measures.<br />
Changed presentation of income statement, 2010<br />
DKK million<br />
Classified by function<br />
Revenue 54,598<br />
Production costs (44,469)<br />
Gross profit 10,129<br />
Sales and marketing (458)<br />
Management and administration (1,835)<br />
Other operating income 295<br />
Other operating expenses (57)<br />
Operating profit (EBit) 8,074<br />
DKK million<br />
Classified by nature<br />
Revenue 54,598<br />
Fuel and energy (31,436)<br />
Other external expenses (6,365)<br />
Staff costs (2,946)<br />
Other operating income 295<br />
Other operating expenses<br />
Operating profit before depreciation,<br />
amortisation and impairment losses<br />
(57)<br />
(EBitDa) 14,089<br />
Depreciation, amortisation and impairment<br />
losses on property, plant and equipment<br />
and intangible assets (6,015)<br />
Operating profit (EBit) 8,074<br />
Commodity hedge transactions<br />
From and including 1 January <strong>2011</strong>, commodity hedge transactions<br />
and related foreign exchange exposures are no longer<br />
accounted for as cash flow hedge accounting.<br />
128 COnsOliDatED finanCial statEmEnts – <strong>DONG</strong> ENERGY <strong>ANNUAL</strong> <strong>REPORT</strong> <strong>2011</strong><br />
As part of its financial risk management, the Group enters into<br />
transactions to hedge certain physical and financial risks in<br />
oil, gas, coal, electricity, CO2 and related currency exposures.<br />
The Group accounts for the hedging transactions entered into<br />
on the basis of its internal processes for optimisation of its<br />
purchase, sale and consumption of oil, gas, coal, electricity and<br />
CO2 , as effective economic hedges. Some hedging transactions<br />
will meet IAS 39’s criteria for cash flow hedge accounting,<br />
while others will not. For this reason, the Group has elected not<br />
to apply the provisions on hedge accounting to these transactions<br />
in future. When determining profit for the year, fair value<br />
adjustments to these derivative financial instruments are<br />
therefore recognised in the period in which they arise, regardless<br />
of the date of realisation of the hedged transaction.<br />
Fair value adjustments of commodity hedge transactions that<br />
met the criteria for cash flow hedge accounting at 31 December<br />
2010 have been recognised in a separate reserve within equity.<br />
On realisation of the hedged transactions relating to these<br />
hedging transactions the amounts from this reserve are reversed<br />
and recognised in profit for the year.<br />
Business performance<br />
To provide readers of financial statements with relevant and<br />
reliable information on how the business is developing, the<br />
Group has elected, in connection with the statement of profit<br />
for the period, to present an alternative performance measure,<br />
business performance. Business performance has been determined<br />
in accordance with the internal management reporting.<br />
In connection with the determination of the business performance<br />
results, fair value adjustments on hedging transactions<br />
relating to commodity risks are recognised in the period in<br />
which the hedged transaction affects profit. This means that<br />
transactions are recognised at the hedged value. No adjustments<br />
are made in respect of gains and losses on other financial<br />
instruments.<br />
The adjustments column consists of fair value adjustments of<br />
commodity hedge transactions and realised gains and losses<br />
on these transactions and therefore solely reflects timing differences.<br />
The additional information is presented in accordance<br />
with IAS 1.<br />
Consolidated financial statements<br />
The consolidated financial statements include the financial<br />
statements of the parent company <strong>DONG</strong> <strong>Energy</strong> A/S and subsidiaries<br />
in which <strong>DONG</strong> <strong>Energy</strong> A/S has the power to govern<br />
the financial and operating policies. Control exists when <strong>DONG</strong><br />
<strong>Energy</strong> A/S holds, directly or indirectly, more than 50% of the<br />
voting rights or otherwise has the power to control the subsidiary<br />
in question.
Regulated companies that operate according to a principle of<br />
self-financing and where <strong>DONG</strong> <strong>Energy</strong> does not have direct<br />
or indirect access to receive a return or other benefits are not<br />
included in the consolidation, but are instead measured at fair<br />
value as investments within other equity investments.<br />
Enterprises over which the Group exercises significant influence,<br />
but not control, are accounted for as associates.<br />
Significant influence is typically achieved by holding or having<br />
the ability to exercise, directly or indirectly, more than 20% but<br />
less than 50% of the voting rights. However, this is based on<br />
a specific assessment of the possibility of exercising influence.<br />
Any such enterprises that satisfy the criteria for joint control<br />
are instead accounted for as investments in jointly controlled<br />
entities, see the description under Investments in jointly controlled<br />
assets and entities.<br />
Potential voting rights exercisable at the balance sheet date<br />
are taken into account in assessing whether <strong>DONG</strong> <strong>Energy</strong> has<br />
control, joint control or significant influence.<br />
The consolidated financial statements have been prepared as<br />
a consolidation of the parent company’s and the individual<br />
subsidiaries’ financial statements, in accordance with the<br />
Group’s accounting policies. Intragroup income and expenses,<br />
shareholdings, balances and dividends as well as realised and<br />
unrealised gains and losses arising from intragroup transactions<br />
are eliminated on consolidation. Unrealised gains resulting<br />
from transactions with associates and entities under joint<br />
control are eliminated to the extent of the Group’s investment<br />
in the enterprise. Unrealised losses are eliminated in the same<br />
way as unrealised gains, but only to the extent that there is no<br />
evidence of impairment.<br />
The items in the subsidiaries’ financial statements are recognised<br />
in full in the consolidated financial statements. For subsidiaries<br />
that are not wholly owned, the share of profit for the<br />
year and equity that is attributable to non-controlling interests<br />
is recognised as part of the Group’s profit and equity respectively,<br />
but disclosed separately.<br />
Significant accounting policies<br />
investments in jointly controlled assets and entities<br />
Investments in jointly controlled assets and entities comprise<br />
natural gas and oil exploration and production licences, wind<br />
farms and a power station, etc.<br />
Recognition of an investment as a jointly controlled asset or<br />
entity is conditional upon the existence of a contractual arrangement<br />
between the parties stipulating joint control. The<br />
contractual arrangement must also stipulate whether the<br />
parties are jointly and severally liable or liable for their proportionate<br />
interests only.<br />
Investments in jointly controlled assets and entities are recognised<br />
in the consolidated balance sheet using proportionate<br />
consolidation as a share of assets and liabilities in the jointly<br />
controlled assets and entities. Shares of income and expenses<br />
from jointly controlled assets and entities are recognised on a<br />
proportionate basis in profit for the year, classified by nature.<br />
Own liabilities and expenses incurred in respect of jointly controlled<br />
assets and entities are also recognised.<br />
In connection with proportionate consolidation, intragroup<br />
income and expenses, balances and realised and unrealised<br />
gains and losses arising from intragroup transactions between<br />
fully consolidated enterprises and proportionately consolidated<br />
assets and entities are eliminated to the extent of the Group’s<br />
investment.<br />
Deferred tax on temporary differences at the acquisition date<br />
between the carrying amount and the tax base of jointly controlled<br />
assets is not provided for, see the description under<br />
Income tax and deferred tax.<br />
Derivative financial instruments<br />
Derivative financial instruments and loans are used to hedge<br />
currency and interest rate risks and risks related to the price of<br />
oil, gas, electricity, coal and CO2 emissions allowances.<br />
Derivative financial instruments are recognised from the trade<br />
date as receivables (positive fair values) and other payables<br />
(negative fair values) respectively and are measured in the balance<br />
sheet at fair value. Transaction costs are added to the fair<br />
value on initial recognition, unless the financial asset or the<br />
financial liability is measured at fair value with recognition of<br />
fair value adjustments in profit for the year.<br />
Positive and negative fair values are only offset if the enterprise<br />
is entitled to and intends to settle several financial instruments<br />
net (in cash).<br />
The fair value of derivative financial instruments is determined<br />
on the basis of current market data and assumptions, and recognised<br />
valuation methods.<br />
Value adjustments of derivative financial instruments that act<br />
as economic hedges of the Group’s primary activities but do<br />
not satisfy the criteria for hedge accounting are recognised<br />
as revenue and fuel and energy respectively. Likewise, value<br />
adjustments of financial contracts offered to customers with<br />
a view to price hedging are recognised as revenue. Value<br />
<strong>DONG</strong> ENERGY <strong>ANNUAL</strong> <strong>REPORT</strong> <strong>2011</strong> – COnsOliDatED finanCial statEmEnts<br />
129<br />
notes
notes<br />
40 Description of accounting policies<br />
adjustments of financial contracts that are not used as economic<br />
hedges of the Group’s primary activities or that are<br />
part of the Group’s trading portfolio are recognised as finance<br />
income and costs.<br />
Under IFRS, contracts that involve physical delivery may, under<br />
certain circumstances, be accounted for as derivative financial<br />
instruments. The classification is determined based on an<br />
evaluation of the purpose of the contract compared with the<br />
Group’s other activities. Contracts entered into in the course<br />
of the Group’s trading activities or as part of certain hedging<br />
activities are classified and accounted for as derivative financial<br />
instruments, even though they are settled on physical delivery.<br />
Derivative financial instruments<br />
used for hedge accounting<br />
The Group applies the provisions on hedge accounting to derivative<br />
financial instruments and loans that hedge currency<br />
and interest rate risks.<br />
Up to and including 31 December 2010, commodity hedge<br />
transactions and related exposures to foreign currencies were<br />
also accounted for as cash flow hedge accounting. Market value<br />
adjustments of these, which were previously recognised in<br />
comprehensive income and a special reserve in equity, are recognised<br />
in profit for the year as the underlying transactions are<br />
realised or if the hedges are judged to no longer be effective.<br />
fair value hedging<br />
Changes in the fair value of derivative financial instruments<br />
that are designated as and qualify for recognition as hedges of<br />
the fair value of a recognised asset or liability are recognised<br />
in profit for the year together with changes in the value of<br />
the hedged asset or liability to the extent of the hedged risk.<br />
Hedging of future cash flows in accordance with an agreement<br />
(firm commitment) is accounted for as fair value hedging, except<br />
in the case of foreign currency hedging.<br />
Cash flow hedging<br />
Changes in the portion of the fair value of derivative financial<br />
instruments and foreign exchange adjustments of loans that<br />
is designated as and qualifies for recognition as a hedge of<br />
future cash flows and that provides an effective hedge against<br />
changes in the value of the hedged item are recognised directly<br />
in equity within a separate hedging reserve until the hedged<br />
cash flow is realised. On realisation of the hedged cash flow,<br />
the resulting gain or loss is transferred from equity and recognised<br />
in the same item as the hedged item; however, on hedging<br />
of the proceeds from future loans, the resulting gain or loss<br />
is transferred from equity over the term of the loan.<br />
130 COnsOliDatED finanCial statEmEnts – <strong>DONG</strong> ENERGY <strong>ANNUAL</strong> <strong>REPORT</strong> <strong>2011</strong><br />
If the hedged cash flows are no longer expected to be realised,<br />
the accumulated value adjustment is transferred immediately<br />
to profit for the year.<br />
Hedging of net investments<br />
Changes in the fair value of derivative financial instruments<br />
and borrowings that are used to hedge net investments in<br />
foreign subsidiaries or associates and that provide effective<br />
hedges against changes in foreign exchange rates in these<br />
enterprises are recognised in the consolidated financial statements<br />
directly in equity within a separate translation reserve.<br />
revenue<br />
Revenue comprises sales and transportation of oil and gas,<br />
distribution and storage of gas, sales and distribution of electricity<br />
and heat, and grants for the sale of eco-friendly electricity<br />
(price supplement), etc. Revenue is recognised in profit for<br />
the year when delivery and transfer of risk to buyer have taken<br />
place and to the extent that the income can be measured reliably<br />
and is expected to be received.<br />
Revenue is measured at the fair value of the agreed consideration<br />
excluding VAT and other indirect taxes collected on behalf<br />
of third parties. All forms of discounts granted are recognised<br />
as revenue.<br />
Construction contracts for the construction of assets involving<br />
a high degree of customisation, and the rendering of services<br />
(consultancy services, etc.), are recognised as revenue as the<br />
work to which they relate is performed or the service rendered<br />
to the effect that revenue corresponds to the selling price of<br />
the work performed during the year (percentage of completion<br />
method). When the outcome of a construction contract cannot<br />
be estimated reliably, revenue is recognised only to the extent<br />
of costs incurred that it is probable will be recoverable.<br />
Overlift/underlift of oil and gas is recognised as revenue at realisable<br />
value. Overlift/underlift relates to situations in which the<br />
Group participates in producing fields (licences) with several<br />
participants and where the Group has lifted and sold more or<br />
less oil and gas from the producing fields than its entitlement<br />
at the time of lifting.<br />
Physical and financial contracts relating to trading in oil, gas,<br />
electricity, CO2 emissions allowances, etc., that are concluded<br />
in the course of the Group’s trading activities with a view to<br />
generating gains from short-term price fluctuations are fair<br />
value adjusted under revenue.<br />
Value adjustments of financial instruments that have been entered<br />
into to hedge the Group’s primary operating activities but
do not satisfy the criteria for hedge accounting are recognised<br />
as revenue. Likewise, value adjustments of financial contracts<br />
offered to customers with a view to price hedging are recognised<br />
as revenue.<br />
fuel and energy<br />
Fuel and energy comprise the Group’s purchases of fuel in the<br />
form of gas, coal, biomass and oil, and energy purchases, as<br />
well as transportation costs in connection with the above and<br />
costs related to CO2 emissions. The costs are recognised in<br />
profit for the year as incurred.<br />
property, plant and equipment<br />
Property, plant and equipment comprise land and buildings,<br />
production assets, exploration assets, other assets, tools and<br />
equipment, etc. Property, plant and equipment are measured at<br />
cost less accumulated depreciation and impairment losses.<br />
Cost comprises purchase price and any costs directly attributable<br />
to the acquisition until the date the asset is available for<br />
use. The cost of self-constructed assets comprises direct and<br />
indirect costs of materials, components, subsuppliers and<br />
labour. Borrowing costs relating to both specific and general<br />
borrowing directly attributable to assets under construction<br />
with a lengthy construction period are recognised in cost during<br />
the construction period. Cost is increased by the present<br />
value of the estimated obligations for dismantling and removing<br />
the assets and restoring the site to the extent that they<br />
are recognised as a provision. In the case of assets held under<br />
finance leases, cost is determined at inception of the lease<br />
as the lower of the fair value of the assets and the present<br />
value of future minimum lease payments. The present value is<br />
determined using the interest rate implicit in the lease as the<br />
discount rate or an approximated value.<br />
Subsequent costs, for example in connection with replacement<br />
of parts of an item of property, plant and equipment, are recognised<br />
in the carrying amount of the asset in question when it<br />
is probable that future economic benefits will flow to the Group<br />
from the expenses incurred. Replaced parts are derecognised<br />
from the balance sheet, and their carrying amount is taken to<br />
profit for the year. All other repair and maintenance expenses<br />
are recognised in profit for the year as incurred.<br />
Exploration assets comprise acquired licences and reserves<br />
as well as exploration expenses that relate to successful wells.<br />
Costs are recognised using the successful efforts method.<br />
Under the successful efforts method, exploration expenses for<br />
drilling specific exploration wells are recognised in the balance<br />
sheet if the well is successful. Recognition in the balance sheet<br />
is maintained pending determination of commercial viability.<br />
Recognised exploration expenses for commercial discoveries<br />
are transferred to property, plant and equipment under construction<br />
on commencement of the construction of a field.<br />
All exploration expenses determined as unsuccessful are recognised<br />
in profit for the year as other external expenses. General<br />
exploration expenses are also recognised as other external<br />
expenses as incurred. Borrowing costs relating to exploration<br />
assets are recognised in profit for the year as incurred.<br />
Site development and construction costs relating to property,<br />
plant and equipment that it has been decided to invest in are<br />
recognised in the balance sheet within property, plant and<br />
equipment under construction until the date of entry into service.<br />
Following entry into service, these assets are transferred<br />
to the relevant items under property, plant and equipment.<br />
In the case of oil and gas production assets, cost is depreciated<br />
using the unit-of-production method based on the ratio of current<br />
production to estimated reserves by individual field.<br />
In the case of wind turbines, cost is depreciated taking into<br />
account the expected earnings profile, so that the depreciation<br />
pattern reflects the expected earnings patterns.<br />
In the case of other property, plant and equipment, cost is basically<br />
depreciated on a straight-line basis over the estimated future<br />
useful lives. Exploration assets and assets under construction<br />
are not depreciated, as depreciation of such assets does<br />
not commence until the assets are available for use, on which<br />
date they are transferred to the relevant item within property,<br />
plant and equipment, usually production assets.<br />
<strong>DONG</strong> ENERGY <strong>ANNUAL</strong> <strong>REPORT</strong> <strong>2011</strong> – COnsOliDatED finanCial statEmEnts<br />
131<br />
notes
notes<br />
40 Description of accounting policies<br />
Depreciation periods for property, plant and equipment<br />
Buildings used for own purposes1 20 - 50 years<br />
Production assets, natural gas and oil2 20 - 40 years<br />
Production assets (thermal), electricity 20 - 35 years<br />
Production assets, district heat 25 - 35 years<br />
Wind turbines3 20 - 24 years<br />
Geothermal plants 20 years<br />
Distribution networks, natural gas3 20 - 40 years<br />
Distribution networks, electricity 10 - 40 years<br />
Distribution networks, heat 10 - 50 years<br />
Natural gas storage facilities3 Gas transportation system (marine<br />
20 - 40 years<br />
pipelines) 3 20 - 40 years<br />
Oil transportation system (marine<br />
pipeline) 15 years<br />
Exploration assets 4 -<br />
IT hardware 3 - 5 years<br />
Fixtures and fittings, tools and equipment 3 - 10 years<br />
Assets under construction4 -<br />
1 Land is not depreciated.<br />
2 Depreciation is charged applying the unit-of-production method.<br />
3 The depreciation profile takes account of the fact that the earnings<br />
profile changes substantially over the life of the asset as a result of the<br />
statutory revenue caps.<br />
Where individual components of an asset have different useful<br />
lives, they are accounted for as separate items, which are depreciated<br />
separately.<br />
The basis of depreciation is determined on the basis of the asset’s<br />
residual value less any impairment losses. The residual<br />
value is determined at the acquisition date and reassessed<br />
annually. Depreciation ceases if the residual value exceeds the<br />
carrying amount of the individual components.<br />
If the depreciation period or the residual value changes, the effect<br />
on depreciation is recognised prospectively as a change in<br />
accounting estimates.<br />
Prepayments for property, plant and equipment are classified<br />
together with property, plant and equipment under<br />
construction.<br />
impairment of assets<br />
Goodwill and intangible assets with an indefinite useful life are<br />
tested for impairment annually, initially before the end of the<br />
year of acquisition. In-process development projects are also<br />
tested annually for impairment.<br />
132 COnsOliDatED finanCial statEmEnts – <strong>DONG</strong> ENERGY <strong>ANNUAL</strong> <strong>REPORT</strong> <strong>2011</strong><br />
The carrying amount of goodwill is tested for impairment, along<br />
with the carrying amounts of the other non-current assets of the<br />
cash-generating unit to which the goodwill has been allocated,<br />
and written down to the recoverable amount via profit for the<br />
year if the carrying amount exceeds the recoverable amount.<br />
Exploration assets are tested for impairment if there is any<br />
indication of impairment. In carrying out the test, emphasis<br />
is placed on the special indicators that are relevant to the<br />
exploration industry, including the duration of the period for<br />
which <strong>DONG</strong> <strong>Energy</strong> holds the rights for exploration wells, the<br />
timing and costs in connection with the exploration wells in the<br />
individual fields, the results of existing exploration wells and<br />
the expectations concerning future exploration wells, including<br />
the level of future exploration wells, and the probability that the<br />
exploration wells will result in commercial finds. The recoverable<br />
amount of exploration assets is reviewed if any indication<br />
of impairment exists. The recoverable amount is the higher of<br />
an asset’s fair value less expected disposal costs and its value<br />
in use. Value in use is determined as the present value of the<br />
expected future cash flows from the asset or cash-generating<br />
unit to which the asset belongs.<br />
Deferred tax assets are reviewed annually and recognised to<br />
the extent that it is probable that they will be utilised.<br />
The carrying amounts of other non-current assets are tested<br />
annually to determine if any indication of impairment exists. If<br />
any such indication exists, the asset’s recoverable amount is<br />
determined. The recoverable amount is the higher of an asset’s<br />
fair value less expected disposal costs and its value in use.<br />
An impairment loss is recognised whenever the carrying<br />
amount of an asset or its cash-generating unit exceeds its<br />
recoverable amount. Impairment losses are recognised in profit<br />
for the year as depreciation, amortisation and impairment<br />
losses on intangible assets and property, plant and equipment.<br />
Impairment losses relating to goodwill are not reversed.<br />
Impairment losses relating to other assets are reversed to the<br />
extent that the assumptions or estimates that led to the impairment<br />
have changed. Impairment losses are only reversed<br />
to the extent that the asset’s new carrying amount does not<br />
exceed the value of the asset after depreciation had no impairment<br />
losses been charged.<br />
Equity<br />
Hedging reserve<br />
The hedging reserve comprises the accumulated net change<br />
in the fair value of hedging transactions that qualify for designation<br />
as hedges of future cash flows, and where the hedged<br />
transaction has yet to be realised, less the related tax.
translation reserve<br />
The translation reserve comprises exchange differences arising<br />
on translation of the financial statements of foreign entities<br />
with a functional currency that is different from the Group’s<br />
presentation currency, foreign exchange adjustments relating<br />
to assets and liabilities that form a part of the Group’s net<br />
investment in such entities, and foreign exchange adjustments<br />
relating to hedging transactions that hedge the Group’s net<br />
investment in such entities, less the related tax. The foreign<br />
exchange adjustments are recognised in profit for the year on<br />
realisation or partial realisation of the net investment.<br />
share premium<br />
Share premium represents the excess of the amount subscribed<br />
for share capital over the nominal value of these shares<br />
in connection with capital increases. The share premium is<br />
available for distribution.<br />
Dividends<br />
Proposed dividends are recognised as a liability at the date<br />
of their adoption at the Annual General Meeting (declaration<br />
date). Up to the declaration date, proposed dividends are disclosed<br />
as a separate item in equity. Extraordinary dividends are<br />
recognised as a liability at the declaration date.<br />
Hybrid capital<br />
Hybrid capital comprises issued bonds that qualify for treatment<br />
in accordance with the rules on compound financial instruments<br />
due to the special characteristics of the loan. The principal<br />
amount, which constitutes a liability, is recognised at present<br />
value (nil), and equity has been increased by the difference<br />
between the net proceeds received and the present value of the<br />
discounted liability. Accordingly, any coupon payments are accounted<br />
for as dividends, which are recognised directly in equity<br />
at the time the payment obligation arises. This is because the<br />
coupon payments are discretionary and relate to the part of the<br />
hybrid capital that is recognised in equity. Coupon payments<br />
consequently do not have any effect on profit for the year.<br />
The part of the hybrid capital that is accounted for as a liability<br />
is measured at amortised cost. However, as the carrying amount<br />
of this component amounted to nil on initial recognition, and, as<br />
a result of the 1,000-year term of the hybrid capital, amortisation<br />
charges will only impact on profit for the year towards the<br />
end of the 1,000-year term of the hybrid capital. Coupon payments<br />
are recognised in the statement of cash flows in the same<br />
way as dividend payments within financing activities.<br />
provisions<br />
Provisions are recognised when, as a result of an event occurring<br />
before or at the balance sheet date, the Group has a legal<br />
or constructive obligation, the settlement of which is expected<br />
to result in an outflow from the company of resources embodying<br />
economic benefits.<br />
In measuring provisions, the costs required to settle the liability<br />
are discounted to net present value, if this has a significant<br />
effect on the measurement of the liability. A pre-tax discount<br />
rate is used that reflects the general interest rate level in the<br />
market. The change in present values for the financial year is<br />
recognised as finance costs.<br />
Provisions for decommissioning of production facilities and restoration<br />
are measured at the present value of the future liability<br />
in respect of decommissioning and restoration as estimated<br />
at the balance sheet date. The amount provided is determined<br />
on the basis of existing requirements and estimated expenses,<br />
which are discounted to present value. If specific risks are<br />
deemed to be attached to a provision, the estimated costs are<br />
recognised. A discount rate is used that reflects the general<br />
interest rate level in the market. These liabilities are recognised<br />
as they arise and are adjusted on a regular basis to reflect<br />
changes in requirements, price level, etc. The value of the provision<br />
is recognised within property, plant and equipment and<br />
depreciated together with the relevant assets. The increase in<br />
time of the present value of the provision is recognised in profit<br />
for the year as finance costs.<br />
A provision for onerous contracts is recognised when the<br />
expected benefits to be derived by the Group from a contract<br />
are lower than the unavoidable cost of meeting its obligations<br />
under the contract.<br />
If it is considered unlikely that an outflow of resources embodying<br />
economic benefits will be required to settle an obligation,<br />
or if the obligation cannot be measured reliably, the obligation<br />
is accounted for as a contingent liability that is not recognised<br />
in the balance sheet. Information about material contingent liabilities<br />
is disclosed in the notes.<br />
financial liabilities<br />
Financial liabilities comprise mortgage loans, bank loans, trade<br />
and other payables to public authorities, etc.<br />
Bond loans, mortgage loans and bank loans are recognised at<br />
inception at the proceeds received net of transaction costs incurred.<br />
In subsequent periods, the financial liabilities are measured<br />
at amortised cost using the effective interest rate method.<br />
Accordingly, the difference between the proceeds received<br />
and the nominal amount is recognised in profit for the year as<br />
finance costs over the term of the loan.<br />
For hybrid capital, reference is made to the specific details<br />
given under equity.<br />
<strong>DONG</strong> ENERGY <strong>ANNUAL</strong> <strong>REPORT</strong> <strong>2011</strong> – COnsOliDatED finanCial statEmEnts<br />
133<br />
notes
notes<br />
40 Description of accounting policies<br />
Other bank loans include the capitalised residual lease commitment<br />
under finance leases, measured at amortised cost.<br />
Trade payables, payable income tax and other payables are<br />
measured at net realisable value.<br />
Other payables include negative fair values of derivative financial<br />
instruments.<br />
Financial liabilities the value of which has been effectively<br />
hedged are adjusted to fair value to the extent of the hedged<br />
risk. The value adjustment is recognised in profit for the year as<br />
finance income or costs.<br />
Other accounting policies<br />
Business combinations<br />
Enterprises acquired or formed during the year are recognised<br />
in the consolidated financial statements from the date of acquisition<br />
or formation. The acquisition date is the date on which<br />
<strong>DONG</strong> <strong>Energy</strong> obtains control of the acquiree. On acquisition<br />
of enterprises whereby the parent company obtains control of<br />
the acquiree, the purchase method is applied. The acquiree’s<br />
identifiable assets, liabilities and contingent liabilities are<br />
measured at fair value at the acquisition date. Identifiable<br />
intangible assets are recognised if they are separable or arise<br />
from a contractual right, and the fair value can be measured<br />
reliably. Deferred tax on revaluations is recognised.<br />
The consideration transferred in exchange for an acquiree consists<br />
of the fair value of the agreed consideration in the form of<br />
assets acquired, liabilities assumed and issued equity instruments.<br />
If parts of the consideration are contingent on future<br />
events, these parts of the consideration are recognised in cost<br />
at the acquisition-date fair value. Costs incurred in connection<br />
with a business combination are recognised in profit for the<br />
year as incurred.<br />
The excess of the cost of the consideration transferred in exchange<br />
for the acquiree, the amount of any non-controlling interests<br />
in the acquiree and the fair value of the identifiable assets<br />
acquired and liabilities and contingent liabilities assumed<br />
(goodwill) is recognised as goodwill within intangible assets.<br />
Goodwill is not amortised, but is tested for impairment, at least<br />
annually. The first impairment test is carried out before the end<br />
of the year of acquisition. On acquisition, goodwill is allocated<br />
to the cash-generating units, which subsequently form the basis<br />
for the impairment test.<br />
Goodwill and fair value adjustments in connection with the<br />
acquisition of a foreign entity with a functional currency that is<br />
different from the Group’s presentation currency are accounted<br />
for as assets and liabilities belonging to the foreign entity and<br />
134 COnsOliDatED finanCial statEmEnts – <strong>DONG</strong> ENERGY <strong>ANNUAL</strong> <strong>REPORT</strong> <strong>2011</strong><br />
translated on initial recognition into the foreign entity’s functional<br />
currency at the exchange rate at the transaction date.<br />
Any excess of the fair value over the cost of acquisition (negative<br />
goodwill) is recognised in profit for the year at the date of<br />
acquisition.<br />
If there is any uncertainty, at the acquisition date, concerning<br />
the measurement of identifiable assets acquired and liabilities<br />
and contingent liabilities assumed, initial recognition is based<br />
on provisional fair values. If the fair value of identifiable assets,<br />
liabilities and contingent liabilities subsequently proves to differ<br />
from the fair value assumed at the acquisition date, those<br />
provisional values, including goodwill, are adjusted retrospectively<br />
within 12 months of the acquisition date and comparative<br />
figures are restated. Subsequently, goodwill is not adjusted.<br />
Changes in estimates of contingent consideration are generally<br />
recognised directly in profit for the year.<br />
Non-controlling interests are measured on initial recognition<br />
either at fair value or at their proportionate interest in<br />
the fair value of the acquiree’s identifiable assets, liabilities<br />
and contingent liabilities. In the former case, goodwill relating<br />
to the non-controlling interests’ interest in the acquiree is<br />
recognised, while, in the latter case, no goodwill is recognised<br />
relating to non-controlling interests. The method of measuring<br />
non-controlling interests is determined on an acquisition-byacquisition<br />
basis and disclosed in the notes in connection with<br />
the description of the acquiree.<br />
The effect of acquisitions and disposals of non-controlling interests<br />
after control is obtained is recognised directly in equity.<br />
Net assets acquired are not revalued on acquisition.<br />
Enterprises disposed of during the year are recognised in profit<br />
for the year up to the date of disposal.<br />
Gains or losses on disposal of enterprises and investments in<br />
associates are determined as the difference between the selling<br />
price and the carrying amount of net assets, including goodwill<br />
at the date of disposal and costs necessary to make the sale.<br />
Gains or losses are recognised in profit for the year as gain<br />
(loss) on disposal of enterprises.<br />
Comparative figures are not restated to reflect acquisitions<br />
or disposals; however, discontinued operations are presented<br />
separately.<br />
foreign currency translation<br />
For each of the reporting enterprises in the Group, a functional<br />
currency is determined. The functional currency is the currency<br />
of the primary economic environment in which the individual
eporting enterprise operates. Transactions in currencies other<br />
than the functional currency are accounted for as transactions<br />
in foreign currencies.<br />
On initial recognition, transactions in foreign currencies are<br />
translated into the functional currency at the exchange rates<br />
at the transaction date. Exchange differences arising between<br />
the exchange rates at the transaction date and at the date of<br />
payment are recognised in profit for the year as finance income<br />
or costs.<br />
Receivables, payables and other monetary items in foreign<br />
currencies are translated into the functional currency at the exchange<br />
rates at the balance sheet date. The difference between<br />
the exchange rates at the balance sheet date and at the date<br />
at which the receivable or payable arose or was recognised in<br />
the latest annual report is recognised in profit for the year as<br />
finance income or costs.<br />
On recognition in the consolidated financial statements of<br />
subsidiaries and proportionately consolidated enterprises<br />
with a different functional currency than DKK, the items in<br />
the statement of comprehensive income are translated at the<br />
exchange rates at the transaction date, and the balance sheet<br />
items are translated at the exchange rates at the balance sheet<br />
date. An average exchange rate for each month is used as the<br />
exchange rate at the transaction date to the extent that this<br />
does not significantly distort the presentation of the underlying<br />
transactions. Exchange differences arising on translation of the<br />
opening equity of these enterprises at the exchange rates at<br />
the balance sheet date and on translation of the statements of<br />
comprehensive income from the rates at the transaction date<br />
to the exchange rates at the balance sheet date are recognised<br />
directly in equity within a separate translation reserve. Such<br />
foreign exchange adjustments are allocated between the parent<br />
company’s and the non-controlling interests’ equity.<br />
Foreign exchange adjustments of balances that are accounted<br />
for as part of the total net investment in enterprises with a<br />
different functional currency than DKK are recognised in the<br />
consolidated financial statements directly in equity within a<br />
separate translation reserve. Likewise, foreign exchange gains<br />
and losses on the portion of loans and derivative financial instruments<br />
that has been entered into to hedge the net investment<br />
in these enterprises and that provides an effective hedge<br />
against corresponding foreign exchange gains/losses on the<br />
net investment in the enterprise are taken directly to a separate<br />
translation reserve in equity.<br />
On recognition in the consolidated financial statements of<br />
associates with a different functional currency than DKK,<br />
the share of profit for the year is translated using an average<br />
exchange rate, and the share of equity including goodwill is<br />
translated at the exchange rates at the balance sheet date.<br />
Exchange differences arising on translation of the share of<br />
foreign associates’ opening equity at the exchange rates at<br />
the balance sheet date and on translation of the share of profit<br />
for the year from average rates to the exchange rates at the<br />
balance sheet date are recognised directly in equity within a<br />
separate translation reserve.<br />
When a foreign entity is disposed of, in full or in part, and control<br />
is lost, or when balances that are considered part of the net<br />
investment are repaid, the share of the cumulative exchange<br />
adjustments that is recognised directly in equity relating to<br />
that foreign entity is reclassified to profit for the year together<br />
with any gain or loss on disposal. The part of the translation reserve<br />
that relates to non-controlling interests is not transferred<br />
to profit for the year.<br />
On partial disposal of foreign subsidiaries that does not result<br />
in a loss of control, a proportionate share of the translation<br />
reserve is transferred from the parent company shareholders’<br />
share of equity to the non-controlling interests’ share of equity.<br />
Repayment of balances that are considered to form part of the<br />
net investment does not constitute a partial disposal of the<br />
subsidiary.<br />
Other external expenses<br />
Other external expenses comprise expenses for exploration,<br />
maintenance of production equipment, rent, external assistance,<br />
sales and marketing, research and development, and<br />
office expenses, etc.<br />
staff costs<br />
Staff costs comprise wages, salaries, remuneration, pensions,<br />
social security costs and other staff-related costs.<br />
Other operating income and expenses<br />
Other operating income and expenses comprise items secondary<br />
in nature to the Group’s activities, including gains and<br />
losses on ongoing disposal and replacement of intangible assets<br />
and property, plant and equipment, and grants received<br />
for certain production assets, and research and development<br />
projects.<br />
Grants for production assets and development projects are<br />
recognised as the assets to which they relate are depreciated.<br />
Other income and expenses are recognised as earned/incurred.<br />
Gains and losses on disposal of intangible assets and property,<br />
<strong>DONG</strong> ENERGY <strong>ANNUAL</strong> <strong>REPORT</strong> <strong>2011</strong> – COnsOliDatED finanCial statEmEnts<br />
135<br />
notes
notes<br />
40 Description of accounting policies<br />
plant and equipment are determined as the selling price less<br />
costs to sell and the carrying amount at the date of disposal.<br />
Government grants<br />
Government grants comprise grants for eco-friendly generation<br />
and grants for and funding of research and development projects.<br />
Government grants are recognised when there is reasonable<br />
assurance that they will be received.<br />
Grants for electricity generation are recognised as revenue as<br />
the related electricity revenue is recognised.<br />
Grants for research and development costs, which are recognised<br />
directly in profit for the year, are recognised as other<br />
operating income as the costs to which the grants relate are<br />
incurred.<br />
Grants for production assets and development projects are<br />
recognised in the balance sheet as liabilities and transferred<br />
to other operating income in profit for the year as the assets to<br />
which the grants relate are depreciated.<br />
Allocated CO 2 emissions allowances are recognised as rights<br />
within intangible assets. Reference is made to the description<br />
of the accounting policies under the relevant sections.<br />
share of profit (loss) of associates<br />
The proportionate share of associates’ profit after tax and noncontrolling<br />
interests and after elimination of the proportionate<br />
share of intragroup profits/losses is recognised in profit for the<br />
year.<br />
finance income and costs<br />
Finance income and costs comprise interest income and expense,<br />
capital gains and losses and impairment losses relating<br />
to securities, payables and transactions denominated in foreign<br />
currencies, amortisation of financial assets and liabilities,<br />
including lease commitments under finance leases, as well as<br />
surcharges and refunds under the on-account tax scheme, etc.<br />
Finance income and costs also include realised and unrealised<br />
gains and losses relating to hedging of interest rate and currency<br />
risks that have not been entered into to hedge revenue,<br />
fuel and energy or non-current assets. Interest is recognised<br />
under the accrual basis of accounting. Dividends from other<br />
equity investments are recognised as they are received.<br />
Borrowing costs relating to general borrowing or loans directly<br />
attributable to the acquisition, construction or development of<br />
qualifying assets form part of the cost of such assets.<br />
136 COnsOliDatED finanCial statEmEnts – <strong>DONG</strong> ENERGY <strong>ANNUAL</strong> <strong>REPORT</strong> <strong>2011</strong><br />
income tax expense<br />
The Group is subject to the Danish rules on compulsory joint<br />
taxation and has also elected international joint taxation with<br />
the Group’s foreign subsidiaries. The Group’s subsidiaries are<br />
included in the joint taxation from the date they are included<br />
in the consolidation in the consolidated financial statements<br />
and up to the date on which they are no longer included in the<br />
consolidation.<br />
The current Danish income tax is allocated among the jointly<br />
taxed Danish subsidiaries in proportion to their taxable income.<br />
In this connection Danish subsidiaries with tax losses<br />
receive joint taxation contributions from the parent company<br />
equivalent to the tax base of the tax losses utilised (full allocation),<br />
while companies that utilise tax losses in other Danish<br />
companies pay joint taxation contributions to the parent company<br />
equivalent to the tax base of the utilised losses.<br />
Income tax expense, which consists of current tax, joint taxation<br />
contribution for the year and changes in deferred tax, is<br />
recognised in profit for the year to the extent that it relates to<br />
profit for the year, and directly in other comprehensive income<br />
to the extent that it relates to entries directly to other comprehensive<br />
income.<br />
The Group is registered for the Danish on-account tax scheme.<br />
Tax refunds/tax surcharges are allocated between the jointly<br />
taxed Danish companies in accordance with the allocation of<br />
the Danish income tax and recognised as finance income and<br />
finance costs respectively.<br />
Subsidiaries that are engaged in oil and gas recovery (hydrocarbons)<br />
are subject to the hydrocarbon tax legislation in the<br />
countries in which they operate. Hydrocarbon taxes are calculated<br />
on the basis of taxable hydrocarbon income and comprise<br />
taxes calculated applying the respective country’s ordinary<br />
income tax rate as well as taxes calculated applying increased<br />
tax rates. Hydrocarbon taxes are recognised within income tax<br />
expense.<br />
intangible assets<br />
Goodwill<br />
Goodwill is recognised initially in the balance sheet at cost as<br />
described under business combinations. Subsequent to initial<br />
recognition, goodwill is measured at cost less accumulated<br />
impairment losses. Goodwill is not amortised. The carrying<br />
amount of goodwill is allocated to the Group’s cash-generating<br />
units at the acquisition date. The determination of cash-generating<br />
units follows the Group’s organisational and internal<br />
reporting structure.
CO 2 emissions allowances<br />
Allocated and purchased CO 2 emissions allowances, including<br />
CO 2 credits, that are accounted for as rights are measured ini-<br />
tially at cost. If a grant is received in connection with an allocation,<br />
the cost constitutes the actual consideration paid for the<br />
allowances, i.e. nil if the allowances are allocated free of charge.<br />
CO2 emissions allowances are not amortised, as their residual<br />
value equals their cost.<br />
rights<br />
Rights comprise gas purchase rights, acquired customer rights<br />
and IT software licences, etc., and are measured at cost less accumulated<br />
amortisation and impairment losses.<br />
Gas purchase rights are amortised using the unit-of-production<br />
method, taking into account the expected earnings profile, so<br />
that the amortisation pattern reflects the expected earnings<br />
patterns. Other rights are amortised on a straight-line basis<br />
over their expected economic lives, which are determined on<br />
the basis of management’s experience of the specific business<br />
areas, and the assets to which the rights relate. Capitalised<br />
rights are estimated to have a life of 5 - 20 years.<br />
Development projects<br />
Development projects that are clearly defined and identifiable,<br />
and for which technical feasibility, adequate resources and a<br />
future application in the enterprise can be demonstrated, and<br />
which the enterprise intends to manufacture or use, are recognised<br />
within intangible assets if the cost can be determined<br />
reliably and if there is reasonable certainty that the future<br />
earnings will cover all costs. Other development costs are recognised<br />
in profit for the year as incurred.<br />
Capitalised development costs are measured at cost less accumulated<br />
amortisation and impairment losses. Cost comprises<br />
wages and salaries and other costs attributable to the Group’s<br />
development activities. Borrowing costs relating to specific and<br />
general borrowing directly attributable to the development of<br />
development projects are recognised in cost.<br />
On completion of the development work, development projects<br />
are amortised on a straight-line basis over the estimated economic<br />
life from the date the asset is available for use. The amortisation<br />
period is usually five years. The basis of amortisation<br />
is reduced by any impairment losses.<br />
investments in associates<br />
Investments in associates are measured in the consolidated<br />
financial statements using the equity method whereby the<br />
investments are measured in the balance sheet at the proportionate<br />
share of the associates’ net assets determined in<br />
accordance with the Group’s accounting policies, increased by<br />
or net of the proportionate share of unrealised intragroup gains<br />
and losses and increased by any excess of cost on acquisition,<br />
including goodwill.<br />
Associates with negative net assets are measured at nil. If the<br />
Group has a legal or constructive obligation to cover the associate’s<br />
deficit, the obligation is recognised as a liability.<br />
Receivables from associates are measured at amortised cost.<br />
Write-downs are made for bad debts.<br />
On acquisition of investments in associates, the purchase<br />
method is applied, see the description under business<br />
combinations.<br />
Other equity investments<br />
Other equity investments comprise unlisted securities. Other<br />
equity investments are recognised initially in the balance<br />
sheet at cost, equivalent to fair value plus transaction costs.<br />
Subsequent to initial recognition, other equity investments are<br />
measured at cost less any impairment losses, as it is deemed<br />
impracticable to reliably determine their fair value.<br />
Other equity investments are recognised as financial assets<br />
available for sale. Available-for-sale financial assets are those<br />
non-derivative financial assets that are designated as available<br />
for sale or are not classified as loans and receivables, financial<br />
assets at fair value through profit for the year or held-to-maturity<br />
financial assets.<br />
Other non-current financial assets<br />
Other non-current financial assets comprise receivables that<br />
are recognised initially in the balance sheet at cost, equivalent<br />
to fair value, and are subsequently measured at amortised cost.<br />
inventories<br />
Inventories consist of oil and gas in storage facilities, as well<br />
as raw materials, consumables, fuel inventories, CO2 emissions<br />
allowances and green certificates.<br />
In the case of oil, cost is determined as the average production<br />
cost. In the case of gas, cost is determined as a weighted average<br />
of the previous month’s buying prices, including transportation<br />
costs.<br />
Allocated and purchased CO 2 emissions allowances that form<br />
part of the Group’s trading activities with a view to generating<br />
gains from short-term price fluctuations are measured at fair<br />
value with value adjustments recognised in profit for the year.<br />
<strong>DONG</strong> ENERGY <strong>ANNUAL</strong> <strong>REPORT</strong> <strong>2011</strong> – COnsOliDatED finanCial statEmEnts<br />
137<br />
notes
notes<br />
40 Description of accounting policies<br />
Other inventories are measured at cost using the first-in, firstout<br />
(FIFO) principle or net realisable value. Inventories are<br />
written down to net realisable value whenever the cost exceeds<br />
the net realisable value.<br />
The net realisable value of inventories is determined as the<br />
expected selling price less any costs of completion and costs<br />
incurred to execute the sale, and is determined taking into<br />
account marketability, obsolescence and development of expected<br />
selling price.<br />
receivables<br />
Receivables are measured at amortised cost. A write-down<br />
for bad and doubtful debts is made if there is any objective<br />
evidence of impairment of a receivable or a portfolio of<br />
receivables.<br />
Receivables for which objective evidence of impairment is not<br />
available on an individual basis are assessed for impairment on<br />
a portfolio basis. Portfolios are primarily based on the debtor’s<br />
registered office and credit rating in conformity with the<br />
Group’s credit risk management policy. The objective evidence<br />
applied to portfolios is determined on the basis of historical<br />
loss experience.<br />
If there is any objective evidence of impairment of a portfolio,<br />
an impairment test is carried out where expected future cash<br />
flows are estimated on the basis of historical loss experience<br />
adjusted for current market conditions and individual factors<br />
related to the individual portfolio.<br />
The impairment loss is calculated as the difference between<br />
the carrying amount and the present value of estimated future<br />
cash flows, including the realisable value of any collateral received.<br />
The discount rate used is the effective interest rate for<br />
the individual receivable or portfolio.<br />
Recognition of interest income on impaired receivables is calculated<br />
on the written-down value at the effective interest rate<br />
for the individual receivable or portfolio.<br />
Construction contracts<br />
Construction contracts comprise the construction of assets<br />
involving a high degree of customisation in terms of design,<br />
and where a binding contract has been entered into prior to<br />
start-up of the work that will trigger a penalty or compensation<br />
in the event of subsequent cancellation. Construction<br />
contracts also include services such as establishment of grids<br />
and networks, etc. Construction contracts are measured at the<br />
selling price of the work performed less progress billings. The<br />
selling price of construction contracts is measured on the basis<br />
of the stage of completion at the balance sheet date and total<br />
138 COnsOliDatED finanCial statEmEnts – <strong>DONG</strong> ENERGY <strong>ANNUAL</strong> <strong>REPORT</strong> <strong>2011</strong><br />
expected income on each contract. The stage of completion<br />
is determined on the basis of an assessment of the work performed,<br />
normally determined as the proportion that contract<br />
costs incurred for work performed to date bear to the estimated<br />
total contract costs.<br />
When it is probable that total contract costs on a construction<br />
contract will exceed total contract revenue, the expected loss<br />
on the construction contract is recognised immediately as an<br />
expense and a provision.<br />
When the outcome of a construction contract cannot be estimated<br />
reliably, the selling price is recognised only to the extent<br />
of costs incurred that it is probable will be recoverable.<br />
Where the selling price of work performed on construction contracts<br />
exceeds progress billings and expected losses, the contracts<br />
are recognised as receivables. Where progress billings<br />
and expected losses exceed the selling price of construction<br />
contracts, the contracts are recognised as liabilities.<br />
Prepayments from customers are recognised as liabilities.<br />
Costs related to sales work and the winning of contracts are<br />
recognised in profit for the year as incurred.<br />
short-term and long-term securities<br />
Securities, comprising bonds that are monitored, measured<br />
and reported at fair value on a continuing basis in conformity<br />
with the Group’s investment policy, are recognised at the trade<br />
date as current assets and measured at fair value, equivalent<br />
to market price for listed securities and estimated fair value<br />
determined on the basis of current market data and recognised<br />
valuation methods for unlisted securities.<br />
Changes in the fair value of securities are recognised in profit<br />
for the year as finance income and costs.<br />
Sold securities where a repurchase agreement (repo transactions)<br />
has been made at the time of sale are recognised in the<br />
balance sheet at the settlement date as if the securities were<br />
still held. The amount received is recognised as a liability, and<br />
the difference between the selling price and the purchase price<br />
is recognised in profit for the year over the term as interest. The<br />
return on the securities is recognised in profit for the year.<br />
income tax and deferred tax<br />
Current tax payable and receivable is recognised in the balance<br />
sheet as tax computed on the taxable income for the year, adjusted<br />
for taxes paid on account.
Deferred tax is measured using the balance sheet liability<br />
method, providing for all temporary differences between the<br />
carrying amounts and the tax base of assets and liabilities.<br />
However, deferred tax on temporary differences is not provided<br />
for in respect of goodwill not deductible for tax purposes, office<br />
properties and other items - apart from business combinations<br />
- where temporary differences have arisen at the acquisition<br />
date without having any effect on either profit/loss or taxable<br />
income. Where different tax rules can be applied to determine<br />
the tax base, deferred tax is measured on the basis of management’s<br />
planned use of the asset or settlement of the liability<br />
respectively.<br />
Deferred tax assets, including the tax base of tax loss carryforwards,<br />
are recognised as other non-current assets at the value<br />
at which they are expected to be utilised either by elimination<br />
against tax on future earnings or by set-off against deferred tax<br />
liabilities within the same legal tax entity and jurisdiction.<br />
Deferred tax assets and deferred tax liabilities are offset if the<br />
enterprise has a legally enforceable right to set off current<br />
tax assets and current tax liabilities or intends either to settle<br />
on a net basis or to realise the asset and settle the liability<br />
simultaneously.<br />
Adjustment of deferred tax is made relating to eliminations of<br />
unrealised intragroup profits and losses.<br />
Deferred tax is measured in accordance with the tax rules and<br />
tax rates in the respective countries that will apply under the<br />
legislation enacted at the balance sheet date when the deferred<br />
tax is expected to crystallise in the form of current tax. Changes<br />
in deferred tax as a result of changes in tax rates are recognised<br />
in profit for the year.<br />
Deferred tax on temporary differences between the carrying<br />
amounts and the tax base of acquisitions of jointly controlled<br />
assets, including licence interests, is not provided for.<br />
pension obligations<br />
Pension obligations relate to pensions for a few non-insured<br />
former employees (defined benefit plans). The obligation has<br />
been determined using an actuarial calculation. In the case<br />
of defined benefit plans, the present value of future benefits<br />
to be paid under the plan is determined actuarially on an annual<br />
basis. The present value is determined on the basis of<br />
assumptions about future trends in salary levels, interest rates,<br />
inflation, mortality, etc. The present value is determined only<br />
for the benefits to which the employees have earned the right<br />
through service already rendered to the Group. The actuarially<br />
determined present value is recognised in the balance sheet<br />
within pension obligations. The year’s pension costs, including<br />
actuarial gains and losses, are recognised in profit for the year.<br />
The financial consequences of the defined benefit pension<br />
plans entered into by the Group are insignificant.<br />
leasing<br />
Lease commitments are accounted for as commitments under<br />
finance leases and commitments under operating leases<br />
respectively.<br />
A lease is classified as a finance lease if it transfers substantially<br />
all the risks and rewards incidental to ownership of the<br />
leased asset. Other leases are classified as operating leases.<br />
The accounting treatment of assets held under finance leases<br />
and the associated liability are described in the sections on<br />
property, plant and equipment and financial liabilities.<br />
Lease payments under operating leases are recognised in profit<br />
for the year over the term of the lease on a straight-line basis.<br />
assets classified as held for sale<br />
Assets classified as held for sale and the associated liabilities<br />
are presented as separate line items in the balance sheet, and<br />
the principal items are specified in the notes. Comparative figures<br />
in the balance sheet are not restated.<br />
Assets classified as held for sale comprise non-current assets<br />
and disposal groups classified as held for sale. Disposal groups<br />
are groups of assets to be disposed of, by sale or otherwise, together<br />
as a group in a single transaction. Liabilities relating to<br />
assets held for sale are liabilities directly associated with those<br />
assets that will be transferred in the transaction. Assets are<br />
classified as held for sale when their carrying amount will be<br />
recovered principally through a sale transaction within twelve<br />
months under a formal plan rather than through continuing<br />
use.<br />
Assets or disposal groups classified as held for sale are measured<br />
at the lower of carrying amount at the date of classification<br />
as held for sale and fair value less costs to sell. No depreciation<br />
or amortisation is charged on assets from the date they<br />
are classified as held for sale.<br />
Impairment losses arising on initial classification as held for<br />
sale and gains and losses on subsequent measurement at the<br />
lower of carrying amount and fair value less costs to sell are<br />
recognised in profit for the year within the items to which they<br />
relate. Gains and losses are disclosed in the notes.<br />
<strong>DONG</strong> ENERGY <strong>ANNUAL</strong> <strong>REPORT</strong> <strong>2011</strong> – COnsOliDatED finanCial statEmEnts<br />
139<br />
notes
notes<br />
40 Description of accounting policies<br />
statement of cash flows<br />
The statement of cash flows shows cash flows for the year from<br />
operating, investing and financing activities, the year’s changes<br />
in cash and cash equivalents, and cash and cash equivalents at<br />
the beginning and end of the year.<br />
The cash flow effect of acquisitions and disposals of enterprises<br />
is disclosed separately under cash flows from investing activities.<br />
Cash flows relating to acquired enterprises are recognised<br />
in the statement of cash flows from the date of acquisition, and<br />
cash flows relating to enterprises disposed of are recognised up<br />
to the date of disposal.<br />
Cash flows from operating activities are determined using the<br />
indirect method as operating profit adjusted for non-cash operating<br />
items, changes in net working capital, interest received<br />
and interest paid, and income tax paid. Change in trade payables<br />
relating to purchases of intangible assets and property,<br />
plant and equipment are not recognised in net working capital<br />
Cash flows from investing activities comprise payments in<br />
connection with acquisition and disposal of enterprises and activities;<br />
purchase and sale of intangible assets, property, plant<br />
and equipment and other non-current assets; and purchase<br />
and sale of securities that are not recognised as cash and cash<br />
equivalents.<br />
Finance leases are accounted for as non-cash transactions.<br />
Cash flows from financing activities comprise changes in the<br />
size or composition of the share capital and costs associated<br />
with such changes as well as the raising of loans, repayment of<br />
interest-bearing debt and payment of dividends to owners and<br />
coupon payments relating to hybrid capital.<br />
Cash flows relating to assets held under finance leases are recognised<br />
as payment of interest and repayment of debt.<br />
Cash and cash equivalents comprise cash as well as securities<br />
that form part of the ongoing cash management, are readily<br />
convertible to cash and are subject to an insignificant risk of<br />
changes in value.<br />
Cash flows in currencies other than the functional currency<br />
are translated at the average exchange rates for the month in<br />
question, unless these differ significantly from the rates at the<br />
transaction date.<br />
140 COnsOliDatED finanCial statEmEnts – <strong>DONG</strong> ENERGY <strong>ANNUAL</strong> <strong>REPORT</strong> <strong>2011</strong><br />
segment information<br />
Operating segments are reported in accordance with the<br />
Group’s internal management reporting, which is presented<br />
to the Group’s chief operating decision maker. The operating<br />
decision maker is the Group Executive Management.<br />
In the segment reporting, hedging transactions relating to<br />
commodity risks and related foreign exchange exposures are<br />
recognised at the same time as the hedged transaction, so that<br />
the hedged transaction is recognised at the hedged value. This<br />
is the same method of accounting for hedging transactions<br />
as presented in the business performance column in the consolidated<br />
financial statements. Apart from this, the accounting<br />
policy is consistent with the accounting policy applied in the<br />
consolidated financial statements.<br />
Segment income, segment expense, segment assets and<br />
segment liabilities are those items that have been directly attributed<br />
to the individual segment or indirectly allocated to<br />
the individual segment on a reliable basis. Unallocated items<br />
are included in other activities and comprise primarily assets,<br />
liabilities, revenue and expense relating to the Group’s administrative<br />
functions, investing activities, income taxes, etc.<br />
The Group’s primary measure of performance is EBITDA.<br />
EBITDA is defined as earnings before interest, tax, depreciation<br />
and amortisation.<br />
The Group’s secondary measure of performance is EBIT. EBIT is<br />
defined as earnings before interest and tax.<br />
Segment assets comprise those assets that are directly employed<br />
by a segment in its operating activities. Current tax and<br />
deferred tax are not allocated to individual segments, as they<br />
are not directly employed by the individual segment in its operating<br />
activities.<br />
Segment information in respect of geographical markets is<br />
determined by breaking revenue down, as far as possible, by<br />
customer location based on supply point. When delivery is<br />
made directly from production platforms in the North Sea, the<br />
final supply point is not known to <strong>DONG</strong> <strong>Energy</strong>. In such cases,<br />
customer location is defined on the basis of invoicing address.<br />
Non-current assets are broken down geographically based on<br />
the physical location of the assets and comprise intangible assets<br />
and property, plant and equipment.<br />
Intersegment transactions are priced on arm’s length terms.
Definitions of performance highlights<br />
Definition of performance highlights<br />
EBITDA adjusted for hydrocarbon tax EBITDA adjusted for hydrocarbon tax. Hydrocarbon tax is a result of the Group’s oil and gas<br />
extraction.<br />
Funds From Operation (FFO) Cash fl ows from operating activities before change in net working capital.<br />
Gross investments Cash fl ows from investing activities, excluding dividends received from associates and equity<br />
investments, purchases and sales of securities, loans to jointly controlled entities, and disposals<br />
of assets and enterprises.<br />
Net investments Gross investments less disposals of assets and enterprises. To/from this is added/deducted<br />
acquired/transferred debt in connection with acquisitions and disposals of enterprises, and<br />
deducted non-controlling interests’ share of investments in fully consolidated investment<br />
projects, and deducted the selling price of non-controlling interests.<br />
Financial gearing 1<br />
Adjusted net debt to cash fl ows from<br />
operating activities<br />
Interest-bearing net debt<br />
Total equity<br />
Adjusted net debt<br />
Cash fl ows from operating activities<br />
Adjusted net debt Interest-bearing net debt plus 50% of the hybrid capital due in 3005.<br />
Adjusted net debt to<br />
EBITDA<br />
Return on capital employed (ROCE)<br />
Adjusted net debt<br />
EBITDA<br />
Adjusted operating profi t<br />
Average invested capital<br />
Adjusted operating profi t EBIT adjusted for hydrocarbon tax plus profi t from associates less interest element of decommissioning<br />
obligations.<br />
Capital employed Non-interest-bearing net assets corresponding to non-interest-bearing assets less non-interestbearing<br />
liabilities.<br />
Average capital employed<br />
Adjusted return on capital employed<br />
(Capital employed beg. of year + capital employed year end)<br />
2<br />
Adjusted operating profi t<br />
Average adjusted capital employed<br />
Adjusted capital employed Capital employed less property, plant and equipment under construction and exploration assets,<br />
and less production assets transferred from property, plant and equipment under construction<br />
in the past six months.<br />
Earnings per share (EPS) of DKK 10 2<br />
Proposed dividends per share (DPS)<br />
of DKK 10 1<br />
Payout ratio<br />
Average number of shares 3<br />
Net working capital external<br />
transactions<br />
Net working capital intragroup<br />
transactions<br />
Profi t for the year<br />
Average number of shares<br />
Total proposed dividend<br />
Number of shares year end<br />
Total proposed dividend<br />
Profi t for the year attributable to equity holders<br />
(Shares beg of year x D ) + (Shares year end x (365-D))<br />
365<br />
Inventories, trade receivables, associates and jointly controlled entities and other operating<br />
current assets less trade payables and liabilities to associates and jointly controlled entities and<br />
other operating current liabilities. Prepayments and deferred income are not recognised in the<br />
determination of net working capital.<br />
Intragroup trade receivables less intragroup trade payables.<br />
1 The calculation is in accordance with ‘Recommendations & Financial Ratios 2010’ published by the Danish Society of Financial Analysts.<br />
2 Earnings per share (EPS) is determined in accordance with IAS 33.<br />
3 D = number of days prior to a capital increase, including the day on which the proceeds are received.<br />
<strong>DONG</strong> ENERGY <strong>ANNUAL</strong> <strong>REPORT</strong> <strong>2011</strong> – COnsOliDatED finanCial statEmEnts<br />
141<br />
notes
notes<br />
41 Licence overview<br />
significant licences and hydrocarbon exploration and extraction licences in Denmark and abroad<br />
Segment/location Activity Licence<br />
Ownership<br />
interest (%) Expiry<br />
Exploration & production<br />
Denmark Production Licence 7/86 Lulita Part 44 2026<br />
Denmark Production Licence 7/89 Syd Arne Field 37 2027<br />
Denmark Production Licence 1/90 Lulita 22 2026<br />
Denmark Production Licence 4/95 Nini Field 40 2032<br />
Denmark Production Licence 6/95 Siri 100 2027<br />
Denmark Production Licence 16/98 Cecilie Field 22 2032<br />
Norway Production Licence PL250 Ormen Lange 9 2041<br />
Norway Production Licence PL019 Ula 20 2029<br />
Norway Production Licence PL019B Gyda 34 2018<br />
Norway Production Licence PL065 Tambar 45 2022<br />
Norway Production Licence PL300 Tambar East 45 2023<br />
Norway Production Licence P159B Alve 15 2029<br />
Norway Production Licence PL208 Ormen Lange 45 2040<br />
Norway Production Licence PL147 Trym/Trym South 50 2027<br />
Denmark Development Licence 5/98 Hejre 60 2040<br />
Norway Development Licence PL274 Oselvar 55 2039<br />
Norway Development Licence PL113 Mjølner 20 2021<br />
Norway Development Licence PL122 Marulk 30 2025<br />
Norway Development Licence PL122B Marulk 30 2025<br />
Norway Development Licence PL122C Marulk 30 2025<br />
Norway Development Licence PL122D Marulk 30 2025<br />
Norway Development Licence PL274CS Oselvar 55 2039<br />
UK Development Licence P911 Laggan 20 2031<br />
UK Development Licence P1159 Tormore 20 2030<br />
UK Development Licence P1026 Rosebank 10 2018<br />
UK Development Licence P1028 Cambo 20 2037<br />
UK Development Licence P1189 Cambo 20 2030<br />
UK Development Licence P1190 Tornado 20 2030<br />
UK Development Licence P1191 Rosebank South 10 2030<br />
UK Development Licence P1195 Glenlivet 80 2030<br />
UK Development Licence P1262 Tornado 20 2031<br />
UK Development Licence P1272 Rosebank 10 2031<br />
UK Development LicenceP1678 Tormore 20 2013<br />
UK Development Licence P967 Tobermory 33 2033<br />
Denmark Exploration Licence 7/86 Amalie Part 30 2026<br />
Denmark Exploration Licence 9/95 Maja 20 2012<br />
Denmark Exploration Licence 4/98 Svane/Solsort 35 2013<br />
Denmark Exploration Licence 1/06 Hejre Extension 48 2040<br />
142 COnsOliDatED finanCial statEmEnts – <strong>DONG</strong> ENERGY <strong>ANNUAL</strong> <strong>REPORT</strong> <strong>2011</strong>
significant licences and hydrocarbon exploration and extraction licences in Denmark and abroad<br />
Segment/location Activity Licence<br />
Ownership<br />
interest (%) Expiry<br />
Denmark Exploration Licence 2/06 Syd Arne Extension 27 2012<br />
Denmark Exploration Licence 03/09 Solsort 35 2015<br />
Norway Exploration Licence PL019C 35 2018<br />
Norway Exploration Licence PL019D 34 2018<br />
Norway Exploration Licence PL289 Musling 40 2039<br />
Norway Exploration Licence PL299 Frode 40 2013<br />
Norway Exploration Licence PL301CS Agn 28 2013<br />
Norway Exploration Licence PL360 Lupin 20 2014<br />
Norway Exploration Licence PL360B 20 2014<br />
Norway Exploration Licence PL429 Spinell 30 2013<br />
Norway Exploration Licence PL518 Zapffe 40 2016<br />
Norway Exploration Licence PL518B 40 2016<br />
Norway Exploration Licence PL529 Himmelbjerget 20 2016<br />
Norway Exploration Licence PL613 Fafner 40 2017<br />
UK Exploration Licence P1194 Aberlour 10 2012<br />
UK Exploration Licence P1453 Edradour/Spinnaker 25 2033<br />
UK Exploration Licence P1454 Glenrothes 40 2013<br />
UK Exploration Licence P1598 Cragganmore 40 2013<br />
UK Exploration Licence P1636 Longmorn 30 2015<br />
UK Exploration Licence P1830 Black Rock 25 2015<br />
UK Exploration Licence P1838 Tomintoul 20 2015<br />
UK Exploration Licence P1846 Sula/Stelkur 30 2015<br />
UK Exploration Licence P1847 Milburn 30 2015<br />
Faroe Islands Exploration Licence F008 Sula/Stelkur 30 2014<br />
Faroe Islands Exploration Licence F016 Kúlubøkan 30 2014<br />
Greenland Exploration Licence G2007/26 Puilasoq 29 2017<br />
Greenland Exploration Licence G<strong>2011</strong>/11 Qamut 26 2014<br />
Norway Gas pipeline Gassled 1 -<br />
wind Power<br />
Denmark Production Electricity generation licence (Nysted) - 2027<br />
Denmark Production Electricity generation licence<br />
(Middelgrunden)<br />
- 2025<br />
Denmark Production Electricity generation licence<br />
(Horns Rev 2)<br />
Denmark Production Electricity generation licence<br />
(general)<br />
- 2034<br />
- 2020<br />
Poland Production Electricity generation licence (Karnice) - 2030<br />
Poland Production Electricity generation licence<br />
(Karcino)<br />
Poland Production Electricity generation licence<br />
(Lake Ostrowo)<br />
- 2030<br />
- 2025<br />
UK Production Electricity generation licence (Walney) - 2035<br />
<strong>DONG</strong> ENERGY <strong>ANNUAL</strong> <strong>REPORT</strong> <strong>2011</strong> – COnsOliDatED finanCial statEmEnts<br />
143<br />
notes
notes<br />
41 Licence overview<br />
significant licences and hydrocarbon exploration and extraction licences in Denmark and abroad<br />
Segment/location Activity Licence<br />
thermal power<br />
Denmark Exploration/<br />
production<br />
Geothermal energy exploration and<br />
extraction licence<br />
Denmark Production Electricity generation licence<br />
(general)<br />
Ownership<br />
interest (%) Expiry<br />
- 2013<br />
- 2022<br />
UK Production Electricity generation licence (Severn) - 2032<br />
sales & Distribution<br />
Denmark Sales Natural gas supply licence - 20131 Denmark Sales Underground natural gas storage<br />
licence<br />
Denmark Sales Underground natural gas storage<br />
licence<br />
- 2023<br />
- 2012<br />
Denmark Sales Natural gas distribution licence - 2023<br />
Denmark Sales Electricity distribution licence - 2023<br />
Denmark Sales Electricity transmission licence - 2025<br />
Denmark Sales PSO licence, electricity - 2012<br />
1 The licence is renewed on an ongoing basis for five-year terms.<br />
For a number of the Group’s licences, the licence expiry dates<br />
shown opposite each licence indicate the entire term of the<br />
exploration and evaluation licence that can be retained if <strong>DONG</strong><br />
<strong>Energy</strong> and the Group’s partners in each licence meet certain<br />
licence criteria. These criteria may include an obligation to drill<br />
a specific number of wells or to assume other obligations relating<br />
to planning or development of the area to which the licence<br />
relates. If <strong>DONG</strong> <strong>Energy</strong> and the Group’s licence partners opt<br />
144 COnsOliDatED finanCial statEmEnts – <strong>DONG</strong> ENERGY <strong>ANNUAL</strong> <strong>REPORT</strong> <strong>2011</strong><br />
not to meet such criteria, the licence term may expire earlier<br />
than the date shown in the table above.<br />
For wind farms with a capacity of less than 25 MW in Denmark<br />
and less than 100 MW in the UK, a production licence is not<br />
required.
42 Company overview<br />
Segment/company Type 1 Registered office<br />
Ownership<br />
interest<br />
parent company<br />
<strong>DONG</strong> <strong>Energy</strong> A/S Fredericia, Denmark -<br />
Exploration & production<br />
<strong>DONG</strong> CentralGraben E&P Ltd. S Fredericia, Denmark 100%<br />
<strong>DONG</strong> E&P nr. 1 2008 A/S2 S Fredericia, Denmark 100%<br />
<strong>DONG</strong> E&P (UK) Ltd. S London, England 100%<br />
<strong>DONG</strong> E&P A/S S Fredericia, Denmark 100%<br />
<strong>DONG</strong> E&P Føroyar P/F S Torshavn, Faroe Islands 100%<br />
<strong>DONG</strong> E&P Grønland A/S S Sermersooq, Greenland 100%<br />
<strong>DONG</strong> E&P Norge AS S Stavanger, Norway 100%<br />
<strong>DONG</strong> E&P Shetland Islands (UK) Ltd. S London, England 100%<br />
<strong>DONG</strong> E&P Siri (UK) Ltd. S London, England 100%<br />
Shetland Land Lease Ltd. A London, England 20%<br />
wind power<br />
Anholt Havvindmøllepark I/S J Fredericia, Denmark 50%<br />
A2SEA A/S S Fredericia, Denmark 51%<br />
A2SEA Deutschland GmbH S Hamburg, Germany 51%<br />
A2SEA Ltd. S London, England 51%<br />
Barrow Offshore Wind Ltd. J Berkshire, England 50%<br />
Borkum Riffgrund I Holding A/S S Fredericia, Denmark 100%<br />
Breeveertien II Wind Farm B.V. J Rotterdam, Netherlands 50%<br />
CT Offshore A/S A Odense, Denmark 15%<br />
Den Helder Wind Farm B.V. J Rotterdam, Netherlands 50%<br />
<strong>DONG</strong> <strong>Energy</strong> 1 Sp. z o. o. S Warsaw, Poland 100%<br />
<strong>DONG</strong> <strong>Energy</strong> 2 Sp. z o. o. S Warsaw, Poland 100%<br />
<strong>DONG</strong> <strong>Energy</strong> 3 Sp. z o. o. S Warsaw, Poland 100%<br />
<strong>DONG</strong> <strong>Energy</strong> 4 Sp. z o. o. S Warsaw, Poland 100%<br />
<strong>DONG</strong> <strong>Energy</strong> 5 Sp. z o. o. S Warsaw, Poland 100%<br />
<strong>DONG</strong> <strong>Energy</strong> 6 Sp. z o. o. S Warsaw, Poland 100%<br />
<strong>DONG</strong> <strong>Energy</strong> - Anholt Offshore A/S S Fredericia, Denmark 100%<br />
<strong>DONG</strong> <strong>Energy</strong> Borkum Riffgrund I GmbH S Hamburg, Germany 100%<br />
<strong>DONG</strong> <strong>Energy</strong> Borkum Riffgrund West I GmbH S Hamburg, Germany 100%<br />
<strong>DONG</strong> <strong>Energy</strong> Bukowo Sp. z o. o. S Warsaw, Poland 100%<br />
<strong>DONG</strong> <strong>Energy</strong> Burbo (UK) Limited S London, England 100%<br />
<strong>DONG</strong> <strong>Energy</strong> Burbo Extension (UK) Ltd. S London, England 100%<br />
<strong>DONG</strong> <strong>Energy</strong> Gasiorowo Sp. z o. o. S Warsaw, Poland 100%<br />
<strong>DONG</strong> <strong>Energy</strong> Gunfleet Sands Demo (UK) Ltd. S London, England 100%<br />
<strong>DONG</strong> <strong>Energy</strong> Horns Rev I A/S S Fredericia, Denmark 100%<br />
<strong>DONG</strong> <strong>Energy</strong> Horns Rev 2 A/S S Fredericia, Denmark 100%<br />
<strong>DONG</strong> <strong>Energy</strong> Karcino Sp. z o.o. S Koszalin, Poland 100%<br />
<strong>DONG</strong> ENERGY <strong>ANNUAL</strong> <strong>REPORT</strong> <strong>2011</strong> – COnsOliDatED finanCial statEmEnts<br />
145<br />
notes
notes<br />
42 Company overview<br />
Segment/company Type 1 Registered office<br />
Ownership<br />
interest<br />
<strong>DONG</strong> <strong>Energy</strong> Karnice III Sp. z o.o. S Warsaw, Poland 100%<br />
<strong>DONG</strong> <strong>Energy</strong> Lincs (UK) Ltd. S London, England 100%<br />
<strong>DONG</strong> <strong>Energy</strong> London Array Ltd. S London, England 100%<br />
<strong>DONG</strong> <strong>Energy</strong> London Array II Ltd. S London England 100%<br />
<strong>DONG</strong> <strong>Energy</strong> NearshoreLAB, Frederikshavn A/S S Frederikshavn, Denmark 100%<br />
<strong>DONG</strong> <strong>Energy</strong> Nysted I A/S S Fredericia, Denmark 89%<br />
<strong>DONG</strong> <strong>Energy</strong> Olecko Sp. z o.o. S Warsaw, Poland 100%<br />
<strong>DONG</strong> <strong>Energy</strong> Pancerzyn Sp. z o.o. S Warsaw, Poland 100%<br />
<strong>DONG</strong> <strong>Energy</strong> Polska S.A. S Warsaw, Poland 100%<br />
<strong>DONG</strong> <strong>Energy</strong> Power (Gunfleet Sands) Ltd. S London, England 100%<br />
<strong>DONG</strong> <strong>Energy</strong> Power (Participation) Ltd. S London, England 100%<br />
<strong>DONG</strong> <strong>Energy</strong> Power (UK) Ltd. S London, England 100%<br />
<strong>DONG</strong> <strong>Energy</strong> Power Vind Norge AS S Stavanger, Norway 100%<br />
<strong>DONG</strong> <strong>Energy</strong> Renewables Germany GmbH S Hamburg, Germany 100%<br />
<strong>DONG</strong> <strong>Energy</strong> Renewables Polska Sp. z o.o. S Warsaw, Poland 100%<br />
<strong>DONG</strong> <strong>Energy</strong> Shell Flats (UK) Limited S London, England 100%<br />
<strong>DONG</strong> <strong>Energy</strong> Tuszyny Sp. z o.o. S Warsaw, Poland 100%<br />
<strong>DONG</strong> <strong>Energy</strong> Walney Extension (UK) Ltd. S London, England 100%<br />
<strong>DONG</strong> <strong>Energy</strong> West of Duddon Sands (UK) Limited S London, England 100%<br />
<strong>DONG</strong> VE A/S S Fredericia, Denmark 100%<br />
<strong>DONG</strong> Vind A/S S Fredericia, Denmark 100%<br />
<strong>DONG</strong> Wind I (UK) Ltd. S London, England 100%<br />
<strong>DONG</strong> Wind (UK) II Ltd. S London, England 100%<br />
E2 Landvind A/S S Fredericia, Denmark 100%<br />
E2 Landvind A/S af 15. september 2003 S Fredericia, Denmark 100%<br />
E2 Landvind A/S af 20. oktober 2003 S Fredericia, Denmark 100%<br />
Energi E2 Renewables A/S S Fredericia, Denmark 100%<br />
Greenpower (Broadmeadows) Limited J Aberdeen, Scotland 50%<br />
Gunfleet Grid Company Limited S London, England 100%<br />
Gunfleet Sands Ltd. S London, England 50%<br />
Gunfleet Sands II Ltd. S London, England 50%<br />
Gunfleet Sands Holding Ltd. S London, England 50%<br />
Heron Wind Limited A London, England 33%<br />
Heron Wind Transmission Limited A London, England 33%<br />
Heysham Offshore Wind Ltd. S London, England 100%<br />
Kappa Sp. z o.o. S Szczecin, Poland 100%<br />
Kraftgården AB A Ragunda, Sweden 26%<br />
Kvalheim Kraft DA A Drammen, Norway 33%<br />
Lincs Renewable <strong>Energy</strong> Holdings Limited J London, England 50%<br />
Lincs Wind Farm Ltd. J Edinburgh, Scotland 25%<br />
London Array Ltd. J Coventry, England 50%<br />
Morecambe Wind Ltd. J London, England 50%<br />
146 COnsOliDatED finanCial statEmEnts – <strong>DONG</strong> ENERGY <strong>ANNUAL</strong> <strong>REPORT</strong> <strong>2011</strong>
Segment/company Type 1 Registered office<br />
Ownership<br />
interest<br />
Nesa Vind A/S S Gentofte, Denmark 100%<br />
Njord Limited A London, England 33%<br />
Omikron Sp. z o.o. S Szczecin, Poland 100%<br />
Ploudalmezeau - Breiz Avel 01 S.A.S. S Paris, France 100%<br />
<strong>DONG</strong> <strong>Energy</strong> Borkum Riffgrund II GmbH S Cuxhaven, Germany 100%<br />
Polska Energia Wiatrowa Sp. z o.o. S Szczecin, Poland 100%<br />
P/S BI New <strong>Energy</strong> Solutions A Copenhagen, Denmark 22%<br />
Scarweather Sands Ltd. J Coventry, England 50%<br />
Storrun Vindkraft AB S Uddevalla, Sweden 80%<br />
Storrun Vindkraft Elnät AB S Stockholm, Sweden 80%<br />
Universal Foundation A/S A Aalborg, Denmark 27%<br />
Vattenfall Indalsälven AB A Ragunda, Sweden 26%<br />
Walney (UK) Offshore Windfarms Ltd. S London, England 50%<br />
West Rijn Wind Farm B.V. J Rotterdam, Netherlands 50%<br />
Westermost Rough Ltd. S London, England 100%<br />
Zephyr AS A Sarpsborg, Norway 33%<br />
thermal power<br />
AOT ApS S Fredericia, Denmark 100%<br />
Carron Engineering & Construction Limited S Stokesley, England 100%<br />
DE POWER NR. 1 <strong>2011</strong> ApS 2 S Fredericia, Denmark 100%<br />
DE POWER NR. 2 <strong>2011</strong> ApS 2 S Fredericia, Denmark 100%<br />
<strong>DONG</strong> <strong>Energy</strong> Holding Ludwigsau I GmbH S Hamburg, Germany 100%<br />
<strong>DONG</strong> <strong>Energy</strong> Holding Ludwigsau II GmbH S Hamburg, Germany 100%<br />
<strong>DONG</strong> <strong>Energy</strong> Kraftwerke Emden GmbH i. L. S Hamburg, Germany 100%<br />
<strong>DONG</strong> <strong>Energy</strong> Kraftwerke Greifswald Beteiligungs-GmbH S Rubenow, Germany 100%<br />
<strong>DONG</strong> <strong>Energy</strong> Kraftwerke Greifswald Verwaltungs GmbH S Rubenow, Germany 100%<br />
<strong>DONG</strong> <strong>Energy</strong> Kraftwerke Holding GmbH S Hamburg, Germany 100%<br />
<strong>DONG</strong> <strong>Energy</strong> Power A/S S Fredericia, Denmark 100%<br />
<strong>DONG</strong> <strong>Energy</strong> Power Holding A/S S Fredericia, Denmark 100%<br />
<strong>DONG</strong> <strong>Energy</strong> Power UK I Ltd. S London, England 100%<br />
<strong>DONG</strong> <strong>Energy</strong> Humber Renewables Ltd. S London, England 100%<br />
<strong>DONG</strong> <strong>Energy</strong> Maabjerg <strong>Energy</strong> Concept A/S S Fredericia, Denmark 100%<br />
<strong>DONG</strong> <strong>Energy</strong> Power Rotterdam B.V. S Rotterdam, Netherlands 100%<br />
<strong>DONG</strong> <strong>Energy</strong> UK I Ltd. S London, England 100%<br />
<strong>DONG</strong> <strong>Energy</strong> Waste (UK) Ltd. S London, England 100%<br />
<strong>DONG</strong> Generation Norge AS S Lindås, Norway 100%<br />
Dublin Waste to <strong>Energy</strong> (Holdings) Limited A Dublin, Ireland 49%<br />
Dublin Waste to <strong>Energy</strong> Ltd. A Dublin, Ireland 49%<br />
Emineral A/S J Aalborg, Denmark 50%<br />
Enecogen V.O.F J Rotterdam, Netherlands 50%<br />
EOT ApS S Fredericia, Denmark 100%<br />
<strong>DONG</strong> ENERGY <strong>ANNUAL</strong> <strong>REPORT</strong> <strong>2011</strong> – COnsOliDatED finanCial statEmEnts<br />
147<br />
notes
notes<br />
42 Company overview<br />
Segment/company Type 1 Registered office<br />
Ownership<br />
interest<br />
Haderslev Kraftvarmeværk A/S S Fredericia, Denmark 100%<br />
Horsens Kraftvarmeværk A/S S Fredericia, Denmark 100%<br />
I/S Ensted Transithavn J Aabenraa, Denmark 50%<br />
Inbicon A/S S Fredericia, Denmark 100%<br />
Konsortiet for etablering af Maabjerg <strong>Energy</strong> Concept I/S S Holstebro, Denmark 50%<br />
Kraftwerk Ludwigsau GmbH & Co, KG S Hamburg, Germany 100%<br />
Kraftwerk Ludwigsau Verwaltungs GmbH S Hamburg, Germany 100%<br />
Måbjergværket A/S S Fredericia, Denmark 100%<br />
REnescience A/S S Fredericia, Denmark 100%<br />
Severn Gas Transportation Limited S Newport, Wales 100%<br />
Severn Power Funding Limited S Newport, Wales 100%<br />
Severn Power Holdings Limited S Newport, Wales 100%<br />
Severn Power Limited S Newport, Wales 100%<br />
SGOT ApS S Fredericia, Denmark 100%<br />
Stigsnæs Vandindvinding I/S NC Slagelse, Denmark 69%<br />
Vejen Kraftvarmeværk A/S S Fredericia, Denmark 100%<br />
<strong>Energy</strong> markets<br />
DE EM nr. 1 2008 A/S 2 S Fredericia, Denmark 100%<br />
<strong>DONG</strong> <strong>Energy</strong> Business GmbH S Hamburg, Germany 100%<br />
<strong>DONG</strong> <strong>Energy</strong> Financial Solutions GmbH S Leipzig, Germany 100%<br />
<strong>DONG</strong> <strong>Energy</strong> Infrastruktur Holding GmbH S Hamburg, Germany 100%<br />
<strong>DONG</strong> <strong>Energy</strong> Leitung E GmbH S Hamburg, Germany 100%<br />
<strong>DONG</strong> <strong>Energy</strong> Markets B.V. S Amsterdam, Netherlands 100%<br />
<strong>DONG</strong> <strong>Energy</strong> Markets GmbH S Dorsten, Germany 100%<br />
<strong>DONG</strong> <strong>Energy</strong> Pipelines A/S S Fredericia, Denmark 100%<br />
<strong>DONG</strong> <strong>Energy</strong> Pipelines GmbH S Kiel, Germany 100%<br />
<strong>DONG</strong> <strong>Energy</strong> Speicher E GmbH S Hamburg, Germany 100%<br />
<strong>DONG</strong> <strong>Energy</strong> Speicher R GmbH S Kiel, Germany 100%<br />
<strong>DONG</strong> Naturgas A/S S Fredericia, Denmark 100%<br />
Etzel Kavernenbetriebsverwaltungsgesellschaft mbH A Hamburg, Germany 33%<br />
Etzel Kavernenbetriebsgesellschaft mbH & Co. KG A Hamburg, Germany 33%<br />
Gaspool Balancing Service GmbH A Berlin, Germany 25%<br />
Kielspeicher 103 GmbH & Co. KG J Kiel, Germany 49%<br />
Kielspeicher 103 Verwaltungs-GmbH J Kiel, Germany 49%<br />
sales & Distribution<br />
Dansk Gasteknisk Center A/S A Rudersdal, Denmark 36%<br />
DE 2008 A/S i likvidation (in liquidation) S Fredericia, Denmark 100%<br />
DE S&D nr. 2 2008 A/S 2 S Fredericia, Denmark 100%<br />
<strong>DONG</strong> <strong>Energy</strong> Aktiebolag S Gothenburg, Sweden 100%<br />
<strong>DONG</strong> <strong>Energy</strong> City Drift ApS i likvidation (in liquidation) S Fredericia, Denmark 100%<br />
148 COnsOliDatED finanCial statEmEnts – <strong>DONG</strong> ENERGY <strong>ANNUAL</strong> <strong>REPORT</strong> <strong>2011</strong>
Segment/company Type 1 Registered office<br />
Ownership<br />
interest<br />
<strong>DONG</strong> <strong>Energy</strong> El & Gas A/S S Fredericia, Denmark 100%<br />
<strong>DONG</strong> <strong>Energy</strong> Eldistribution A/S S Frederica, Denmark 100%<br />
<strong>DONG</strong> <strong>Energy</strong> Gasforsyning A/S S Fredericia, Denmark 100%<br />
<strong>DONG</strong> <strong>Energy</strong> Kabler A/S S Fredericia, Denmark 100%<br />
<strong>DONG</strong> <strong>Energy</strong> Sales B.V. S Hertogenbosch, Netherlands 100%<br />
<strong>DONG</strong> <strong>Energy</strong> Sales UK Limited S London, England 100%<br />
<strong>DONG</strong> <strong>Energy</strong> Sales & Distribution A/S S Fredericia, Denmark 100%<br />
<strong>DONG</strong> <strong>Energy</strong> Service 1 A/S S Fredericia, Denmark 100%<br />
<strong>DONG</strong> <strong>Energy</strong> Service 2 A/S S Fredericia, Denmark 100%<br />
<strong>DONG</strong> Gas Distribution A/S S Fredericia, Denmark 100%<br />
<strong>DONG</strong> Oil Pipe A/S S Fredericia, Denmark 100%<br />
<strong>DONG</strong> Storage A/S S Fredericia, Denmark 100%<br />
<strong>DONG</strong> Sweden Distribution AB S Gothenburg, Sweden 100%<br />
FordonsGas Sweden AB A Gothenburg, Sweden 50%<br />
Frederiksberg Energiservice A/S S Fredericia, Denmark 100%<br />
PowerSense A/S A Rudersdal, Denmark 42%<br />
Regionalnetz Ostholstein Süd GmbH & Co. KG A Lübeck, Germany 25%<br />
Stadtwerke Lübeck GmbH A Lübeck, Germany 25%<br />
Stadtwerke Lübeck Netz GmbH A Lübeck, Germany 25%<br />
Other<br />
DE nr.1 2003 A/S2 S Fredericia, Denmark 100%<br />
<strong>DONG</strong> EGJ A/S S Fredericia, Denmark 100%<br />
<strong>DONG</strong> El A/S S Fredericia, Denmark 100%<br />
<strong>DONG</strong> <strong>Energy</strong> IT Polska Sp. z o. o. S Warsaw, Poland 100%<br />
<strong>DONG</strong> <strong>Energy</strong> Oil & Gas A/S S Fredericia, Denmark 100%<br />
<strong>DONG</strong> <strong>Energy</strong> Vangede A/S S Fredericia, Denmark 100%<br />
<strong>DONG</strong> Insurance A/S S Fredericia, Denmark 100%<br />
EM El Holding A/S S Fredericia, Denmark 100%<br />
EnergiGruppen Jylland El A/S S Fredericia, Denmark 100%<br />
EnergiGruppen Jylland El Holding A/S S Fredericia, Denmark 100%<br />
EnergiGruppen Jylland F&B A/S i likvidation (in liquidation)<br />
EnergiGruppen Jylland Forbrænding A/S i likvidation<br />
S Fredericia, Denmark 66%<br />
(in liquidation) NC Fredericia, Denmark 66%<br />
Lithium Balance A/S A Ishøj, Denmark 20%<br />
1 S = subsidiary, A = associate, J = jointly controlled entity, NC = non-consolidated enterprise.<br />
2 The company applies the provision in section 6 of the Danish Financial Statements Act to omit presenting a separate annual<br />
report.<br />
The company overview above shows the <strong>DONG</strong> <strong>Energy</strong> Group’s<br />
ultimate ownership interest in each enterprise, regardless of<br />
whether it is held directly or indirectly.<br />
<strong>DONG</strong> ENERGY <strong>ANNUAL</strong> <strong>REPORT</strong> <strong>2011</strong> – COnsOliDatED finanCial statEmEnts<br />
149<br />
notes
consolIdated NON-FINANCIAL STATEMENTS<br />
150 COnsOliDatED nOn-finanCial statEmEnts – <strong>DONG</strong> ENERGY <strong>ANNUAL</strong> <strong>REPORT</strong> <strong>2011</strong>
<strong>DONG</strong> ENERGY <strong>ANNUAL</strong> <strong>REPORT</strong> <strong>2011</strong> – COnsOliDatED nOn-finanCial statEmEnts<br />
151
consolIdated NON-FINANCIAL STATEMENTS<br />
Accounting policies for non-financial data<br />
General<br />
The overview of non-financial highlights for the reporting<br />
period 1 January – 31 December <strong>2011</strong> on page 6 of this<br />
report and in <strong>DONG</strong> <strong>Energy</strong>’s Group annual report and the<br />
financial review for <strong>2011</strong> on pages 35-39 of this report and<br />
in <strong>DONG</strong> <strong>Energy</strong>’s Group annual report include data from<br />
the whole of the <strong>DONG</strong> <strong>Energy</strong> Group.<br />
<strong>DONG</strong> <strong>Energy</strong>’s non-financial reporting is audited externally.<br />
Reference is made to the assurance statement on<br />
page 186 of this report and page 125 of <strong>DONG</strong> <strong>Energy</strong>’s<br />
Group annual report.<br />
The collection and determination of non-financial data<br />
comprise data relating to production, environment, health<br />
and safety and employees, applying the same delimitations<br />
and basis as for the financial data, except as otherwise<br />
described in the following sections. In practice, this means<br />
that the reporting comprises all operative operating activities<br />
in <strong>DONG</strong> <strong>Energy</strong> and the Group’s subsidiaries and<br />
jointly controlled entities.<br />
reporting and materiality criteria<br />
Management’s reasons for choosing the environmental<br />
data that are included in this report are based on the<br />
evaluations in 2007 of the business areas’ environmental<br />
impacts, the subsequently set corporate targets and the<br />
underlying key performance indicators (KPIs) identified<br />
for one or more of the business areas. Within occupational<br />
health and safety, occupational injuries and injury<br />
frequency have been chosen as the key parameters based<br />
on a management evaluation. The same applies to the employee<br />
data chosen.<br />
standards applied<br />
<strong>DONG</strong> <strong>Energy</strong> is a signatory to the UN Global Compact<br />
and prepares an annual ”Communication on Progress”<br />
report to the UN. <strong>DONG</strong> <strong>Energy</strong>’s ”Communication on<br />
Progress <strong>2011</strong>” can be found at dongenergy.com and<br />
Global Compact’s website at unglobalcompact.org/COP.<br />
<strong>DONG</strong> <strong>Energy</strong> reports annually in accordance with the<br />
Global Reporting Initiative’s (GRI) Reporting Guidelines<br />
G3.0. <strong>DONG</strong> <strong>Energy</strong> also reports in accordance with the<br />
GRI’s sector supplement for electricity producers and electricity<br />
distributors, called EUSS (Electric Utilities Sector<br />
Supplement). The reporting is in accordance with application<br />
level B+.<br />
152 COnsOliDatED nOn-finanCial statEmEnts – <strong>DONG</strong> ENERGY <strong>ANNUAL</strong> <strong>REPORT</strong> <strong>2011</strong><br />
<strong>DONG</strong> <strong>Energy</strong> has carried out an assessment of materiality<br />
of the GRI indicators based on the methodology proposed<br />
by the GRI. The methodology in its entirety has not been<br />
changed in the period 2008–<strong>2011</strong>, and appears in <strong>DONG</strong><br />
<strong>Energy</strong>’s GRI report, which can be found at www.dongenergy.com.<br />
Organisation and data quality<br />
The business areas’ reporting has been systematised and<br />
harmonised via a common reporting system that forms<br />
the basis for the consolidated reporting. The business<br />
areas are responsible for the quality of their data based on<br />
a reporting procedure designed to support a Group-wide<br />
harmonised approach to data quality. The procedure also<br />
ensures that data in the consolidated reporting can be<br />
reproduced in accordance with the stated methods for recognition<br />
and measurement and for determination of data<br />
described below. Data have been recognised in the consolidated<br />
reporting based on the data reported by the business<br />
areas and following an accounting technical analysis<br />
at Group level.<br />
additions and disposals during the year<br />
If an activity has not been owned for the entire reporting<br />
period, it is, in principle, recognised from the date on which<br />
operation began, the acquisition date or up to the date of<br />
transfer.<br />
For information on acquisitions and disposals of enterprises,<br />
reference is made to notes 28 and 29 on Acquisition<br />
of enterprises and Disposal of enterprises in this report or<br />
<strong>DONG</strong> <strong>Energy</strong>’s Group annual report.<br />
The capacity at Vejen CHP plant is registered with the<br />
Danish <strong>Energy</strong> Authority, but the plant capacity in question<br />
is not used in <strong>DONG</strong> <strong>Energy</strong>’s production unless<br />
Energinet.dk requests that it be brought back into service.<br />
Changes to performance summary<br />
compared with 2010<br />
Compared with 2010, there are two indicators that are no<br />
longer reported as non-financial key performance indicators.<br />
The indicators that have been deemed to no longer<br />
be material and/or are not comprised by corporate targets<br />
are the ”1 tonne less CO per employee” campaign and<br />
2<br />
”Percentage of CO -neutral fuels at power stations”.<br />
2<br />
A new indicator has been added to the non-financial key<br />
performance indicators, ”Green proportion of electricity<br />
and heat generation”.
Accounting policies for data collection<br />
The reporting of production and environmental data com-<br />
prises all operative operating activities in <strong>DONG</strong> <strong>Energy</strong><br />
and the Group’s subsidiaries and jointly controlled entities.<br />
The latter are determined based on ownership interest. The<br />
reporting does not include associates. However, special<br />
considerations apply to the key performance indicator CO2 emissions per energy unit generated (g CO /kWh), as de-<br />
2<br />
scribed in a separate section.<br />
production and sales<br />
Electricity generation has been determined as net generation<br />
sold based on settlements from the official Danish<br />
production database. Generation data for foreign and nonoperated<br />
renewable energy facilities are provided by the<br />
operators.<br />
Heat generation is measured as net output sold. Heat generation<br />
from renewable sources is measured on the basis<br />
of monthly heat withdrawals from geothermal water. The<br />
Margretheholmen geothermal plant is not recognised, as<br />
<strong>DONG</strong> <strong>Energy</strong> does not have a share in the production, but<br />
only owns the substrata in which the facility lies.<br />
For the hydroelectric station Indalselven, the ownership<br />
interest has been converted to an annual withdrawal right<br />
from the plant, and the reporting is consequently based on<br />
annual withdrawals and not on total production based on<br />
ownership interest.<br />
Natural gas and oil production is determined on the basis<br />
of meter readings on delivery to shore.<br />
Electricity sales are determined as physical electricity sales<br />
to identifiable counterparties and reported on a gross basis<br />
in the financial statements. Electricity volumes and revenue<br />
are based on readings from the trading systems.<br />
Gas sales have been determined as the physical sales recorded<br />
in the trading systems. Wholesale sales (including<br />
intragroup sales) are reported as total volume of gas sold<br />
less any possibilities for selling the gas back to <strong>Energy</strong><br />
Markets under the supply contract in question. Gas sold on<br />
gas hubs in the course of the Group’s physical sales and<br />
purchase activities and gas sold as part of physical swap<br />
contracts are reported on a net basis.<br />
Data relating to gas and electricity distribution comprise<br />
Denmark only.<br />
Electricity distribution has been determined on the basis of<br />
data from the official system in Denmark (El-Panda), where<br />
total area consumption is measured and calculated.<br />
Gas distribution has been determined on the basis of data<br />
from the official system in Denmark (Gas-Panda) that have<br />
been calculated internally based on total volumes and<br />
calorific values received from Energinet.dk.<br />
Oil transportation has been determined on the basis of<br />
flow meter readings on delivery to shore.<br />
Environment<br />
Environmental data comprise emissions and discharges,<br />
waste and environmental incidents. Construction projects<br />
and development projects and similar activities that are<br />
not part of the ordinary operations are not included in the<br />
reporting.<br />
about Exploration & production and <strong>Energy</strong> markets<br />
In the case of activities where <strong>DONG</strong> <strong>Energy</strong> is not the<br />
operator, only environmental impacts from the production<br />
activities are included, and not any impact from administrative<br />
support functions. Construction projects, exploration<br />
and drilling projects, development projects, JI/CDM<br />
projects and non-operated gas storage facilities, including<br />
the LNG terminal and similar activities that are not part of<br />
the Group’s ordinary operating activities, are not included<br />
in the reporting. Waste data are not received from fields not<br />
operated by <strong>DONG</strong> <strong>Energy</strong>.<br />
Emissions and discharges<br />
Calculations of EU ETS CO emissions are made at facili-<br />
2<br />
ties that are subject to these emissions trading schemes<br />
and for which <strong>DONG</strong> <strong>Energy</strong> is responsible in its capacity<br />
as operator or its capacity as accountable for operations,<br />
and in accordance with the methods laid down in the<br />
Danish Act on CO Emissions Allowances.<br />
2<br />
CO emissions per energy unit generated (g CO /kWh)<br />
2 2<br />
have been determined as physical CO emissions relative<br />
2<br />
to total physical generation of electricity, heat and steam<br />
supplied to the grid. For the purposes of calculating specific<br />
emissions in connection with the key performance<br />
indicator “CO emissions per energy unit generated”,<br />
2<br />
electricity, heat and steam supplies as well as CO emis-<br />
2<br />
sions from all generating installations are recognised,<br />
excluding the Exploration & Production business area,<br />
based on <strong>DONG</strong> <strong>Energy</strong>’s ownership interest. This means<br />
that directly owned associates and investments are also<br />
<strong>DONG</strong> ENERGY <strong>ANNUAL</strong> <strong>REPORT</strong> <strong>2011</strong> – COnsOliDatED nOn-finanCial statEmEnts<br />
153
consolIdated NON-FINANCIAL STATEMENTS<br />
recognised based on <strong>DONG</strong> <strong>Energy</strong>’s proportionate overall<br />
ownership interest. However, a triviality rule has been introduced,<br />
which means that facilities with a total installed<br />
electricity, heat or steam capacity of less than 10 MW are<br />
omitted. Mongstad power station is also included as it is<br />
owned and operated by <strong>DONG</strong> <strong>Energy</strong> (however, the plant<br />
is not consolidated financially).<br />
Specific CO emissions (g CO /kWh) are calculated by<br />
2 2<br />
converting heat and steam to electricity equivalents. The<br />
equivalent electricity supplies represent the volume of<br />
additional electricity that could have been supplied if<br />
the power stations had not been generating heat and/or<br />
steam.<br />
Waste is not recognised as being a 100% CO -neutral fuel:<br />
2<br />
a conversion factor of 35 kg CO /GJ from incinerated waste<br />
2<br />
to CO emissions is applied. Biomass, biogas, landfill gas<br />
2<br />
and livestock manure are recognised as CO -neutral.<br />
2<br />
Emission and production data are collected applying the<br />
normal quality criteria, with the exception of data from associates,<br />
where a lower quality level is accepted. Data from<br />
the associate Stadtwerke Lübeck GmbH have not been<br />
recognised, as no data were available.<br />
Power station nitrogen oxide (NOx) and sulphur dioxide<br />
(SO2) emissions are mainly determined based on continuous<br />
measurement. A few power stations use plant-specific<br />
emission factors to calculate emissions. Specific emissions<br />
are determined as physical NOx/SO2 emissions from<br />
power stations relative to their total physical production of<br />
electricity, heat and steam supplied to the grid.<br />
Specific emissions (g NOx/SOx per kWh) are calculated<br />
by converting heat and steam to electricity equivalents.<br />
The equivalent electricity supplies represent the volume<br />
of additional electricity that could have been supplied if<br />
the power stations had not been generating heat and/or<br />
steam.<br />
Flaring of natural gas at offshore installations is determined<br />
using ultrasonic measurements. Volumes for the gas<br />
storage facility are calculated based on pressure and the<br />
dimension of the emptied process plant.<br />
154 COnsOliDatED nOn-finanCial statEmEnts – <strong>DONG</strong> ENERGY <strong>ANNUAL</strong> <strong>REPORT</strong> <strong>2011</strong><br />
Oil discharged to sea from production platforms is determined<br />
on the basis of extracted and reinjected volume,<br />
including measurements of content (oil and water). Oil<br />
discharged with produced water is calculated on the basis<br />
of three daily samples that are analysed for oil content and<br />
one sample every 24 hours based on ballast water.<br />
Reinjection of produced water at production platforms is<br />
determined based on pump capacity, pressure and time.<br />
Green proportion of electricity and heat generation<br />
The green proportion of electricity and heat generation is<br />
measured as generation from renewable energy, including<br />
generation from biomass and waste at power stations. In<br />
that connection, half of the electricity and heat generated<br />
from waste is recognised as green, while the other<br />
half is recognised as fossil. The proportion of generation<br />
from power stations that is based on biomass and waste<br />
is calculated as the ratio of the energy content of the fuels<br />
concerned to the total energy content of the fuels used at<br />
each plant. To allow a compilation of generation at power<br />
stations that generate both electricity and heat, and for the<br />
Group as a whole, heat generation is converted to equivalent<br />
electricity generation, i.e. the electricity that could<br />
have been generated if the power station(s) had not been<br />
generating heat. The same delimitation is used for measuring<br />
the green proportion of electricity and heat generation<br />
as is used or measuring g CO /kWh. 2<br />
recycling of waste<br />
Waste and recycling of same are measured on the basis of<br />
invoices received from waste recipients and/or using plantspecific<br />
measuring methods for production facilities.<br />
Waste from buildings that accommodate one per cent<br />
or less of the total number of employees is not reported.<br />
Waste from the construction of office buildings is not recognised,<br />
as the contractor disposes of waste as part of the<br />
design-build contract.<br />
For offshore installations and power stations, the reporting<br />
includes drilling projects and projects at existing installations,<br />
as waste data from projects form part of the plants’<br />
overall waste data.
significant environmental incidents<br />
The impact and materiality of environmental incidents are<br />
evaluated on the basis of a corporate procedure for impact<br />
analysis in connection with environmental incidents. An<br />
environmental incident is an adverse event that has a<br />
negative environmental impact. Only incidents with an<br />
actual environmental impact are reported. Incidents are<br />
only determined for <strong>DONG</strong> <strong>Energy</strong>-operated facilities and<br />
operating activities. Incidents have not been determined<br />
for facilities not operated by <strong>DONG</strong> <strong>Energy</strong> or for projects.<br />
labour<br />
Labour comprises employee data and safety data in the<br />
form of occupational injuries.<br />
Employees<br />
Employees working under contract in Danish and foreign<br />
<strong>DONG</strong> <strong>Energy</strong> companies are included in the reporting, but<br />
not employees of associates. Employee data are recognised<br />
based on records from the Group’s ordinary registration<br />
systems. The number of employees, including by gender<br />
and country, is determined as the number of employees at<br />
the end of the financial year converted to full-time equivalents<br />
(FTE).<br />
Employee turnover is calculated as the number of employees<br />
that have left the company relative to the average<br />
number of employees at the end of the financial year. The<br />
average number of employees is determined as a weighted<br />
average of recorded employees during the year.<br />
Average age has been measured as the average age of employees<br />
at the end of the financial year.<br />
Occupational injuries<br />
Occupational injuries and lost time injuries for own employees<br />
and suppliers are included for companies that are<br />
wholly or partly owned by <strong>DONG</strong> <strong>Energy</strong> and where <strong>DONG</strong><br />
<strong>Energy</strong> is directly responsible for safety. <strong>Energy</strong> Markets<br />
only reports data for its own employees.<br />
Data are recognised for own employees and for suppliers<br />
working in or providing services in areas in which <strong>DONG</strong><br />
<strong>Energy</strong> is directly responsible for safety in its capacity of<br />
operator or because of the operating assignment. Data<br />
from Danish and some foreign sites are recognised. The<br />
criteria for the recognition of suppliers vary for the individual<br />
business areas and over time.<br />
An occupational injury is defined as an injury that results<br />
in incapacity for work of one or more calendar days in addition<br />
to the day of the incident. Fatalities are included.<br />
The injury frequency is calculated as the injury frequency<br />
per one million hours worked. Working hours are based<br />
on 1,667 working hours annually per full time equivalent<br />
(FTE) and monthly records of the number of employees<br />
converted to FTE. For suppliers the actual number of hours<br />
worked is recognised on the basis of data provided by the<br />
supplier, access control systems at locations or estimates.<br />
The injury frequency, and the development of the injury<br />
frequency, is subject to some uncertainty as a result of the<br />
data basis for hours worked and varying criteria for recognition<br />
of suppliers.<br />
<strong>DONG</strong> ENERGY <strong>ANNUAL</strong> <strong>REPORT</strong> <strong>2011</strong> – COnsOliDatED nOn-finanCial statEmEnts<br />
155
PaRent coMPany<br />
FINANCIAL STATEMENTS<br />
IndeX of notes<br />
notes<br />
1 Basis of reporting 165<br />
2 Critical accounting estimates and judgements 166<br />
notes to the statement of comprehensive income<br />
3 Revenue 166<br />
4 Staff costs<br />
5 Fee to auditor appointed at the<br />
167<br />
Annual General Meeting 168<br />
6 Finance income 169<br />
7 Finance costs 169<br />
8 Income tax expense 170<br />
notes to the balance sheet<br />
9 Property, plant and equipment 171<br />
10 Subsidiaries and other securities 172<br />
156 parEnt COmpany finanCial statEmEnts – <strong>DONG</strong> ENERGY <strong>ANNUAL</strong> <strong>REPORT</strong> <strong>2011</strong><br />
11 Receivables 172<br />
12 Equity 173<br />
13 Deferred tax 173<br />
14 Loans and borrowings 175<br />
15 Income tax receivable and payable 175<br />
notes to the statement of cash flows<br />
16 Disposal of enterprises 176<br />
17 Cash and cash equivalents and securities 176<br />
notes without reference<br />
18 Financial risks 177<br />
19 Financial instruments 179<br />
20 Leasing 182<br />
21 Contingent assets and liabilities 182<br />
22 Related party transactions 183<br />
23 Company overview 184
fInancIal stateMents <strong>2011</strong><br />
PARENT COMPANY <strong>DONG</strong> ENERGY A/S<br />
CVR No. 36213728<br />
The financial statements of the parent company, <strong>DONG</strong> <strong>Energy</strong> A/S,<br />
form an integral part of the overall annual report of <strong>DONG</strong> <strong>Energy</strong>.<br />
Parts of the parent company financial statements appear from the<br />
preceding part of the annual report only. These parts are:<br />
Management’s review and the parts of the accounting policies and<br />
notes that are identical to the corresponding parts of the consolidated<br />
financial statements.<br />
<strong>DONG</strong> ENERGY <strong>ANNUAL</strong> <strong>REPORT</strong> <strong>2011</strong> – parEnt COmpany finanCial statEmEnts<br />
157
PaRent coMPany STATEMENT OF COMPREHENSIVE INCOME<br />
Year ended 31 December<br />
DKK million Note <strong>2011</strong> 2010<br />
Revenue 3 119 99<br />
Other external expenses 5 (276) (141)<br />
Staff costs 4 (25) (16)<br />
Operating profit (loss) before depreciation, amortisation and<br />
impairment losses (EBitDa) (182) (58)<br />
Depreciation and impairment losses on property, plant and<br />
equipment 9 (5) (5)<br />
Operating profit (loss) (EBit) (187) (63)<br />
Gain on disposal of enterprises 16 - 73<br />
Finance income 6 14,820 13,764<br />
Finance costs 7 (12,194) (11,980)<br />
profit before tax 2,439 1,794<br />
Income tax expense 8 169 10<br />
profit for the year 2,608 1,804<br />
Other comprehensive income<br />
Value adjustments for the year (732) (132)<br />
Value adjustments transferred to net finance costs 147 (1)<br />
Tax on value adjustments of hedging instruments 146 33<br />
Other comprehensive income (439) (100)<br />
total comprehensive income 2,169 1,704<br />
158 parEnt COmpany finanCial statEmEnts – <strong>DONG</strong> ENERGY <strong>ANNUAL</strong> <strong>REPORT</strong> <strong>2011</strong>
DKK million Note <strong>2011</strong> 2010<br />
profit for the year is attributable to:<br />
Equity holders of <strong>DONG</strong> <strong>Energy</strong> A/S<br />
Hybrid capital holders of <strong>DONG</strong> <strong>Energy</strong> A/S<br />
2,339 1,470<br />
(adjusted for tax effect) 269 334<br />
profit for the year 2,608 1,804<br />
Comprehensive income for the year is attributable to:<br />
Equity holders of <strong>DONG</strong> <strong>Energy</strong> A/S<br />
Hybrid capital holders of <strong>DONG</strong> <strong>Energy</strong> A/S<br />
1,900 1,370<br />
(adjusted for tax effect) 269 334<br />
total comprehensive income 2,169 1,704<br />
Proposed dividend per share of DKK 10, in DKK 4.96 7.50<br />
<strong>DONG</strong> ENERGY <strong>ANNUAL</strong> <strong>REPORT</strong> <strong>2011</strong> – parEnt COmpany finanCial statEmEnts<br />
159<br />
PaRent coMPany STATEMENT OF COMPREHENSIVE INCOME
PaRent coMPany BALANCE SHEET<br />
At 31 December<br />
assets<br />
DKK million Note <strong>2011</strong> 2010<br />
Investment property 38 42<br />
Fixtures and fittings, tools and equipment 8 9<br />
property, plant and equipment 9 46 51<br />
Investments in subsidiaries 10 25,683 25,683<br />
Receivables 11 54,977 34,143<br />
Other non-current assets 80,660 59,826<br />
non-current assets 80,706 59,877<br />
Receivables 11 16,151 27,601<br />
Income tax 15 601 211<br />
Securities 17 9,665 7,470<br />
Cash 17 4 1,506<br />
Current assets 26,421 36,788<br />
assets 107,127 96,665<br />
160 parEnt COmpany finanCial statEmEnts – <strong>DONG</strong> ENERGY <strong>ANNUAL</strong> <strong>REPORT</strong> <strong>2011</strong>
Equity and liabilities<br />
DKK million Note <strong>2011</strong> 2010<br />
Share capital 2,937 2,937<br />
Reserves 8,610 9,049<br />
Retained earnings 21,513 20,756<br />
Proposed dividends 1,457 2,203<br />
Equity attributable to equity holders of DOnG <strong>Energy</strong> a/s 34,517 34,945<br />
Hybrid capital 9,538 8,088<br />
Equity 12 44,055 43,033<br />
Deferred tax 13 1,714 1,170<br />
Bond loans 14 18,961 22,833<br />
Bank loans 14 13,998 8,784<br />
non-current liabilities 34,673 32,787<br />
Bond loans 14 3,717 3,737<br />
Bank loans 14 5,490 449<br />
Other payables 14 19,192 16,659<br />
Current liabilities 28,399 20,845<br />
liabilities 63,072 53,632<br />
Equity and liabilities 107,127 96,665<br />
<strong>DONG</strong> ENERGY <strong>ANNUAL</strong> <strong>REPORT</strong> <strong>2011</strong> – parEnt COmpany finanCial statEmEnts<br />
161<br />
PaRent coMPany BALANCE SHEET
PaRent coMPany STATEMENT OF CHANGES IN EQUITY<br />
Year ended 31 December<br />
DKK million Share capital<br />
Hedging reserve<br />
Share premium<br />
Retained earnings<br />
Proposed dividends<br />
equity attributable to<br />
equity holders of<br />
dong energy a/s<br />
Equity at 1 January <strong>2011</strong> 2,937 (199) 9,248 20,756 2,203 34,945 8,088 43,033<br />
Comprehensive income for<br />
the year<br />
Profit for the year - - - 2,339 - 2,339 269 2,608<br />
Other comprehensive income<br />
Value adjustments for the year<br />
Value adjustments transferred to<br />
- (732) - - - (732) - (732)<br />
net finance costs - 147 - - - 147 - 147<br />
Tax on value adjustments of<br />
hedging instruments - 146 - - - 146 - 146<br />
total comprehensive income 0 (439) 0 2,339 0 1,900 269 2,169<br />
transactions with owners<br />
Coupon payments,<br />
hybrid capital - - - - - 0 (515) (515)<br />
Tax hybrid capital - - - - - 0 246 246<br />
Additions hybrid capital - - - - - 0 5,127 5,127<br />
Disposals hybrid capital - - - - - 0 (3,802) (3,802)<br />
Adjustments amortisation<br />
original hybrid capital - - - (125) - (125) 125 0<br />
Proposed dividends - - - (1,457) 1,457 0 - 0<br />
Dividends paid - - - - (2,203) (2,203) - (2,203)<br />
total changes in equity<br />
in <strong>2011</strong> 0 (439) 0 757 (746) (428) 1,450 1,022<br />
Equity<br />
at 31 December <strong>2011</strong> 2,937 (638) 9,248 21,513 1,457 34,517 9,538 44,055<br />
162 parEnt COmpany finanCial statEmEnts – <strong>DONG</strong> ENERGY <strong>ANNUAL</strong> <strong>REPORT</strong> <strong>2011</strong><br />
Hybrid capital<br />
total
DKK million Share capital<br />
Hedging reserve<br />
Share premium<br />
Retained earnings<br />
Proposed dividends<br />
Equity attributable<br />
to equity holders of<br />
DOnG <strong>Energy</strong> a/s<br />
Equity at 1 January 2010 2,937 (99) 9,248 21,489 481 34,056 8,088 42,144<br />
Comprehensive income for<br />
the year<br />
Profit for the year - - - 1,470 - 1,470 334 1,804<br />
Other comprehensive income<br />
Value adjustments for the year<br />
Value adjustments transferred to<br />
- (132) - - - (132) - (132)<br />
net finance costs - (1) - - - (1) - (1)<br />
Tax on value adjustments of<br />
hedging instruments - 33 - - - 33 - 33<br />
total comprehensive income 0 (100) 0 1,470 0 1,370 334 1,704<br />
transactions with owners<br />
Coupon payments,<br />
hybrid capital - - - - - 0 (451) (451)<br />
Tax hybrid capital - - - - - 0 117 117<br />
Proposed dividends - - - (2,203) 2,203 0 - 0<br />
Dividends paid - - - - (481) (481) - (481)<br />
total changes in equity<br />
in 2010 0 (100) 0 (733) 1,722 889 0 889<br />
Equity<br />
at 31 December 2010 2,937 (199) 9,248 20,756 2,203 34,945 8,088 43,033<br />
<strong>DONG</strong> ENERGY <strong>ANNUAL</strong> <strong>REPORT</strong> <strong>2011</strong> – parEnt COmpany finanCial statEmEnts<br />
Hybrid capital<br />
total<br />
163<br />
PaRent coMPany STATEMENT OF CHANGES IN EQUITY
PaRent coMPany STATEMENT OF CASH FLOWS<br />
Year ended 31 December<br />
DKK million <strong>2011</strong> 2010<br />
Operating profit (loss) before depreciation, amortisation and<br />
impairment losses (EBITDA) (182) (58)<br />
Other adjustments 1,010 205<br />
Interest income and similar items 11,056 11,980<br />
Interest expense and similar items (11,215) (11,756)<br />
Income tax paid 15 715 317<br />
Cash flows from operating activities before change in<br />
net working capital (ffO) 1,384 688<br />
Change in trade receivables (4) (69)<br />
Change in other receivables 183 (76)<br />
Change in trade payables 77 (397)<br />
Change in other payables (198) 191<br />
Change in net working capital 58 (351)<br />
Cash flows from operating activities 1,442 337<br />
Disposal of enterprises 16 - 471<br />
Financial transactions with subsidiaries (7,033) (5,360)<br />
Financial transactions with jointly controlled entities (328) -<br />
Purchase of securities (8,124) (6,199)<br />
Sale of securities 6,160 2,426<br />
Other investments (105) (5)<br />
Dividends received 3,113 1,703<br />
Cash flows from investing activities (6,317) (6,964)<br />
Proceeds from raising of loans 8,985 10,522<br />
Instalments on loans (6,426) (3,856)<br />
Coupon payments on hybrid capital (515) (451)<br />
Repurchase of hybrid capital (3,802) -<br />
Proceeds from issuing of hybrid capital 5,127 -<br />
Dividends paid (2,203) (481)<br />
Receivables from Group business partner (1,713) -<br />
Cash flows from financing activities (547) 5,734<br />
net increase (decrease) in cash and cash equivalents (5,422) (893)<br />
Cash and cash equivalents at 1 January 1,506 2,399<br />
Net increase (decrease) in cash and cash equivalents (5,422) (893)<br />
Cash and cash equivalents at 31 December 17 (3,916) 1,506<br />
164 parEnt COmpany finanCial statEmEnts – <strong>DONG</strong> ENERGY <strong>ANNUAL</strong> <strong>REPORT</strong> <strong>2011</strong>
01 Basis of reporting<br />
The parent company financial statements are prepared pursuant<br />
to the requirements in the Danish Financial Statements<br />
Act concerning preparation of separate parent company financial<br />
statements for companies applying IFRS.<br />
The parent company financial statements have been prepared<br />
in accordance with International Financial Reporting<br />
Standards (IFRSs) as adopted by the EU and also comply with<br />
International Financial Reporting Standards issued by the<br />
IASB.<br />
The annual report has been prepared in accordance with<br />
Danish disclosure requirements for annual reports of listed<br />
and State-owned public limited companies, see the statutory<br />
order on adoption of IFRS issued pursuant to the Danish<br />
Financial Statements Act.<br />
The annual report is presented in Danish kroner (DKK), rounded<br />
to the nearest million, unless otherwise stated.<br />
Implementation of new standards<br />
and interpretations<br />
Reference is made to the description in note 1 to the consolidated<br />
financial statements.<br />
Description of accounting policies<br />
Changed presentation<br />
<strong>DONG</strong> <strong>Energy</strong> A/S has changed the presentation of its statement<br />
of comprehensive income so that it is now classified by<br />
nature instead of function, which means that EBITDA features<br />
directly in the statement of comprehensive income. This ensures<br />
better coherence with Management’s review, in which<br />
EBITDA is used as one of the Group’s most important performance<br />
measures.<br />
Changed presentation of income statement, 2010<br />
DKK million<br />
Classified by function<br />
Revenue 99<br />
Production costs (96)<br />
Gross profit 3<br />
Management and administration (66)<br />
Operating profit (loss) (EBit) (63)<br />
DKK million<br />
Classified by nature<br />
Revenue 99<br />
Other external expenses (141)<br />
Staff costs (16)<br />
Operating profit (loss) before depreciation,<br />
amortisation and impairment losses<br />
(EBitDa) (58)<br />
Depreciation and impairment losses on<br />
property, plant and equipment (5)<br />
Operating profit (loss) (EBit) (63)<br />
The parent company’s accounting policies deviate from the<br />
accounting policies described for the consolidated financial<br />
statements, see note 40 in the complete annual report, on the<br />
following points:<br />
foreign currency translation<br />
Foreign exchange adjustments of balances accounted for as<br />
part of the total net investment in enterprises that have a<br />
functional currency other than DKK are recognised in profit for<br />
the year as finance income and costs in the parent company<br />
financial statements. Likewise, foreign exchange gains and<br />
losses on the portion of loans and derivative financial instruments<br />
that has been entered into to hedge the net investment<br />
in these enterprises are recognised directly in profit for the<br />
year as finance income and costs.<br />
revenue<br />
Rental income comprises income from commercial leases and<br />
is recognised over the term of the lease. Income from services<br />
is recognised when delivery has taken place.<br />
<strong>DONG</strong> ENERGY <strong>ANNUAL</strong> <strong>REPORT</strong> <strong>2011</strong> – parEnt COmpany finanCial statEmEnts<br />
165<br />
notes
notes<br />
01 Basis of reporting<br />
Dividends from investments in subsidiaries<br />
Dividends from investments in subsidiaries are credited<br />
to profit for the year in the financial year in which they are<br />
declared.<br />
property, plant and equipment<br />
Investment property is property that is held to earn rental<br />
income and is used for own purposes to an insignificant extent<br />
only.<br />
Investment property is measured at cost less accumulated<br />
02 Critical accounting estimates and judgements<br />
In the process of preparing the parent company financial<br />
statements, management makes a number of estimates<br />
and judgements that affect the value of recognised assets<br />
and liabilities at the balance sheet date, the value of recognised<br />
income and expenses in the reporting period and<br />
disclosures on contingent assets and contingent liabilities<br />
at the balance sheet date.<br />
estimation uncertainties<br />
Estimates made are based on historical experience and<br />
other factors that are believed by management to be<br />
reasonable under the circumstances, but that, by their<br />
nature, are uncertain and unpredictable. The effect of such<br />
estimates and judgements may lead to results that differ<br />
significantly from those that would result from the use of<br />
other judgements and assumptions.<br />
Estimates and judgements relating to impairment testing<br />
of subsidiaries that are affected by the value in use<br />
03 Revenue<br />
depreciation and impairment losses. Investment property is<br />
depreciated over 20 years.<br />
Fixtures and fittings, tools and equipment are depreciated over<br />
3-5 years.<br />
investments in subsidiaries<br />
Investments in subsidiaries are measured at cost in the parent<br />
company financial statements. Impairment testing is carried<br />
out if there is any indication of impairment. Cost is written<br />
down to recoverable amount whenever the cost exceeds the<br />
recoverable amount.<br />
of property, plant and equipment, had a material effect<br />
on the parent company financial statements for <strong>2011</strong>.<br />
Reference is made to the section on impairment testing<br />
in note 2 to the consolidated financial statements. Other<br />
areas that were affected by estimates and judgments were<br />
primarily the valuation of receivables, onerous contracts,<br />
other provisions and contingent assets and liabilities. For<br />
information on these areas, reference is made to note 2 to<br />
the consolidated financial statements.<br />
Judgements in connection with accounting policies<br />
As part of the parent company’s accounting policies, management<br />
makes judgements, apart from those involving<br />
estimations, that may have a significant effect on the parent<br />
company financial statements. These judgments are<br />
the methods of accounting for derivative financial instruments<br />
and hybrid capital. Reference is made to note 2 to<br />
the consolidated financial statements.<br />
DKK million <strong>2011</strong> 2010<br />
Rental income and sales of services 119 99<br />
revenue 119 99<br />
166 parEnt COmpany finanCial statEmEnts – <strong>DONG</strong> ENERGY <strong>ANNUAL</strong> <strong>REPORT</strong> <strong>2011</strong>
04 Staff costs<br />
DKK million <strong>2011</strong> 2010<br />
Wages, salaries and remuneration (24) (16)<br />
Pensions (1) -<br />
staff costs (25) (16)<br />
<strong>DONG</strong> <strong>Energy</strong> A/S had an average of seven employees in <strong>2011</strong><br />
(2010: seven employees).<br />
remuneration of Board of Directors and Executive Board in <strong>2011</strong><br />
DKK ‘000 Salaries Bonus Pension total<br />
parent company Board of Directors:<br />
Chairman (500) - - (500)<br />
Deputy Chairman (300) - - (300)<br />
Other members1 (1,838) - - (1,838)<br />
audit and risk Committee:<br />
Chairman (100) - - (100)<br />
Other members2 (138) - - (138)<br />
remuneration Committee:<br />
Chairman (50) - - (50)<br />
Other member (44) - - (44)<br />
parent company Executive Board:<br />
CEO (5,006) (1,084) (2) (6,092)<br />
CFO (4,565) (1,141) (2) (5,708)<br />
remuneration (12,541) (2,225) (4) (14,770)<br />
1 Annual remuneration was DKK 175 thousand per member in <strong>2011</strong>.<br />
2 Annual remuneration was DKK 50 thousand per member in <strong>2011</strong>.<br />
A bonus plan has been established for the Executive Board.<br />
The service contract of the CEO includes a termination package<br />
under which he will be entitled to salary equivalent to<br />
33½ months’ salary, including pension, if his service contract<br />
is terminated by the company (2010: 33½ months) consisting<br />
of salary during the notice period (12 months) and termination<br />
benefit (21½ months).<br />
The CFO will be entitled to 24 months’ salary, including pension,<br />
if his contract of service is terminated by the company<br />
(2010: 24 months) consisting of salary during the notice period<br />
(12 months) and termination benefit (12 months).<br />
<strong>DONG</strong> ENERGY <strong>ANNUAL</strong> <strong>REPORT</strong> <strong>2011</strong> – parEnt COmpany finanCial statEmEnts<br />
167<br />
notes
notes<br />
04 Staff costs<br />
remuneration of Board of Directors and Executive Board in 2010<br />
DKK ‘000 Salaries Bonus Pension total<br />
parent company Board of Directors:<br />
Chairman (500) - - (500)<br />
Deputy Chairman (300) - - (300)<br />
Otther members1 (1,706) - - (1,706)<br />
audit and risk Committee:<br />
Chairman (100) - - (100)<br />
Other members2 (100) - - (100)<br />
remuneration Committee:<br />
Chairman (50) - - (50)<br />
Other member (25) - - (25)<br />
parent company Executive Board:<br />
CEO (4,822) (827) (2) (5,651)<br />
CFO (4,399) (1,198) (2) (5,599)<br />
remuneration (12,002) (2,025) (4) (14,031)<br />
1 Annual remuneration was DKK 175 thousand per member in 2010.<br />
2 Annual remuneration was DKK 50 thousand per member in 2010.<br />
05 Fee to auditor appointed at the Annual General Meeting<br />
DKK million <strong>2011</strong> 2010<br />
Audit fees (1) (1)<br />
Non-audit fees (4) -<br />
total fees to pricewaterhouseCoopers (5) (1)<br />
168 parEnt COmpany finanCial statEmEnts – <strong>DONG</strong> ENERGY <strong>ANNUAL</strong> <strong>REPORT</strong> <strong>2011</strong>
06 Finance income<br />
DKK million <strong>2011</strong> 2010<br />
Interest income from cash, etc. 284 159<br />
Interest income from subsidiaries 1,731 1,499<br />
Interest income and capital gains from securities at fair value 508 365<br />
Foreign exchange gains 2,381 3,071<br />
Value adjustments of derivative financial instruments 6,793 6,946<br />
Dividends received 3,113 1,703<br />
Miscellaneous finance income 10 21<br />
finance income 14,820 13,764<br />
07 Finance costs<br />
DKK million <strong>2011</strong> 2010<br />
Interest expense relating to payables (1,548) (1,753)<br />
Interest expense to subsidiaries (130) (76)<br />
Capital losses on securities at fair value (19) (69)<br />
Foreign exchange losses (2,042) (2,199)<br />
Value adjustments of derivative financial instruments (8,455) (7,883)<br />
finance costs (12,194) (11,980)<br />
Foreign exchange adjustments of DKK 339 million have been<br />
recognised in profit for the year (2010: DKK 872 million).<br />
<strong>DONG</strong> ENERGY <strong>ANNUAL</strong> <strong>REPORT</strong> <strong>2011</strong> – parEnt COmpany finanCial statEmEnts<br />
169<br />
notes
notes<br />
08 Income tax expense<br />
DKK million <strong>2011</strong> 2010<br />
Income tax expense 169 10<br />
Tax on other comprehensive income 146 33<br />
tax for the year 315 43<br />
income tax expense can be broken down as follows:<br />
Current tax 134 7<br />
Deferred tax 34 (1)<br />
Adjustments to current tax in respect of prior years 579 115<br />
Adjustments to deferred tax in respect of prior years (578) (111)<br />
income tax expense 169 10<br />
<strong>2011</strong> DKK million %<br />
income tax expense can be explained as follows:<br />
Calculated 25% tax on profit before tax<br />
tax effect of:<br />
(610) (25)<br />
Non-taxable income 778 32<br />
Non-deductible expenses (1) -<br />
Adjustments to tax in respect of prior years 2 -<br />
Effective tax for the year 169 7<br />
2010 DKK million %<br />
income tax expense can be explained as follows:<br />
Calculated 25% tax on profit before tax<br />
tax effect of:<br />
(449) (25)<br />
Non-taxable income 457 25<br />
Non-deductible expenses (2) -<br />
Adjustments to tax in respect of prior years 4 -<br />
Effective tax for the year 10 0<br />
170 parEnt COmpany finanCial statEmEnts – <strong>DONG</strong> ENERGY <strong>ANNUAL</strong> <strong>REPORT</strong> <strong>2011</strong>
09 Property, plant and equipment<br />
DKK million Investment<br />
property<br />
Fixtures and<br />
fittings, tools and<br />
equipment<br />
Property, plant<br />
and equipment under<br />
construction<br />
Cost at 1 January <strong>2011</strong> 88 11 - 99<br />
Cost at 31 December <strong>2011</strong> 88 11 0 99<br />
Depreciation at 1 January <strong>2011</strong> (46) (2) - (48)<br />
Depreciation charge (4) (1) - (5)<br />
Depreciation at 31 December <strong>2011</strong> (50) (3) 0 (53)<br />
Carrying amount at 31 December <strong>2011</strong> 38 8 0 46<br />
DKK million Investment<br />
property<br />
Fixtures and f<br />
ittings, tools and<br />
equipment<br />
Property, plant<br />
and equipment under<br />
construction<br />
Cost at 1 January 2010 88 10 1 99<br />
Transfers - 1 (1) 0<br />
Cost at 31 December 2010 88 11 0 99<br />
Depreciation at 1 January 2010 (42) (1) - (43)<br />
Depreciation charge (4) (1) - (5)<br />
Depreciation at 31 December 2010 (46) (2) 0 (48)<br />
Carrying amount at 31 December 2010 42 9 0 51<br />
The fair value of investment property was DKK 148 million<br />
(2010: DKK 91 million). The determination of fair value is<br />
based on a calculation of the value in use. The value in use<br />
has been determined as the present value of the expected<br />
future net cash flows from the properties. The net cash flows<br />
have been determined on the basis of budgets for the period<br />
2012-2048. A discount rate of 6.85% before tax has been used.<br />
A growth rate of 2% during the terminal period has been assumed.<br />
External valuers have not been used in connection<br />
with the determination of fair value.<br />
total<br />
total<br />
Total rental income for the year from investment property,<br />
DKK 4 million (2010: DKK 4 million) is recognised in profit<br />
for the year as revenue. Operation and maintenance costs for<br />
investment property are borne by the lessee. Investment property<br />
was let to subsidiaries throughout the year.<br />
No mortgages or other restrictions on the use of investment<br />
properties were registered at 31 December <strong>2011</strong>.<br />
<strong>DONG</strong> ENERGY <strong>ANNUAL</strong> <strong>REPORT</strong> <strong>2011</strong> – parEnt COmpany finanCial statEmEnts<br />
171<br />
notes
notes<br />
10 Subsidiaries and other securities<br />
Investments in subsidiaries Other securities<br />
DKK million <strong>2011</strong> 2010 <strong>2011</strong> 2010<br />
Cost at 1 January 25,702 25,995 - 1,173<br />
Additions - - - 130<br />
Disposals - (293) - (1,303)<br />
Cost at 31 December 25,702 25,702 0 0<br />
Value adjustments at 1 January (19) (19) - -<br />
value adjustments at 31 December (19) (19) 0 0<br />
Carrying amount at 31 December 25,683 25,683 0 0<br />
Investments in subsidiaries were tested for impairment in<br />
<strong>2011</strong>. No impairment losses have been recognised, as the recoverable<br />
amount exceeded the cost.<br />
11 Receivables<br />
<strong>DONG</strong> <strong>Energy</strong> A/S did not acquire or dispose of any enterprises<br />
in <strong>2011</strong>. In 2010, <strong>DONG</strong> <strong>Energy</strong> Frederiksberg Elnet was<br />
disposed of.<br />
For a list of subsidiaries, reference is made to note 23.<br />
DKK million <strong>2011</strong> 2010<br />
Receivables from subsidiaries 54,649 34,143<br />
Receivables from jointly controlled entities 328 -<br />
non-current receivables at 31 December 54,977 34,143<br />
Receivables from subsidiaries 8,103 21,518<br />
Fair value of derivative financial instruments, see note 19 6,274 5,877<br />
Deposits 23 13<br />
Receivables from Group trading partner 1,713 -<br />
Other receivables 38 193<br />
Current receivables at 31 December 16,151 27,601<br />
Current and non-current receivables at 31 December 71,128 61,744<br />
172 parEnt COmpany finanCial statEmEnts – <strong>DONG</strong> ENERGY <strong>ANNUAL</strong> <strong>REPORT</strong> <strong>2011</strong>
12 Equity<br />
Share capital composition and dividends are disclosed in<br />
note 22 to the consolidated financial statements.<br />
13 Deferred tax<br />
DKK million <strong>2011</strong> 2010<br />
Deferred tax at 1 January 1,170 1,058<br />
Deferred tax for the year recognised in profit for the year (34) 1<br />
Adjustments in respect of prior years 578 111<br />
Deferred tax at 31 December 1,714 1,170<br />
Deferred tax is recognised in the balance sheet as follows:<br />
Deferred tax (liabilities) 1,714 1,170<br />
Deferred tax at 31 December, net 1,714 1,170<br />
Deferred tax relates to:<br />
Property, plant and equipment 18 18<br />
Current assets (65) (10)<br />
Non-current liabilities 17 17<br />
Current liabilities 128 -<br />
Retaxation 2,548 1,701<br />
Tax loss carryforwards (932) (556)<br />
Deferred tax at 31 December 1,714 1,170<br />
<strong>DONG</strong> ENERGY <strong>ANNUAL</strong> <strong>REPORT</strong> <strong>2011</strong> – parEnt COmpany finanCial statEmEnts<br />
173<br />
notes
notes<br />
13 Deferred tax<br />
Changes in temporary differences during the year<br />
<strong>2011</strong><br />
DKK million<br />
Balance sheet<br />
at 1 January<br />
Recognised in<br />
profit for the year<br />
Balance sheet<br />
at 31 december<br />
Property, plant and equipment 18 - 18<br />
Current assets (10) (55) (65)<br />
Non-current liabilities 17 - 17<br />
Current liabilities - 128 128<br />
Retaxation 1,701 847 2,548<br />
Tax loss carryforwards (556) (376) (932)<br />
Deferred tax 1,170 544 1,714<br />
2010<br />
DKK million<br />
Balance sheet<br />
at 1 January<br />
Recognised in<br />
profit for the year<br />
Balance sheet<br />
at 31 December<br />
Property, plant and equipment 16 2 18<br />
Current assets (6) (4) (10)<br />
Non-current liabilities 14 3 17<br />
Retaxation 1,053 648 1,701<br />
Tax loss carryforwards (19) (537) (556)<br />
Deferred tax 1,058 112 1,170<br />
174 parEnt COmpany finanCial statEmEnts – <strong>DONG</strong> ENERGY <strong>ANNUAL</strong> <strong>REPORT</strong> <strong>2011</strong>
14 Loans and borrowings<br />
DKK million Current payables<br />
<strong>2011</strong> 2010<br />
non-derivative financial instruments:<br />
Bond loans 3,717 18,961 22,678 3,737 22,833 26,570<br />
Bank overdrafts 3,920 - 3,920 - - 0<br />
Other bank loans 1,570 13,998 15,568 449 8,784 9,233<br />
Trade payables 19 - 19 12 - 12<br />
Payables to subsidiaries 10,509 - 10,509 10,206 - 10,206<br />
Other payables<br />
Derivative financial instruments:<br />
622 - 622 811 - 811<br />
Fair value of derivative financial instruments 8,042 - 8,042 5,630 - 5,630<br />
loans and borrowings at 31 December 28,399 32,959 61,358 20,845 31,617 52,462<br />
The company’s financing agreements are not subject to any<br />
unusual terms or conditions, apart from those disclosed in<br />
note 25 to the consolidated financial statements.<br />
Non-current<br />
payables<br />
15 Income tax receivable and payable<br />
DKK million <strong>2011</strong> 2010<br />
Income tax receivable at 1 January 211 256<br />
Adjustments to current tax in respect of prior years 579 115<br />
Payments in respect of prior years (715) (317)<br />
Current tax for the year 134 7<br />
Current tax for the year from other comprehensive income 392 150<br />
income tax receivable at 31 December 601 211<br />
total<br />
Current payables<br />
Non-current<br />
payables<br />
<strong>DONG</strong> ENERGY <strong>ANNUAL</strong> <strong>REPORT</strong> <strong>2011</strong> – parEnt COmpany finanCial statEmEnts<br />
total<br />
175<br />
notes
notes<br />
16 Disposal of enterprises<br />
DKK million <strong>2011</strong> 2010<br />
Other non-current assets - 398<br />
Gain on disposal of enterprises - 73<br />
Cash selling price 0 471<br />
Disposal of enterprises in <strong>2011</strong><br />
No enterprises were disposed of in <strong>2011</strong>.<br />
Disposal of enterprises in 2010<br />
Disposal of enterprises in 2010 comprised the companies<br />
Swedegas AB and Frederiksberg Elnet A/S. The accounting<br />
gain on the disposal of Swedegas AB was calculated at DKK<br />
155 million, while the disposal of Frederiksberg Elnet A/S<br />
yielded an accounting loss of DKK 82 million.<br />
17 Cash and cash equivalents and securities<br />
DKK million <strong>2011</strong> 2010<br />
Available cash 4 1,506<br />
Bank overdrafts that are part of the ongoing cash management, see note 14 (3,920) -<br />
Cash and cash equivalents at 31 December, see statement of cash flows (3,916) 1,506<br />
Cash can be broken down into the following balance sheet items:<br />
Available cash 4 1,506<br />
Cash at 31 December 4 1,506<br />
securities can be broken down into the following balance sheet items:<br />
Available securities 8,129 7,470<br />
Securities not available for use 1,536 -<br />
securities at 31 December 9,665 7,470<br />
The securities are highly liquid AAA-rated Danish mortgage<br />
bonds that qualify for repos in the Danish Central Bank. Securities<br />
not available for use comprise securities that form part of<br />
176 parEnt COmpany finanCial statEmEnts – <strong>DONG</strong> ENERGY <strong>ANNUAL</strong> <strong>REPORT</strong> <strong>2011</strong><br />
genuine sale and repurchase transactions (repo transactions)<br />
amounting to DKK 1,536 million (2010: DKK 0 million).
18 Financial risks<br />
<strong>DONG</strong> <strong>Energy</strong> A/S acts as the Group’s internal banker in<br />
relation to funding, currency, interest rate and cash<br />
management and the conclusion of some commodity-related<br />
contracts, see the chapter on Risk and Risk management<br />
in Management’s review, pages 44-49.<br />
As part of its financial management, <strong>DONG</strong> <strong>Energy</strong> A/S<br />
hedges currency risks and interest rate risks. Full or partial<br />
hedging of recognised assets and liabilities (hedging<br />
Currency risks<br />
cash and<br />
DKK<br />
million Cash<br />
equivalents and<br />
receivables<br />
Payables<br />
of fair value) and of future transactions (hedging of cash<br />
flows) is carried out in accordance with the framework laid<br />
down in the financial risk policy implemented by <strong>DONG</strong><br />
<strong>Energy</strong>. Both primary financial instruments, primarily loans<br />
(only currency risks) and derivative financial instruments<br />
such as forwards, swaps and options, are used as hedges.<br />
In some cases, the company has also entered into contracts<br />
to hedge risks in subsidiaries.<br />
<strong>2011</strong> 2010<br />
Hedged using hedging<br />
instruments<br />
net position<br />
Cash and cash<br />
equivalents and<br />
receivables<br />
EUR 4,490 (30,424) 9,911 (16,023) 4,373 (28,496) 9,765 (14,358)<br />
USD 3,375 (4,790) (388) (1,803) 3,301 (4,185) 3,240 2,356<br />
GBP 20,012 (5,366) (18,439) (3,793) 12,187 (6,932) (8,946) (3,691)<br />
SEK 40 (38) (1,399) (1,397) 6 (34) (1,517) (1,545)<br />
NOK 8,007 - (3,393) 4,614 7,922 - (3,995) 3,927<br />
Other 1,012 - (1,194) (182) 1,127 - (1,265) (138)<br />
total 36,936 (40,618) (14,902) (18,584) 28,916 (39,647) (2,718) (13,449)<br />
Payables<br />
Hedged using hedging<br />
instruments<br />
<strong>DONG</strong> ENERGY <strong>ANNUAL</strong> <strong>REPORT</strong> <strong>2011</strong> – parEnt COmpany finanCial statEmEnts<br />
net position<br />
177<br />
notes
notes<br />
18 Financial risks<br />
At 31 December <strong>2011</strong>, unrealised value adjustments of derivative<br />
financial instruments for currency hedging of recognised<br />
assets and liabilities totalled DKK -775 million (31 December<br />
2010: DKK -100 million).<br />
sensitivity analysis<br />
<strong>DONG</strong> <strong>Energy</strong> A/S’s principal currency risks relate to USD,<br />
GBP, SEK and NOK. The company also calculates and manages<br />
the currency risk vis-à-vis EUR. However, as price fluctuations<br />
between DKK and EUR are small, the risk is considered<br />
to be insignificant.<br />
All other conditions being equal, a 10% increase in the USD<br />
exchange rate in relation to the exchange rate at the balance<br />
sheet date would have had a negative effect of DKK 180 million<br />
on profit and equity (2010: positive effect of DKK 236 million).<br />
All other conditions being equal, a decrease in the exchange<br />
rate would have had a corresponding opposite impact.<br />
All other conditions being equal, a 10% increase in the GBP<br />
exchange rate in relation to the exchange rate at the balance<br />
sheet date would have had a negative effect of DKK 379 million<br />
on profit and equity (2010: negative effect of DKK 369<br />
million). All other conditions being equal, a decrease in the exchange<br />
rate would have had a corresponding opposite impact.<br />
All other conditions being equal, a 10% increase in the SEK<br />
exchange rate in relation to the exchange rate at the balance<br />
sheet date would have had a negative effect of DKK 140 million<br />
on profit and equity (2010: negative effect of DKK 155 million).<br />
All other conditions being equal, a decrease in the exchange<br />
rate would have had a corresponding opposite impact.<br />
All other conditions being equal, a 10% increase in the NOK<br />
exchange rate in relation to the exchange rate at the balance<br />
sheet date would have had a positive effect of DKK 461 million<br />
on profit and equity (2010: positive effect of DKK 393 million).<br />
All other conditions being equal, a decrease in the exchange<br />
rate would have had a corresponding opposite impact.<br />
Interest rate risks<br />
Interest rate risks are the risk that externally introduced<br />
changes in agreed interest rates lead to increased interest<br />
expense or reduced interest income for <strong>DONG</strong> <strong>Energy</strong> A/S. For<br />
an analysis of the company’s interest rate sensitivity, reference<br />
is made to note 32 to the consolidated financial statements.<br />
ineffectiveness<br />
Ineffectiveness of interest rate hedging was DKK 0 million in<br />
<strong>2011</strong> (2010: DKK 0 million).<br />
interest rate hedges<br />
As part of its financial management, <strong>DONG</strong> <strong>Energy</strong> A/S swaps<br />
the interest basis on loans from a floating rate to a fixed rate or<br />
vice versa using interest rate swaps. For interest rate swaps<br />
converting floating-rate loans to fixed-rate loans (hedging of<br />
cash flows), value adjustments recognised directly in equity at<br />
31 December <strong>2011</strong> amounted to a net loss of DKK 848 million<br />
(31 December 2010: loss of DKK 265 million). Reference is<br />
made to note 33 to the consolidated financial statements.<br />
Counterparty risks<br />
178 parEnt COmpany finanCial statEmEnts – <strong>DONG</strong> ENERGY <strong>ANNUAL</strong> <strong>REPORT</strong> <strong>2011</strong><br />
Counterparty risks are the risk that a financial loss will be<br />
realised in the event of a counterparty to an agreement being<br />
unable to discharge its obligations under the agreement.<br />
<strong>DONG</strong> <strong>Energy</strong> A/S’s counterparty risk comprises primarily<br />
receivables from financial counterparties. Credit rating of business<br />
partners is carried out on a regular basis to generally<br />
minimise this risk.<br />
The amounts with which the items in question are recognised<br />
in the balance sheet correspond to the company’s maximum<br />
counterparty risk. Losses on receivables from individual business<br />
partners have historically been low. In the company’s<br />
opinion, there are no special concentrations of counterparty<br />
risks. The company’s counterparty risk in connection with<br />
derivative financial instruments entered into is limited as such<br />
instruments have primarily been entered into with major international<br />
banks or other counterparties with a high credit rating.<br />
Reference is made to note 32 to the consolidated financial<br />
statements.
19 Financial instruments<br />
maturity analysis for financial liabilities including interest payments<br />
<strong>2011</strong><br />
DKK million Carrying<br />
amount<br />
Payment<br />
obligation<br />
2012 2013 2014 2015 2016 After 2016<br />
non-derivative financial<br />
instruments:<br />
Bond loans 22,678 35,619 4,856 1,009 4,726 827 4,544 19,657<br />
Bank overdrafts 3,920 3,920 3,920 - - - - -<br />
Other bank loans 15,568 17,969 1,975 2,243 910 712 1,240 10,889<br />
Trade payables 19 19 19 - - - - -<br />
Payables to subsidiaries 10,509 10,509 10,509 - - - - -<br />
Other payables<br />
Derivative financial<br />
instruments:<br />
Fair value of derivative financial<br />
622 622 622 - - - - -<br />
instruments 8,042 8,239 3,646 1,761 1,066 436 134 1,196<br />
payables 61,358 76,897 25,547 5,013 6,702 1,975 5,918 31,742<br />
2010<br />
DKK million Carrying<br />
amount<br />
Payment<br />
obligation<br />
<strong>2011</strong> 2012 2013 2014 2015 After 2015<br />
non-derivative financial<br />
instruments:<br />
Bond loans 26,570 40,401 5,044 4,980 1,004 4,728 822 23,823<br />
Bank overdrafts - - - - - - - -<br />
Other bank loans 9,233 10,288 623 208 2,045 489 443 6,480<br />
Trade payables 12 12 12 - - - - -<br />
Payables to subsidiaries 10,206 10,206 10,206 - - - - -<br />
Other payables<br />
Derivative financial<br />
instruments:<br />
Fair value of derivative financial<br />
811 811 811 - - - - -<br />
instruments 5,630 5,630 2,139 1,232 932 606 143 578<br />
payables 52,462 67,348 18,835 6,420 3,981 5,823 1,408 30,881<br />
At 31 December <strong>2011</strong>, <strong>DONG</strong> <strong>Energy</strong> A/S had issued hybrid<br />
capital with a principal of DKK 9,664 million due in 3005 and<br />
3010, see note 22.<br />
The maturity analysis is based on undiscounted cash flows<br />
relating to financial liabilities.<br />
<strong>DONG</strong> ENERGY <strong>ANNUAL</strong> <strong>REPORT</strong> <strong>2011</strong> – parEnt COmpany finanCial statEmEnts<br />
179<br />
notes
notes<br />
19 Financial instruments<br />
Categories of financial instruments<br />
DKK million Carrying<br />
amount<br />
<strong>2011</strong> 2010<br />
Derivative financial instruments held for trading 6,613 6,613 5,721 5,721<br />
Securities 9,665 9,665 7,470 7,470<br />
financial assets measured at fair value via profit for the year 16,278 16,278 13,191 13,191<br />
Derivative financial instruments entered into to hedge fair values 405 405 156 156<br />
financial assets used as hedging instruments 405 405 156 156<br />
Other receivables 64,854 64,854 55,867 55,867<br />
Cash 4 4 1,506 1,506<br />
loans and receivables 64,858 64,858 57,373 57,373<br />
Derivative financial instruments held for trading 7,820 7,820 5,267 5,267<br />
financial liabilities measured at fair value via profit for the year 7,820 7,820 5,267 5,267<br />
Derivative financial instruments entered into to hedge future cash<br />
flows 846 846 260 260<br />
Derivative financial instruments entered into to hedge fair values 120 120 103 103<br />
financial liabilities used as hedging instruments 966 966 363 363<br />
Bond loans 22,678 25,228 26,570 28,149<br />
Bank loans 19,488 20,135 9,233 9,596<br />
Other liabilities 11,150 11,150 11,017 11,017<br />
financial liabilities measured at amortised cost 53,316 56,513 46,820 48,762<br />
180 parEnt COmpany finanCial statEmEnts – <strong>DONG</strong> ENERGY <strong>ANNUAL</strong> <strong>REPORT</strong> <strong>2011</strong><br />
Fair value<br />
Carrying<br />
amount<br />
Fair value
fair value hierarchy of financial instruments<br />
DKK million Quoted prices<br />
(Level 1)<br />
Observable inputs<br />
(Level 2)<br />
<strong>2011</strong> 2010<br />
Non-observable<br />
inputs<br />
(Level 3)<br />
total<br />
Quoted prices<br />
(Level 1)<br />
Observable inputs<br />
(Level 2)<br />
Non-observable<br />
inputs<br />
(Level 3)<br />
Derivative financial<br />
instruments - 5,198 1,076 6,274 - 5,496 381 5,877<br />
Securities 9,665 - - 9,665 7,470 - - 7,470<br />
assets 9,665 5,198 1,076 15,939 7,470 5,496 381 13,347<br />
Derivative financial<br />
instruments - (7,322) (720) (8,042) - (5,630) - (5,630)<br />
liabilities 0 (7,322) (720) (8,042) 0 (5,630) 0 (5,630)<br />
Level 1 comprises quoted securities traded in active markets.<br />
Level 2 comprises derivative financial instruments, where valuation<br />
methods with observable inputs are used to measure fair<br />
value, and with discounting to present value using a discount<br />
rate set by <strong>DONG</strong> <strong>Energy</strong> A/S. Level 2 also comprises quoted<br />
Categories of financial instruments<br />
DKK million Derivative finan-<br />
total<br />
securities that have not been traded in the market sufficiently<br />
for a reliable fair value to be obtained.<br />
Level 3 comprises other derivative financial instruments in<br />
which the value of one or more key, non-observable inputs has<br />
been estimated and where the sum of these estimated nonobservable<br />
inputs may affect the fair value.<br />
cial instruments<br />
(assets)<br />
<strong>2011</strong> 2010<br />
Derivative financial<br />
instruments<br />
(assets)<br />
Derivative financial<br />
instruments<br />
(assets)<br />
Derivative financial<br />
instruments<br />
(assets)<br />
At 1 January 381 - - (96)<br />
Gains and losses recognised in profit for the year as revenue 696 (701) (64) 96<br />
Purchases 8 (28) (6) -<br />
Other transfers to and from Level 3 (9) 9 451 -<br />
at 31 December 1,076 (720) 381 0<br />
A loss in respect of assets and liabilities that are valued based<br />
on non-observable inputs and were still recognised in the balance<br />
sheet at 31 December <strong>2011</strong> was recognised with DKK 25<br />
million (2010: loss of DKK 19 million) in profit for the year as<br />
revenue.<br />
<strong>DONG</strong> ENERGY <strong>ANNUAL</strong> <strong>REPORT</strong> <strong>2011</strong> – parEnt COmpany finanCial statEmEnts<br />
181<br />
notes
notes<br />
20 Leasing<br />
Operating leases<br />
DKK million<br />
21 Contingent assets and liabilities<br />
Contingent assets<br />
In previous financial years, <strong>DONG</strong> <strong>Energy</strong> A/S has concluded<br />
agreements on the disposal of enterprises that feature contingent<br />
consideration, the consideration depending in part on<br />
several uncertain future events outside <strong>DONG</strong> <strong>Energy</strong> A/S’s<br />
control.<br />
Contingent liabilities<br />
Guarantees<br />
<strong>DONG</strong> <strong>Energy</strong> A/S has provided guarantees in connection with<br />
participation by subsidiaries and participation by joint ventures<br />
in which subsidiaries are partners in natural gas and oil exploration<br />
and production, construction and operation of wind farms,<br />
<strong>2011</strong> 2010<br />
Minimum lease<br />
payments Subleasing net<br />
Minimum lease<br />
payments Subleasing net<br />
0-1 year (98) 85 (13) (106) 95 (11)<br />
1-5 years (97) 87 (10) (34) 31 (3)<br />
More than<br />
5 years (77) 77 0 - - 0<br />
minimum lease<br />
payments (272) 249 (23) (140) 126 (14)<br />
<strong>DONG</strong> <strong>Energy</strong> A/S has entered into operating leases for leasing<br />
of office premises until 2022 and vehicle leasing on behalf<br />
of the Group’s companies. There are no significant restrictions<br />
in the leases. In <strong>2011</strong>, an amount of DKK 102 million (2010:<br />
DKK 86 million) was recognised in profit for the year in respect<br />
of operating lease payments.<br />
182 parEnt COmpany finanCial statEmEnts – <strong>DONG</strong> ENERGY <strong>ANNUAL</strong> <strong>REPORT</strong> <strong>2011</strong><br />
<strong>DONG</strong> <strong>Energy</strong> A/S has entered into operating leases with<br />
subsidiaries for subleasing of office premises and leasing of<br />
investment property. There are no significant restrictions in<br />
the leases. In <strong>2011</strong>, an amount of DKK 104 million (2010: DKK<br />
89 million) was recognised in profit for the year in respect of<br />
rental income.<br />
and geothermal plants and natural gas installations. <strong>DONG</strong><br />
<strong>Energy</strong> A/S has also provided guarantees in respect of leases, decommissioning<br />
obligations, purchase and sales contracts, etc.<br />
<strong>DONG</strong> <strong>Energy</strong> A/S acts as guarantor with primary liability for<br />
bank balances in subsidiaries for DKK 1,294 million (2010: DKK<br />
3,236 million).<br />
litigation<br />
<strong>DONG</strong> <strong>Energy</strong> A/S is a party to a number of litigation proceedings<br />
and legal disputes that do not have any effect on the<br />
company’s financial position, either individually or collectively.
22 Related party transactions<br />
trading with subsidiaries<br />
DKK million <strong>2011</strong> 2010<br />
Rental income and services to subsidiaries 119 99<br />
Purchases of goods and services from subsidiaries (195) (101)<br />
Interest, subsidiaries (net income) 1,601 1,448<br />
Capital transactions and balances with subsidiaries<br />
and jointly controlled entities at 31 December<br />
DKK million <strong>2011</strong> 2010<br />
Receivables from subsidiaries 62,752 55,661<br />
Receivables from jointly controlled entities 328 -<br />
Payables to subsidiaries (10,509) (10,206)<br />
Dividends received from subsidiaries 3,113 1,703<br />
Remuneration to the Board of Directors and the Executive<br />
Board is disclosed in note 4.<br />
For a description of related parties, reference is made to note<br />
38 to the consolidated financial statements.<br />
For a list of subsidiaries, reference is made to note 23.<br />
<strong>DONG</strong> ENERGY <strong>ANNUAL</strong> <strong>REPORT</strong> <strong>2011</strong> – parEnt COmpany finanCial statEmEnts<br />
183<br />
notes
notes<br />
23 Company overview<br />
Name Registered office<br />
Ownership<br />
interest<br />
subsidiaries<br />
DE nr. 1 2003 A/S Fredericia, Denmark 100%<br />
<strong>DONG</strong> E&P A/S Fredericia, Denmark 100%<br />
<strong>DONG</strong> El A/S Fredericia, Denmark 100%<br />
<strong>DONG</strong> <strong>Energy</strong> Ayrshire Holdco Ltd. London, England 100%<br />
<strong>DONG</strong> <strong>Energy</strong> Infrastruktur Holding GmbH Hamburg, Germany 100%<br />
<strong>DONG</strong> <strong>Energy</strong> Oil & Gas A/S Fredericia, Denmark 100%<br />
<strong>DONG</strong> <strong>Energy</strong> Pipelines GmbH Kiel, Germany 100%<br />
<strong>DONG</strong> <strong>Energy</strong> Power Holding A/S 1 Fredericia, Denmark 57%<br />
<strong>DONG</strong> <strong>Energy</strong> Power A/S 2 Fredericia, Denmark 17%<br />
<strong>DONG</strong> <strong>Energy</strong> Sales & Distribution A/S Fredericia, Denmark 100%<br />
<strong>DONG</strong> Gas Distribution A/S Fredericia, Denmark 100%<br />
<strong>DONG</strong> Insurance A/S Fredericia, Denmark 100%<br />
<strong>DONG</strong> Naturgas A/S Fredericia, Denmark 100%<br />
<strong>DONG</strong> Oil Pipe A/S Fredericia, Denmark 100%<br />
<strong>DONG</strong> Storage A/S Fredericia, Denmark 100%<br />
<strong>DONG</strong> Sverige Distribution AB Gothenburg, Sweden 100%<br />
<strong>DONG</strong> VE A/S Fredericia, Denmark 100%<br />
1 The remaining part of the company is owned by EnergiGruppen Jylland El A/S, which is wholly-owned by the <strong>DONG</strong> <strong>Energy</strong> Group.<br />
2 The remaining part of the company is owned by <strong>DONG</strong> <strong>Energy</strong> Power Holding A/S and <strong>DONG</strong> <strong>Energy</strong> Sales & Distribution, which are wholly-owned<br />
by the <strong>DONG</strong> <strong>Energy</strong> Group.<br />
184 parEnt COmpany finanCial statEmEnts – <strong>DONG</strong> ENERGY <strong>ANNUAL</strong> <strong>REPORT</strong> <strong>2011</strong>
Independent Auditor’s Report<br />
To the Shareholders of <strong>DONG</strong> <strong>Energy</strong> A/S<br />
report on Consolidated financial statements<br />
and parent Company financial statements<br />
We have audited the Consolidated Financial Statements and the<br />
Parent Company Financial Statements of <strong>DONG</strong> <strong>Energy</strong> A/S for<br />
the financial year 1 January to 31 December <strong>2011</strong>, which comprise<br />
statement of comprehensive income, balance sheet, statement of<br />
changes in equity, cash flow statement and notes, including summary<br />
of significant accounting policies, for the Group as well as<br />
for the Parent Company. The Consolidated Financial Statements<br />
and the Parent Company Financial Statements are prepared in<br />
accordance with International Financial Reporting Standards as<br />
adopted by the EU and Danish disclosure requirements for listed<br />
companies and State-owned public limited companies.<br />
Management’s Responsibility for the Consolidated Financial<br />
Statements and the Parent Company Financial Statements<br />
Management is responsible for the preparation of Consolidated<br />
Financial Statements and Parent Company Financial Statements<br />
that give a true and fair view in accordance with International<br />
Financial Reporting Standards as adopted by the EU<br />
and Danish disclosure requirements for listed companies and<br />
State-owned public limited companies, and for such internal<br />
control as Management determines is necessary to enable the<br />
preparation of Consolidated Financial Statements and Parent<br />
Company Financial Statements that are free from material misstatement,<br />
whether due to fraud or error.<br />
Auditor’s Responsibility<br />
Our responsibility is to express an opinion on the Consolidated<br />
Financial Statements and the Parent Company Financial<br />
Statements based on our audit. We conducted our audit in accordance<br />
with International Standards on Auditing and additional<br />
requirements under Danish audit regulation. This requires<br />
that we comply with ethical requirements and plan and<br />
perform the audit to obtain reasonable assurance whether the<br />
Consolidated Financial Statements and the Parent Company<br />
Financial Statements are free from material misstatement.<br />
An audit involves performing procedures to obtain audit<br />
evidence about the amounts and disclosures in the Consolidated<br />
Financial Statements and the Parent Company Financial<br />
Copenhagen, 9 March 2012<br />
pricewaterhouseCoopers<br />
Statsautoriseret Revisionspartnerselskab<br />
Fin T. Nielsen Mogens Nørgaard Mogensen<br />
Statements. The procedures selected depend on the auditor’s<br />
judgment, including the assessment of the risks of material<br />
misstatement of the Consolidated Financial Statements and<br />
the Parent Company Financial Statements, whether due to<br />
fraud or error. In making those risk assessments, the auditor<br />
considers internal control relevant to the Company’s preparation<br />
of Consolidated Financial Statements and Parent<br />
Company Financial Statements that give a true and fair view in<br />
order to design audit procedures that are appropriate in the<br />
circumstances, but not for the purpose of expressing an opinion<br />
on the effectiveness of the Company’s internal control. An<br />
audit also includes evaluating the appropriateness of accounting<br />
policies used and the reasonableness of accounting<br />
estimates made by Management, as well as evaluating the<br />
overall presentation of the Consolidated Financial Statements<br />
and the Parent Company Financial Statements.<br />
We believe that the audit evidence we have obtained is sufficient<br />
and appropriate to provide a basis for our audit opinion.<br />
The audit has not resulted in any qualification.<br />
Opinion<br />
In our opinion, the Consolidated Financial Statements and the<br />
Parent Company Financial Statements give a true and fair view of<br />
the Group’s and the Parent Company’s financial position at 31 December<br />
<strong>2011</strong> and of the results of the Group’s and the Parent<br />
Company’s operations and cash flows for the financial year 1 January<br />
to 31 December <strong>2011</strong> in accordance with International Financial<br />
Reporting Standards as adopted by the EU and Danish<br />
disclosure requirements for listed companies and State-owned<br />
public limited companies.<br />
statement on management’s review<br />
We have read Management’s Review in accordance with the Danish<br />
Financial Statements Act. We have not performed any procedures<br />
additional to the audit of the Consolidated Financial Statements<br />
and the Parent Company Financial Statements. On this<br />
basis, in our opinion, the information provided in Management’s<br />
Review is consistent with the Consolidated Financial Statements<br />
and the Parent Company Financial Statements.<br />
State Authorised Public Accountant State Authorised Public Accountant<br />
<strong>DONG</strong> ENERGY <strong>ANNUAL</strong> <strong>REPORT</strong> <strong>2011</strong> – inDEpEnDEnt auDitOr’s rEpOrt<br />
185<br />
IndePendent audItoR’s <strong>REPORT</strong>
125<br />
assuRance stateMent<br />
Assurance Statement<br />
Independent auditor’s Assurance Statement<br />
for <strong>DONG</strong> <strong>Energy</strong>’s stakeholders<br />
We have reviewed <strong>DONG</strong> <strong>Energy</strong>’s non-financial statements for<br />
<strong>2011</strong> for the purpose of expressing a conclusion on CSR data.<br />
Criteria used to prepare the non-financial statements<br />
The criteria used to prepare the non-financial statements are<br />
set out in the description of accounting policies on pages 152-<br />
155 in the Annual Report. These contain information on which<br />
of the Group’s business areas and activities are included in the<br />
reporting and Management’s reasons for choosing the data included.<br />
Data are recognised in accordance with the description<br />
of applied accounting policies for non-financial data.<br />
Responsibilities<br />
Company Management is responsible for preparing the non-financial<br />
statements, including for establishing registration and<br />
internal control systems with a view to ensuring a reliable reporting<br />
basis, specifying acceptable reporting criteria and<br />
choosing data to be collected. Based on our review, it is our responsibility<br />
to express a conclusion on the CSR data in the<br />
non-financial statements.<br />
Scope<br />
We have planned and performed our work in accordance with<br />
the international standard on assurance engagements ISAE<br />
3000 (assurance engagements other than audits or reviews of<br />
historical financial information) for the purpose of obtaining<br />
limited assurance that the CSR data presented on page 6 have<br />
been recognised in accordance with the criteria used to prepare<br />
the non-financial statements.<br />
The obtained assurance is limited as our engagement has<br />
been limited compared to an audit engagement. Based on an<br />
assessment of materiality and risk, our work has first and foremost<br />
comprised inquiries regarding applied instructions, registration<br />
and reporting systems, procedures with focus on inter-<br />
Copenhagen, 9 March 2012<br />
pricewaterhouseCoopers<br />
Statsautoriseret Revisionspartnerselskab<br />
nal controls, auditing analyses of the data basis used to<br />
prepare the non-financial statements, sample testing of data<br />
and underlying documentation, including visits at selected local<br />
entities, and control of compliance with the description of<br />
accounting policies for the <strong>2011</strong> non-financial statements.<br />
Conclusion<br />
Based on our work, nothing has come to our attention causing<br />
us to believe that the CSR data presented on page 6 of the<br />
Group Annual Report and the Annual Report for <strong>2011</strong> have not<br />
been recognised in accordance with the criteria used to prepare<br />
the non-financial statements.<br />
Special statement on reporting in accordance with GRI’s Sustainability<br />
Reporting Guidelines and opinion on social responsibility<br />
statement<br />
We have assessed the extent to which <strong>DONG</strong> <strong>Energy</strong> has applied<br />
GRI’s Sustainability Reporting Guidelines (GRI G3.0), application<br />
level B+, including Electric Utilities Sector Supplement,<br />
for the financial year <strong>2011</strong>. Our work has primarily<br />
comprised a review of the documentation presented, including<br />
chosen inquiries and sample testing of information and data,<br />
to determine whether the documentation meets the requirements<br />
of GRI G3.0. Based on our work, nothing has come to<br />
our attention contradicting <strong>DONG</strong> <strong>Energy</strong>’s self assessment of<br />
the extent to which it in its reporting complies with GRI G3.0,<br />
including the Electric Utilities Sector Supplement. We are thus<br />
able to state that nothing has come to our attention causing<br />
us to believe that <strong>DONG</strong> <strong>Energy</strong> has not reported in a reasonable<br />
and balanced manner in accordance with GRI G3.0, application<br />
level B+, including the Electric Utilities Sector Supplement.<br />
We have furthermore assessed if, and can confirm that <strong>DONG</strong><br />
<strong>Energy</strong> in its reporting complies with the requirements for presenting<br />
a social responsibility statement as set out in section<br />
99(a) of the Danish Financial Statements Act.<br />
Fin T. Nielsen Mogens Nørgaard Mogensen<br />
State Authorised Public Accountant State Authorised Public Accountant<br />
186 assuranCE statEmEnt – <strong>DONG</strong> ENERGY <strong>ANNUAL</strong> <strong>DONG</strong> <strong>REPORT</strong> ENERGY <strong>2011</strong> GROUP <strong>ANNUAL</strong> <strong>REPORT</strong> <strong>2011</strong> – assuranCE statEmEnt<br />
125<br />
assuRance stateMent
coMPany announceMents IN <strong>2011</strong><br />
Company announcements in <strong>2011</strong><br />
Q4<br />
23 December<br />
Changes to previous announcement<br />
about the divestment of Oil Terminals<br />
16 December<br />
<strong>DONG</strong> <strong>Energy</strong> acquires a stake in the<br />
first two projects in SMart Wind’s<br />
Hornsea zone<br />
04 november<br />
<strong>DONG</strong> <strong>Energy</strong> acquires the right to<br />
further develop German offshore wind<br />
farm<br />
04 november<br />
Interim financial report – Q3 <strong>2011</strong> –<br />
Stable results for the first nine<br />
months of the year<br />
01 november<br />
Completion of Marubeni Corporation’s<br />
acquisition of an ownership<br />
stake in Gunfleet Sands offshore<br />
windfarm<br />
31 October<br />
<strong>DONG</strong> <strong>Energy</strong> to present first 9<br />
months’ results<br />
27 October<br />
Vestas and <strong>DONG</strong> <strong>Energy</strong> enter into<br />
agreement on testing of new 7 MW<br />
offshore wind turbine<br />
21 October<br />
Divestment of the transmission assets<br />
at the offshore wind farm Walney 1<br />
20 October<br />
Divestment of stakes in Anholt offshore<br />
wind farm has been approved<br />
18 October<br />
<strong>DONG</strong> <strong>Energy</strong> enters into agreement<br />
to acquire UK Shell Gas Direct<br />
03 October<br />
<strong>DONG</strong> <strong>Energy</strong> increases stake in<br />
Syd Arne field<br />
Q3<br />
29 september<br />
<strong>DONG</strong> <strong>Energy</strong> appoints new<br />
Executive Vice President<br />
27 september<br />
Disposal of Barrow offshore wind farm<br />
transmission assets<br />
01 september<br />
Marubeni Corporation to become coowner<br />
of Gunfleet Sands offshore<br />
wind farm<br />
31 august<br />
<strong>DONG</strong> <strong>Energy</strong> acquires Noreco’s<br />
stake in the Siri field<br />
26 august<br />
<strong>DONG</strong> <strong>Energy</strong> co-founder of bioenergy<br />
consortium in Måbjerg<br />
22 august<br />
Executive Vice President Niels Bergh-<br />
Hansen retires<br />
17 august<br />
<strong>DONG</strong> <strong>Energy</strong> A/S signs a new<br />
EUR 1.3bn credit facility<br />
16 august<br />
<strong>DONG</strong> <strong>Energy</strong> sells its stake in Nordkraft<br />
Vind<br />
16 august<br />
Interim financial report - Q2 <strong>2011</strong> –<br />
High energy prices ensured strong results<br />
10 august<br />
<strong>DONG</strong> <strong>Energy</strong> to present first half results<br />
for <strong>2011</strong><br />
25 July<br />
<strong>DONG</strong> <strong>Energy</strong> and Noreco make an<br />
agreement on the Siri field in the<br />
North Sea<br />
19 July<br />
Terms in place for the divestment of<br />
the transmission assets at the Gunfleet<br />
Sands offshore wind farm<br />
Q2<br />
28 June<br />
<strong>DONG</strong> <strong>Energy</strong> and Bladt Industries<br />
sign long-term cooperation agreement<br />
on wind turbine foundations<br />
20 June<br />
<strong>DONG</strong> <strong>Energy</strong> enters into agreement<br />
to divest Oil Terminals to Inter Pipeline<br />
Fund<br />
16 June<br />
<strong>DONG</strong> <strong>Energy</strong> and ScottishPower Renewables<br />
to build West of Duddon<br />
Sands offshore wind farm<br />
15 June<br />
<strong>DONG</strong> <strong>Energy</strong>’s repair solution only<br />
sufficient solution for Siri<br />
15 June<br />
Permanent solution for North Sea<br />
platform Siri<br />
19 may<br />
Interim financial report - Q1 <strong>2011</strong> –<br />
Sound and satisfactory results<br />
16 may<br />
New and more transparent presentation<br />
of income statement<br />
12 may<br />
<strong>DONG</strong> <strong>Energy</strong> to present first quarter<br />
results for <strong>2011</strong><br />
126 aDDitiOnal infOrmatiOn – <strong>DONG</strong> ENERGY GROUP <strong>DONG</strong> <strong>ANNUAL</strong> ENERGY <strong>REPORT</strong> <strong>ANNUAL</strong> <strong>2011</strong> <strong>REPORT</strong> <strong>2011</strong> – aDDitiOnal infOrmatiOn<br />
Q1<br />
28 march<br />
PensionDanmark and PKA to become<br />
co-owners of Denmark’s largest offshore<br />
wind farm<br />
11 march<br />
<strong>DONG</strong> <strong>Energy</strong> A/S’ list of information<br />
published pursuant to Section 27b of<br />
the Danish Securities Trading Act<br />
11 march<br />
Announcement of financial results for<br />
2010<br />
08 march<br />
<strong>DONG</strong> <strong>Energy</strong> to present full year<br />
2010 results<br />
24 february<br />
<strong>DONG</strong> <strong>Energy</strong> to build German offshore<br />
wind farm<br />
18 february<br />
Change of reporting segments<br />
27 January<br />
Notice to holders of GBP<br />
500,000,000 5.75% securities due<br />
2040, issued by <strong>DONG</strong> <strong>Energy</strong> on 9<br />
April 2010 (ISIN xS0499449261)<br />
21 January<br />
Announcement of final pricing regarding<br />
<strong>DONG</strong> <strong>Energy</strong>’s invitation<br />
to tender hybrid capital bonds for<br />
repurchase<br />
20 January<br />
Announcement of results and acceptance<br />
regarding <strong>DONG</strong> <strong>Energy</strong>’s invitation<br />
to tender hybrid capital bonds<br />
for repurchase<br />
13 January<br />
<strong>DONG</strong> <strong>Energy</strong> has successfully issued<br />
new hybrid capital bonds<br />
13 January<br />
<strong>DONG</strong> <strong>Energy</strong> resumes intention to<br />
issue new hybrid capital bonds and<br />
announces invitation to tender existing<br />
hybrid capital bonds for repurchase<br />
11 January<br />
Financial calendar <strong>2011</strong><br />
187<br />
coMPany announceMents IN <strong>2011</strong><br />
126
127<br />
glossaRy<br />
Glossary<br />
2p reserves: Sum of Proved reserves plus Probable reserves<br />
(Society of Petroleum Engineers and World Petroleum<br />
Congress (SPE/WPC) reserve classification standards).<br />
apX: Amsterdam Power Exchange, Dutch power exchange.<br />
Bafa: Bundesamt für Wirtschaft und Ausfuhrkontrolle.<br />
Biomass: Also known as biomass fuel. A term for all combustible<br />
organic materials, including straw, wood chips and<br />
wood pellets. CO emissions produced by the combustion<br />
2<br />
of biomass are not covered by ETS. Biomass can be used in<br />
both central power stations and small-scale CHP plants.<br />
Cash-flow-at-risk (Cfar): Indicator that reflects the<br />
maximum amount by which cash flow may fall, with a probability<br />
of 95%, compared with expected cash flow over the<br />
risk management time frame.<br />
Central power station: A larger power station, typically<br />
with a net installed power capacity of more than 100 MW.<br />
CHp plant: A Combined Heat and Power (CHP) plant generates<br />
both heat and electricity in the same process. The<br />
heat generated may be used for industrial purposes and/or<br />
district heating.<br />
CHp plant, small-scale: A Combined Heat and Power<br />
Plant (CHP), typically with a net installed power capacity of<br />
less than 100 MW.<br />
Climate partnerships: The possibility of providing customers<br />
with energy-saving solutions. Including the possibility<br />
of offering residential customers energy-saving Cleantech<br />
solutions and advice, typically in the form of geothermal<br />
heating, window insulation, etc. The possibility of offering<br />
business customers actual partnerships by providing energy-saving<br />
advice, with the energy savings achieved typically<br />
being used to buy green electricity (from wind turbines)<br />
from <strong>DONG</strong> <strong>Energy</strong>. Partnerships with business<br />
customers open up other opportunities for collaboration<br />
between energy company and customer in the longer term.<br />
CO 2 : Carbon dioxide.<br />
CO allowances: Carbon dioxide emissions allowances<br />
2<br />
subject to the European Union Emissions Trading Scheme<br />
(EU ETS).<br />
Derivatives: Financial and physical instruments that can<br />
be used to guarantee a specific price for the purchase or<br />
sale of, for example, commodities and currency.<br />
DK1 and DK2: Area prices for electricity in West Denmark<br />
(DK1) and East Denmark (DK2).<br />
DuC: Dansk Undergrunds Consortium.<br />
EEX: European <strong>Energy</strong> Exchange, German power exchange.<br />
EfEt: European Federation of <strong>Energy</strong> Traders. Develops<br />
European standard contract documentation that can be<br />
used for mutual trading in energy.<br />
Emir: European Market Infrastructure Regulation. Its purpose<br />
is to improve transparency and enhance market<br />
safety and regulatory oversight.<br />
Ets: The EU Emissions Trading Scheme, which aims to reduce<br />
emissions of carbon dioxide and combat climate<br />
change by means of a system that grants CO emissions<br />
2<br />
allowances and enables electricity producers and other<br />
emitters to trade these CO emissions allowances.<br />
2<br />
Eua: European Union Allowance. The allowances available<br />
within the EU borders.<br />
Exploration and appraisal wells: Wells drilled to discover<br />
and evaluate gas or oil in an unproved area to find new reserves<br />
in an area in which hydrocarbon discoveries have<br />
previously been made or to delineate a known accumulation.<br />
fifO principle – coal inventories: First in, first out. <strong>DONG</strong><br />
<strong>Energy</strong> buys physical coal up to one year ahead of delivery.<br />
To ensure security of supply, the inventory of coal typically<br />
corresponds to 4 to 6 months’ consumption. As the value<br />
of coal inventories is recognised in the balance sheet using<br />
the FIFO principle, coal purchased in a period with high<br />
market prices, followed by a period with declining coal<br />
prices, will be recognised as a cost of sales item at prices<br />
exceeding the current market price level.<br />
fossil fuels: Fuel resources such as coal, coal products,<br />
gas, crude oil and other hydrocarbon products.<br />
ftE: Full Time Equivalent. The number of full-time employees<br />
during a fixed time period. An FTE of 1.0 indicates that<br />
the person is equivalent to a full-time worker, while an FTE<br />
of 0.5 indicates that the person works part time only.<br />
Green dark spread (GDs) and contribution margin from<br />
electricity generation: Green dark spread represents the<br />
contribution margin per MWh of electricity generated at a<br />
coal-fired power station of a given efficiency. It is calculated<br />
as the difference between the market price of electricity<br />
and the cost of the coal (including associated freight<br />
costs) and CO allowances used to generate the electricity.<br />
2<br />
<strong>DONG</strong> <strong>Energy</strong>’s contribution margin from electricity generation<br />
is affected, among other things, by whether electricity<br />
is generated at times during the 24-hour cycle when<br />
prices are relatively high (peak) or at times when prices are<br />
188 aDDitiOnal infOrmatiOn – <strong>DONG</strong> ENERGY <strong>DONG</strong> <strong>ANNUAL</strong> ENERGY <strong>REPORT</strong> GROUP <strong>2011</strong> <strong>ANNUAL</strong> <strong>REPORT</strong> <strong>2011</strong> – aDDitiOnal infOrmatiOn<br />
127<br />
glossaRy
glossaRy<br />
relatively low (off-peak). The contribution margin is also affected<br />
by the fact that the cost of coal for accounting purposes<br />
differs from the market price resulting from application<br />
of the FIFO (first-in, first-out) principle to inventories.<br />
In addition, <strong>DONG</strong> <strong>Energy</strong> is allocated a specific volume of<br />
CO emissions allowances.<br />
2<br />
Green spark spread (Gss): Green spark spread represents<br />
the contribution margin per MWh generated at a gas-fired<br />
power station of a given efficiency. It is measured as the<br />
difference between the market price of electricity and the<br />
costs of gas and CO allowances used for generating the<br />
2<br />
electricity.<br />
Hydrological balance: Most of the electricity generated in<br />
the Nordic countries comes from hydro electric stations,<br />
and their output depends on their water reservoir levels.<br />
The hydrological balance reflects whether the level in the<br />
Norwegian and Swedish water and snow reservoirs is<br />
above or below normal.<br />
isDa: The International Swaps and Derivatives Association.<br />
Develops standard contract documentation that can<br />
be used for mutual trading in derivative financial instruments.<br />
lEBa: London <strong>Energy</strong> Brokers’ Association.<br />
lnG: Liquefied Natural Gas. Gas that has been liquefied by<br />
cooling to minus 161 degrees Celsius. LNG takes up 600<br />
times less space than conventional gas. LNG can be transported<br />
in customised tankers, enabling it to be transported<br />
from remote destinations. In the receiving terminal, the<br />
LNG is vaporised and pressurised before being routed into<br />
the transmission system for onwards distribution and sale.<br />
ltif: Lost Time Injury Frequency. <strong>DONG</strong> <strong>Energy</strong> defines<br />
lost time injuries as occupational injuries resulting in at<br />
least one day’s absence from work in addition to the day of<br />
the injury.<br />
mifiD: Markets in Financial Instruments Directive. EU Directive<br />
designed to harmonise the European Union’s financial<br />
markets and increase cross-border investments.<br />
million boe: Million barrels of oil equivalent.<br />
nBp: National Balancing Points, UK gas hub.<br />
nord pool: The Norwegian-based Nordic power exchange,<br />
which facilitates electricity trading in Norway, Sweden, Finland<br />
and Denmark.<br />
nO x : Nitrogen oxides.<br />
Operator: The company appointed to conduct operations<br />
under an exploration, production and/or development licence<br />
or concession governing an oil or gas licence or concession<br />
area.<br />
peak and off-peak: Reflects prices for electricity generated<br />
at times during the 24-hour cycle with high demand and<br />
low demand respectively.<br />
pJ: Petajoule, a unit of energy. 1 PJ is equivalent to 1,000 TJ<br />
or 1,000,000 GJ or 1,000,000,000 MJ.<br />
rEmit: Regulation on <strong>Energy</strong> Markets Integrity and Transparency.<br />
EU Regulation on integrity and transparency in<br />
energy markets to prevent insider dealing and market manipulation.<br />
sO 2 : Sulphur dioxide.<br />
spE-prms Guidelines: Internationally accepted guidelines<br />
for the evaluation of gas and oil reserves prepared by<br />
Society of Petroleum Engineers (SPE).<br />
supply obligation: A company with a supply obligation is<br />
bound by law to deliver electricity or gas to a certain geographic<br />
area at prices approved by the Danish <strong>Energy</strong><br />
Regulatory Authority.<br />
thermal generation: Electricity and heat generated<br />
through the combustion of fossil fuels, biomass or waste.<br />
time lag: Oil price changes and changes in the USD exchange<br />
rate impact on gas sales prices relatively quickly,<br />
whereas purchase prices are adjusted with a time lag effect<br />
of up to a year and a half. For example, a change in the<br />
price of oil and/or the USD exchange rate in January may<br />
affect <strong>DONG</strong> <strong>Energy</strong>’s sales prices already in February, but<br />
may not be felt on purchase prices before the summer of<br />
the following year. The impact on the individual periods<br />
consequently varies, and this may lead to considerable<br />
fluctuations in operating profit from one period to the next<br />
in the case of oil price changes. However, the fluctuations<br />
will balance each other out over a number of years.<br />
ttf: Title Transfer Facility, Dutch gas hub.<br />
twh: Terawatt hour. The amount of energy generated in<br />
one hour with the effect of 1 TW. 1 TWh is equivalent to<br />
1,000 GWh or 1,000,000 MWh.<br />
value at risk (var): Indicator that reflects the maximum<br />
amount by which the value of a position will fall in the<br />
course of one day, with a probability of 95%, given normal<br />
market conditions.<br />
wood pellets: Wood that has been pulverised and pelletised<br />
under heat and high pressure.<br />
128 aDDitiOnal infOrmatiOn – <strong>DONG</strong> ENERGY GROUP <strong>DONG</strong> <strong>ANNUAL</strong> ENERGY <strong>REPORT</strong> <strong>ANNUAL</strong> <strong>2011</strong> <strong>REPORT</strong> <strong>2011</strong> – aDDitiOnal infOrmatiOn<br />
189<br />
glossaRy<br />
128
<strong>DONG</strong> <strong>Energy</strong> A/S<br />
Kraftværksvej 53<br />
7000 Fredericia<br />
Denmark<br />
Tel +45 99 55 11 11<br />
www.dongenergy.com