Management of the Hungarian Energy Office - Magyar Energia Hivatal
Management of the Hungarian Energy Office - Magyar Energia Hivatal
Management of the Hungarian Energy Office - Magyar Energia Hivatal

You also want an ePaper? Increase the reach of your titles
YUMPU automatically turns print PDFs into web optimized ePapers that Google loves.
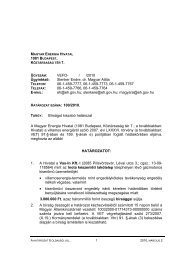
General Electricity System Usage Charges (Excluding VAT 1 ) from 2007<br />
3<br />
Connection to <strong>the</strong> transmission network<br />
4,5<br />
Connection to <strong>the</strong><br />
distribution network<br />
High-voltage connection<br />
Connection to medium-voltage<br />
6<br />
transformer<br />
Medium-voltage connection<br />
Connection to low-voltage<br />
8<br />
transformer<br />
10<br />
Low-voltage connection I.<br />
Low-voltage connection II.<br />
(controlled)<br />
Low-voltage connection III.<br />
Average<br />
See notes in table 7.4.2. for explanation.<br />
High-voltage connection<br />
Connection to medium-voltage<br />
6<br />
transformer<br />
Medium-voltage connection<br />
Connection to low-voltage<br />
8<br />
transformer<br />
10<br />
Low-voltage connection I.<br />
Low-voltage connection II.<br />
(controlled)<br />
11<br />
Low-voltage connection III.<br />
Average<br />
11<br />
February<br />
2007 7<br />
January<br />
2008 7<br />
January<br />
2009 12<br />
annual report 2009<br />
January<br />
2010 13<br />
4.43 1.52 1.00 1.54<br />
5.49 2.39 1.97 2.21<br />
6.83 3.78 3.25 3.71<br />
8.24 5.45 5.27 5.69<br />
6.80<br />
7.26<br />
7.68<br />
15.59<br />
13.30<br />
14.60<br />
15.42<br />
8.43 6.42 7.36 7.67<br />
14.42<br />
12.38<br />
13.07<br />
14.10<br />
11.36 8.73 9.05 9.50<br />
Average Changes 2 to <strong>the</strong> General Electricity System Usage Charges (Excluding VAT) from 2007<br />
3<br />
Connection to <strong>the</strong> transmission network<br />
4,5<br />
Connection to <strong>the</strong><br />
distribution network<br />
February<br />
2007 7<br />
January<br />
2008 7<br />
January<br />
2009 12<br />
January<br />
2010 13<br />
-9.0% -65.6% -34.3% 53.5%<br />
-7.4% -56.5% -17.3% 9.4%<br />
-4.6% -44.6% -7.6% 1.7%<br />
-2.5% -33.9% -0.1% 8.9%<br />
-10.3% 4.7%<br />
2.1% -14.7% 10.0% 4.9%<br />
-2.2% -23.8% 14.6% 5.3%<br />
1.6% -14.2% 8.6% 4.7%<br />
0.1% -23.1% 6.2% 2.9%<br />
Table 7.4.1.<br />
(HUF/kWh)<br />
Notes<br />
1. Until 30th <strong>of</strong> June 2009 VAT was 20%, since 1st <strong>of</strong> July 2009 it is 25%<br />
2. The fi gures show <strong>the</strong> changes compared to <strong>the</strong> average prices <strong>of</strong> <strong>the</strong> previous period<br />
3. Sum <strong>of</strong> transmission system operation (before 2008 separate transmission and system operation charges) and ancillary services charges<br />
4. Sum <strong>of</strong> transmission system operation (before 2008 separate transmission and system operation charges), ancillary services and <strong>the</strong> average value <strong>of</strong> <strong>the</strong><br />
distribution charges<br />
5. Calculated excluding <strong>the</strong> distribution time schedule balancing fee<br />
6. A category introduced on 1/1/2004<br />
7. Calculated with <strong>the</strong> quantitative weights considered for <strong>the</strong> 2005 - 2008 price regulation period<br />
8. A category introduced on 1/1/2008<br />
9. The values shown here represent also <strong>the</strong> impact <strong>of</strong> <strong>the</strong> abolishment <strong>of</strong> <strong>the</strong> non-tax levies which formed part <strong>of</strong> <strong>the</strong> system operation charge before 2008<br />
10. Before 2008 in case <strong>of</strong> not more than 3*32 A, in 2008 not more than 3*50 A, and from 2009 not more than 3*80 A tied-up/contracted capacity<br />
11. Before 2008 in case <strong>of</strong> more than 3*32 A, in 2008 more than 3*50 A, and from 2009 more than 3*80 A tied-up/contracted capacity<br />
12. Calculated with <strong>the</strong> quantitative weights considered for <strong>the</strong> 2009 - 2012 price regulation period<br />
13. Quantity used to calculate 2010 prices with weighted averages<br />
Table 7.4.2.<br />
annual report 2009 | 75