Management of the Hungarian Energy Office - Magyar Energia Hivatal
Management of the Hungarian Energy Office - Magyar Energia Hivatal Management of the Hungarian Energy Office - Magyar Energia Hivatal
hungarian energy office The Yearly Average Statistical Number of Employees of Gas Supply Companies annual report 2009 | 66 1990 1995 2000 2005 2006 2007 2008 2009 Total 12 448 10 276 6 715 5 970 5 643 5 680 5 505 5 275 of which: distribution activity 3 342 2 657 2 712 3 203 public utility provider* 807 487 385 2 072 * in 2009 universal suppliers Important (Year-End) Data on the Natural Gas Supply 2004 2005 2006 2007 2008 2009 Length of distribution network km 79 377 80 519 80 825 81 335 81 627 81 798 Number of consumers 1000 pc 3 295 3 364 3 428 3 477 3 515 3 527 of which: household consumers 1000 pc 3 106 3 166 3 224 3 270 3 306 3 317 Number of settlements connected to the natural gas pipeline network Number of settlements connected in the actual year Natural Gas (Peak Day) Load Data National total of which: distributors total consumers directly supplied by transmission pipeline, total pc 2 858 2 871 2 887 2 891 2 892 2 895 pc 7 13 16 4 1 3 1990 54 923 42 606 12 317 1995 64 472 53 938 10 534 2000 73 658 65 878 7 780 2005 2006 91 665 89 006 75 600 78 655 16 065 9 936 2007 2008 2009 76 245 79 052 74 317 61 233 66 653 63 178 13 444 12 136 11 139 Table 5.3 (capita) Table 5.4 Table 5.5 (1000 m 3 /day)
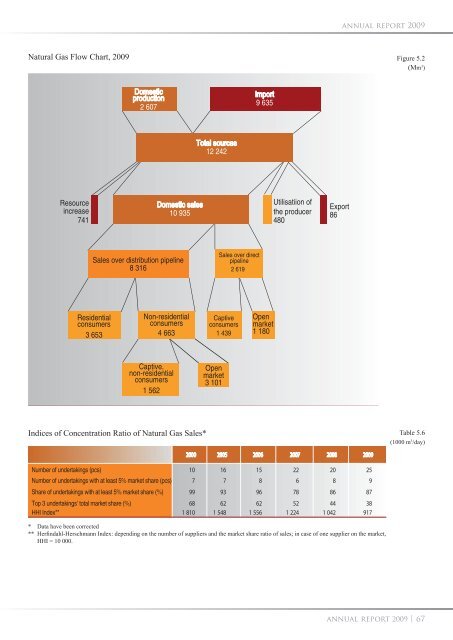
Resource increase 741 Domestic production 2 607 Captive, non-residential consumers 1 562 Domestic sales 10 935 Sales over distribution pipeline 8 316 Residential consumers 3 653 Total sources 12 242 Sales over direct pipeline 2 619 Non-residential consumers Captive consumers 4 663 1 439 Open market 3 101 Import 9 635 Open market 1 180 Utilisatiion of the producer 480 Export 86 annual report 2009 Natural Gas Flow Chart, 2009 Figure 5.2 (Mm 3 ) Indices of Concentration Ratio of Natural Gas Sales* 2000 2005 2006 2007 2008 2009 Number of undertakings (pcs) 10 16 15 22 20 25 Number of undertakings with at least 5% market share (pcs) 7 7 8 6 8 9 Share of undertakings with at least 5% market share (%) 99 93 96 78 86 87 Top 3 undertakings’ total market share (%) 68 62 62 52 44 38 HHI Index** 1 810 1 548 1 556 1 224 1 042 917 * Data have been corrected ** Herfi ndahl-Herschmann Index: depending on the number of suppliers and the market share ratio of sales; in case of one supplier on the market, HHI = 10 000. Table 5.6 (1000 m3 /day) annual report 2009 | 67
- Page 16 and 17: hungarian energy office COMPETITION
- Page 18 and 19: hungarian energy office (Table 4).
- Page 20 and 21: hungarian energy office Small custo
- Page 22 and 23: hungarian energy office • By Dece
- Page 24 and 25: hungarian energy office High voltag
- Page 26 and 27: hungarian energy office Trading mar
- Page 28 and 29: hungarian energy office In 2009, fo
- Page 30 and 31: hungarian energy office REGULATION
- Page 32 and 33: hungarian energy office for natural
- Page 34 and 35: hungarian energy office outages, wh
- Page 36 and 37: hungarian energy office The dispatc
- Page 38 and 39: hungarian energy office HUF/GJ 3 50
- Page 40 and 41: hungarian energy office Service qua
- Page 42 and 43: hungarian energy office REGULATION
- Page 44 and 45: hungarian energy office ENERGY SAVI
- Page 46 and 47: hungarian energy office energy mix
- Page 48 and 49: hungarian energy office appropriati
- Page 50 and 51: hungarian energy office GDP, Electr
- Page 52 and 53: hungarian energy office Trend of Na
- Page 54 and 55: hungarian energy office Development
- Page 56 and 57: hungarian energy office 4. DATA ON
- Page 58 and 59: hungarian energy office The Yearly
- Page 60 and 61: hungarian energy office Data on Bre
- Page 62 and 63: hungarian energy office Purchase of
- Page 64 and 65: hungarian energy office 5. DATA ON
- Page 68 and 69: hungarian energy office Summary Dat
- Page 70 and 71: hungarian energy office Typical Ind
- Page 72 and 73: hungarian energy office Residential
- Page 74 and 75: hungarian energy office Regulated E
- Page 76 and 77: Table 7.5 Natural Gas Tariffs Valid
- Page 78 and 79: hungarian energy office Natural Gas
- Page 80 and 81: hungarian energy office 3. Storage
- Page 82 and 83: hungarian energy office Govt. Decre
- Page 84: hungarian energy office DIRECTIVES
Resource<br />
increase<br />
741<br />
Domestic<br />
production<br />
2 607<br />
Captive,<br />
non-residential<br />
consumers<br />
1 562<br />
Domestic sales<br />
10 935<br />
Sales over distribution pipeline<br />
8 316<br />
Residential<br />
consumers<br />
3 653<br />
Total sources<br />
12 242<br />
Sales over direct<br />
pipeline<br />
2 619<br />
Non-residential<br />
consumers<br />
Captive<br />
consumers<br />
4 663 1 439<br />
Open<br />
market<br />
3 101<br />
Import<br />
9 635<br />
Open<br />
market<br />
1 180<br />
Utilisatiion <strong>of</strong><br />
<strong>the</strong> producer<br />
480<br />
Export<br />
86<br />
annual report 2009<br />
Natural Gas Flow Chart, 2009 Figure 5.2<br />
(Mm 3 )<br />
Indices <strong>of</strong> Concentration Ratio <strong>of</strong> Natural Gas Sales*<br />
2000 2005 2006 2007 2008 2009<br />
Number <strong>of</strong> undertakings (pcs) 10 16 15 22 20 25<br />
Number <strong>of</strong> undertakings with at least 5% market share (pcs) 7 7 8 6 8 9<br />
Share <strong>of</strong> undertakings with at least 5% market share (%) 99 93 96 78 86 87<br />
Top 3 undertakings’ total market share (%) 68 62 62 52 44 38<br />
HHI Index** 1 810 1 548 1 556 1 224 1 042 917<br />
* Data have been corrected<br />
** Herfi ndahl-Herschmann Index: depending on <strong>the</strong> number <strong>of</strong> suppliers and <strong>the</strong> market share ratio <strong>of</strong> sales; in case <strong>of</strong> one supplier on <strong>the</strong> market,<br />
HHI = 10 000.<br />
Table 5.6<br />
(1000 m3 /day)<br />
annual report 2009 | 67


