Management of the Hungarian Energy Office - Magyar Energia Hivatal
Management of the Hungarian Energy Office - Magyar Energia Hivatal
Management of the Hungarian Energy Office - Magyar Energia Hivatal

Create successful ePaper yourself
Turn your PDF publications into a flip-book with our unique Google optimized e-Paper software.
hungarian energy <strong>of</strong>fice<br />
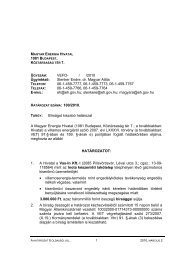
The Yearly Average Statistical Number <strong>of</strong> Employees <strong>of</strong> Electricity Companies<br />
1990 1995 2000 2005 2006 2007 2008 2009<br />
TOTAL 38 460 43 693 29 910 19 852 18 299 12 844 12 960 11 596<br />
<strong>of</strong> which: electricity generation companies*<br />
electricity transmission, distribution<br />
and system operation companies<br />
* Companies operating a power plant with a minimum installed capacity <strong>of</strong> 50 MW<br />
annual report 2009 | 58<br />
1990 1995 2000 2005 2006 2007 2008<br />
Installed capacity 7 177 7 288 7 855 8 588 8 620 8 846 9 100<br />
Available capacity 7 065 6 982 7 601 8 080 8 197 8 253 8 476<br />
Usable capacity 5 376 5 618 6 591 7 021 6 984 7 190 7 258<br />
Actually usable capacity 5 286 5 468 6 349 6 741 6 625 6 872 6 979<br />
Peak-power station load 3 635 4 383 4 425 4 457 4 529 5 107 5 816<br />
Import-Export balance 1 751 415 465 945 1 002 559 572 1 009<br />
Maximum peak load 6 534 5 731 5 742 6 439 6 432 6 602 6 388 6 380<br />
2009<br />
9 163<br />
8 359<br />
7 128<br />
6 994<br />
5 371<br />
Table 4.3<br />
Typical Capacities <strong>of</strong> <strong>the</strong> <strong>Hungarian</strong> Electricity System (annual average weekday peak*) Table 4.4<br />
* Until 1995 weekdays, from 2000 annual average peak load <strong>of</strong> calendar days<br />
23 997 17 626 10 269 9 838 9 726 9 509 9 137<br />
19 696 12 284 9 400 7 816 2 611 1 861 1 861<br />
Electricity Generation Capacity by <strong>Energy</strong> Source Used Table 4.5<br />
1990 1995 2000 2005 2006 2007 2008<br />
Coal 8 154 8 615 8 888 6 977 6 967 7 350 6 928<br />
Hydrocarbons 5 249 10 174 10 958 12 803 13 511 15 784 15 672<br />
<strong>of</strong> which: gas engines - - - 2 034 2 627 2 748 3 133<br />
Nuclear power 13 731 14 026 14 180 13 834 13 461 14 677 14 818<br />
Hydro-power 178 163 178 203 186 210 213<br />
Wind power - - - 10 43 110 205<br />
O<strong>the</strong>r renewable energy resources and waste 135 220 216 1 929 1 690 1 828 2 190<br />
Total 27 447 33 198 34 420 35 755 35 859 39 959 40 026<br />
2009<br />
6 346<br />
11 034<br />
2 880<br />
15 426<br />
228<br />
331<br />
2 444<br />
35 810<br />
(capita)<br />
(MW)<br />
(GWh)