Management of the Hungarian Energy Office - Magyar Energia Hivatal
Management of the Hungarian Energy Office - Magyar Energia Hivatal
Management of the Hungarian Energy Office - Magyar Energia Hivatal

You also want an ePaper? Increase the reach of your titles
YUMPU automatically turns print PDFs into web optimized ePapers that Google loves.
hungarian energy <strong>of</strong>fice<br />
Service quality<br />
With regard to <strong>the</strong> resolution <strong>of</strong> HEO issued for <strong>the</strong><br />
distribution licensees on 1 January 2004 and amended in April<br />
2005, concerning <strong>the</strong> ‘determination <strong>of</strong> <strong>the</strong> minimum quality<br />
requirements <strong>of</strong> natural gas distribution, and <strong>the</strong> expected<br />
quality level <strong>of</strong> supply’, HEO issued 5 amendments to <strong>the</strong><br />
resolution for <strong>the</strong> fi ve licensees having <strong>the</strong> largest customer<br />
base. New resolutions were issued for 3 licensees with smaller<br />
client bases as well. The new and <strong>the</strong> modifi ed resolutions set<br />
<strong>the</strong> required values <strong>of</strong> <strong>the</strong> operational reliability indicators for<br />
<strong>the</strong> years 2009 and 2010.<br />
Instead <strong>of</strong> issuing resolutions concerning <strong>the</strong> ‘determination <strong>of</strong><br />
<strong>the</strong> minimum quality requirements <strong>of</strong> natural gas distribution,<br />
and <strong>the</strong> expected quality level <strong>of</strong> supply’, HEO issued a total<br />
<strong>of</strong> 9 supply quality resolutions on client service in 2009 for<br />
distribution licensees and universal service licensees. The<br />
resolutions – in line with <strong>the</strong> directives that have already<br />
worked out in <strong>the</strong> electricity industry – defi ne requirements<br />
on personal, written, and phone-based customer relations.<br />
Requirements can be classifi ed in three groups depending on<br />
what consequences are drawn if <strong>the</strong>y failed to be fulfi lled.<br />
The fi rst group includes <strong>the</strong> minimum quality requirements<br />
that – if not observed – lead to <strong>the</strong> imposition <strong>of</strong> fi nes. The<br />
second group contains indicators in accordance with <strong>the</strong><br />
statutory provisions, and characteristic for <strong>the</strong> activities <strong>of</strong><br />
<strong>the</strong> licensee, defi ning expected quality levels <strong>of</strong> supply. The<br />
third group contains <strong>the</strong> monitoring-type indicators, which<br />
provide information for HEO<br />
for <strong>the</strong> future fi ne-tuning <strong>of</strong><br />
<strong>the</strong> regulation. The maximum<br />
amount <strong>of</strong> fi ne to be imposed<br />
if requirements are not fi lfi lled<br />
may be HUF 50 million, or<br />
HUF 100 million depending on<br />
<strong>the</strong> extent <strong>of</strong> discrepancy.<br />
In 2009, HEO prepared for<br />
<strong>the</strong> fourteenth time <strong>the</strong> study<br />
measuring <strong>the</strong> satisfaction <strong>of</strong><br />
<strong>the</strong> customers with distribution<br />
licensees and universal service<br />
(public utility supply)<br />
licensees. In <strong>the</strong> course <strong>of</strong> collecting <strong>the</strong> data,<br />
<strong>the</strong> opinion <strong>of</strong> 7400 household consumers and<br />
2400 industrial customers was surveyed. The<br />
methodology <strong>of</strong> <strong>the</strong> survey was identical with<br />
<strong>the</strong> procedure applied in 2008, thus <strong>the</strong> results<br />
obtained can also be compared numerically,<br />
directly. The transformation <strong>of</strong> <strong>the</strong> licensees –<br />
although <strong>the</strong> content and <strong>the</strong> method is <strong>the</strong> same<br />
– required HEO to issue 5 new resolutions in<br />
order to establish <strong>the</strong> base <strong>of</strong> <strong>the</strong> survey.<br />
The aggregated results suggest that 2009 did<br />
not bring any signifi cant changes relative to<br />
<strong>the</strong> trends perceived so far. The customers’<br />
priorities are still <strong>the</strong> uninterrupted supply<br />
and <strong>the</strong> precise consumption metering from<br />
among <strong>the</strong> activities <strong>of</strong> <strong>the</strong> distribution<br />
annual report 2009 | 40<br />
licensees. The majority <strong>of</strong> customers were satisfi ed with <strong>the</strong>se<br />
services in 2009 as well. With regard to <strong>the</strong> responsibilities<br />
<strong>of</strong> <strong>the</strong> universal service licensee, <strong>the</strong> quick and pr<strong>of</strong>essional<br />
administration at client services, understandable bills and<br />
<strong>the</strong> availability <strong>of</strong> complaint possibilities were considered<br />
important by customers. Similarly to <strong>the</strong> previous year, <strong>the</strong><br />
satisfaction values <strong>of</strong> understandability <strong>of</strong> bills, complaint management<br />
and <strong>the</strong> availability <strong>of</strong> call centres lagged behind <strong>the</strong><br />
expected values.<br />
Interruptions<br />
The consumers expect continuous supply, i.e. a uninterrupted<br />
availability <strong>of</strong> natural gas. Pipelined natural gas supply are<br />
certainly accompanied by various coincidental or planned or<br />
o<strong>the</strong>rwise caused interruptions. Interruptions can be caused by<br />
breakdowns on <strong>the</strong> one hand, and by maintenance or o<strong>the</strong>r<br />
reconstruction works, on <strong>the</strong> o<strong>the</strong>r hand. The quality <strong>of</strong> <strong>the</strong><br />
physical process <strong>of</strong> pipeplined natural gas supply can be<br />
assessed and demonstrated by <strong>the</strong> cause, time and duration <strong>of</strong><br />
interruptions.<br />
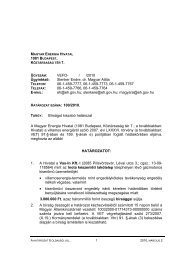
The development <strong>of</strong> <strong>the</strong> number <strong>of</strong> interruptions is depicted<br />
in Figure 11 based on <strong>the</strong> data <strong>of</strong> Table 16. The Figure<br />
shows that <strong>the</strong> consumers were affected by <strong>the</strong> interruptions<br />
to an increasing-decreasing extent. The proportion and<br />
absolute number <strong>of</strong> <strong>the</strong> outages where <strong>the</strong> suppliers were<br />
directly responsible increased in <strong>the</strong> fi rst half <strong>of</strong> <strong>the</strong> period,<br />
Description/year 2000 2001 2002 2003 2004 2005 2006 2007 2008<br />
Number <strong>of</strong> events causing<br />
interruption<br />
2 862 3 138 3 924 2 802 2 103 2 049 2 368 1 666 1 410<br />
Within which: interruptions<br />
due to breakdown<br />
Number <strong>of</strong> interruptions<br />
2 532 2 604 2 988 2 424 1 786 1 848 1 953 1 440 1 173<br />
with direct responsibility<br />
<strong>of</strong> suppliers<br />
1 473 1 312 1 607 1 090 989 853 847 705 760<br />
Within which: breakdowns<br />
with direct responsibility<br />
<strong>of</strong> suppliers<br />
4500<br />
4000<br />
3500<br />
3000<br />
2500<br />
2000<br />
1500<br />
1000<br />
500<br />
0<br />
Table 16 Frequency <strong>of</strong> breakdowns<br />
1 222 894 933 731 743 738 707 574 614<br />
2000 2001 2002 2003 2004 2005 2006 2007 2008<br />
Number <strong>of</strong> events causing interruptions<br />
Number <strong>of</strong> interruptions with direct responsibility <strong>of</strong> suppliers<br />
There<strong>of</strong> <strong>the</strong> number <strong>of</strong> breakdowns with direct responsibility <strong>of</strong> suppliers<br />
Figure 11 Quantitative data <strong>of</strong> <strong>the</strong> events causing interruptions in natural gas<br />
supply between 2000 and 2008 [pcs/year]