Management of the Hungarian Energy Office - Magyar Energia Hivatal
Management of the Hungarian Energy Office - Magyar Energia Hivatal
Management of the Hungarian Energy Office - Magyar Energia Hivatal

You also want an ePaper? Increase the reach of your titles
YUMPU automatically turns print PDFs into web optimized ePapers that Google loves.
hungarian energy <strong>of</strong>fice<br />
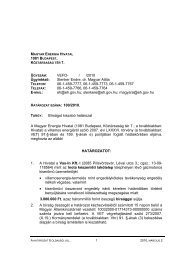
High voltage<br />
connection<br />
Connection to<br />
high/medium voltage<br />
transformer<br />
Medium voltage<br />
connection<br />
Connection to<br />
medium/low voltage<br />
transformer<br />
Low voltage<br />
3<br />
connection I.<br />
Low voltage<br />
connection II. (controlled)<br />
Low voltage<br />
4<br />
connection III.<br />
Average<br />
There is a signifi cant standard variation (varying between<br />
-2.86% and +4.1%) <strong>of</strong> feed-in price changes on 1 January 2010<br />
– again, due to <strong>the</strong> different price regulation <strong>of</strong> <strong>the</strong> various<br />
energy sources (prices <strong>of</strong> gas fuelled CHP decreased due to<br />
a fur<strong>the</strong>r decrease in gas prices in January, while <strong>the</strong> feed-in<br />
prices <strong>of</strong> electricity from o<strong>the</strong>r CHP, waste and renewables<br />
grew in line with <strong>the</strong> taking into account <strong>of</strong> infl ation in a<br />
different measure). Changes in feed-in prices <strong>of</strong> gas fuelled<br />
electricity production after 1 July 2009 is adequate to <strong>the</strong><br />
index <strong>of</strong> gas price change calculated in accordance with <strong>the</strong><br />
provisions <strong>of</strong> Government Decree 389/2007 (23.12).<br />
There were not any signifi cant changes in o<strong>the</strong>r terms <strong>of</strong><br />
<strong>the</strong> feed in <strong>of</strong> electricity sold in <strong>the</strong> framework <strong>of</strong> feed-in<br />
obligation at supported price in 2009.<br />
With regard to wind power plants, which drew special<br />
attention because <strong>of</strong> <strong>the</strong> keen interest and <strong>the</strong> diffi culties in<br />
<strong>the</strong> operability <strong>of</strong> <strong>the</strong> system, HEO issued operational licenses<br />
representing a total capacity <strong>of</strong> 330 MW, from which 176 MW<br />
was in operation by <strong>the</strong> end <strong>of</strong> 2009. On <strong>the</strong> basis <strong>of</strong> <strong>the</strong> new<br />
Act and <strong>the</strong> secondary legislation on its enforcement, fur<strong>the</strong>r<br />
similar capacities can obtain a license and connect to <strong>the</strong><br />
system <strong>of</strong> feed-in obligation only by tendering. Accordingly,<br />
HEO, following <strong>the</strong> preparation and <strong>the</strong> publication <strong>of</strong> KHEM<br />
Decree 33/2009 (30.06) regulating <strong>the</strong> terms <strong>of</strong> tendering,<br />
called for tenders to establish new wind power plant capacity<br />
annual report 2009 | 24<br />
2<br />
6. b) (Average) Distribution charges and average changes <strong>the</strong>re<strong>of</strong><br />
(calculated on <strong>the</strong> basis <strong>of</strong> similar quantity weights)<br />
From<br />
January<br />
5 2008<br />
0.709<br />
1.842<br />
3.606<br />
6.425<br />
11.605<br />
4.750<br />
10.367<br />
6.845<br />
Tariffs<br />
From From<br />
January January<br />
5<br />
6<br />
2009 2009<br />
0.969<br />
2.247<br />
4.275<br />
6.260<br />
13.601<br />
6.357<br />
12.070<br />
8.046<br />
1.017<br />
2.647<br />
4.230<br />
6.338<br />
13.647<br />
6.325<br />
12.705<br />
8.001<br />
From<br />
January<br />
6 2010<br />
0.672<br />
2.176<br />
4.158<br />
6.141<br />
13.889<br />
6.134<br />
12.566<br />
7.967<br />
Remarks:<br />
1. In <strong>the</strong> indicated period prior to 30 June 2009 20%, and 25% since 1 July 2009.<br />
2. Excluding charges for distribution schedule balancing calculated with average quantity data according to categories.<br />
3. In <strong>the</strong> case <strong>of</strong> contracted capacities not exceeding 3*50 A in 2008, and 3*80 A from 2009.<br />
4. in <strong>the</strong> case <strong>of</strong> contracted capacities exceeding 3*50 A in 2008 and 3*80 A from 2009.<br />
5. Calculated with quantity weights taken into account in <strong>the</strong> calculation <strong>of</strong> prices for 2009.<br />
6. Calculated with quantity weights taken into account in <strong>the</strong> calculation <strong>of</strong> prices for 2010.<br />
Changes in tariffs<br />
January<br />
2009<br />
36.6%<br />
22.0%<br />
18.5%<br />
-2.6%<br />
17.2%<br />
33.8%<br />
16.4%<br />
17.5%<br />
January<br />
2010<br />
-33.9%<br />
-17.8%<br />
-1.7%<br />
-3.0%<br />
1.8%<br />
-3.0%<br />
-1.1%<br />
-0.4%