Management of the Hungarian Energy Office - Magyar Energia Hivatal
Management of the Hungarian Energy Office - Magyar Energia Hivatal
Management of the Hungarian Energy Office - Magyar Energia Hivatal

You also want an ePaper? Increase the reach of your titles
YUMPU automatically turns print PDFs into web optimized ePapers that Google loves.
hungarian energy <strong>of</strong>fice<br />
COMPETITION<br />
In 2009, <strong>the</strong> operation <strong>of</strong> <strong>the</strong> <strong>Hungarian</strong> electricity market was<br />
determined by <strong>the</strong> demand decreasing effect <strong>of</strong> <strong>the</strong> crisis and<br />
<strong>the</strong> transformation at <strong>the</strong> end <strong>of</strong> 2008 <strong>of</strong> <strong>the</strong> previous system<br />
that was based on long term PPAs concluded between MVM<br />
and power plants. The basic elements <strong>of</strong> <strong>the</strong> regulation based<br />
on <strong>the</strong> parallel operation <strong>of</strong> universal service and free market<br />
has remained unchanged.<br />
In 2009, <strong>the</strong> circle <strong>of</strong> customers entitled for universal service<br />
was extended by an amendment in law in 2008. The Gas<br />
Act passed on 9 June 2008 increased <strong>the</strong> limit for connection<br />
capacity entitling for universal service to 3x63 A and extended<br />
<strong>the</strong> right for universal service to given general government units specifi ed in a separate legislation, local governments,<br />
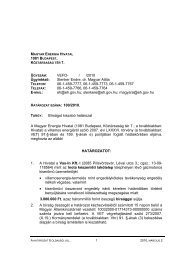
Table 1 Share <strong>of</strong> regulated (public utility segment and universal service) and free<br />
market consumption in total consumption (%)<br />
Free market<br />
2004 2005 2006 2007 2008 2009<br />
20.0 32.8 36.7 21.9 64.4 60.0<br />
Public utility 80.0 67.2 63.3 78.1 35.6 40.0<br />
Table 2 Market share <strong>of</strong> domestic power plant companies (groups) in terms <strong>of</strong><br />
installed capacity (2007) and production (2009) 1<br />
2<br />
MVM<br />
3<br />
Electrabel<br />
4<br />
AES<br />
5<br />
RWE<br />
6<br />
Atel<br />
7 EdF<br />
O<strong>the</strong>r domestic power plants<br />
Total domestic power plant<br />
Net import<br />
Gross consumption<br />
The 3 largest power plant<br />
9 companies<br />
HHI-index 10<br />
annual report 2009 | 16<br />
Installed<br />
capacities<br />
(MW)<br />
<br />
<br />
<br />
863<br />
<br />
<br />
<br />
8 846<br />
-<br />
5 433<br />
Market<br />
shares<br />
(in terms <strong>of</strong><br />
capacity)<br />
<br />
<br />
14%<br />
<br />
4%<br />
5%<br />
<br />
<br />
-<br />
<br />
<br />
1. Power plant companies in <strong>the</strong> Table correspond to investor groups owning<br />
power plants. To be simple, we did not try to exclude power plant units<br />
active in <strong>the</strong> market <strong>of</strong> ancillary services (e.g.. Dunamenti F, or AES Tisza<br />
blocks)<br />
2. MVM: Paksi Atomerőmű Zrt. (Paks Nuclear Power Plant), Vértesi Erőmű<br />
Zrt. (Vértes Power Plant), Gázturbinás Erőműveket Üzemeltető és<br />
Karbantartó Kft. (an Ltd. operating and maintaining gas engine power<br />
plants)<br />
3. Electrabel: Dunamenti Erőmű Zrt.<br />
4. AES: AES-Tisza Erőmű Kft, AES Borsod Energetikai Kft.<br />
5. RWE: Mátrai Erőmű Zrt.<br />
6. Atel (Alpiq since 1 February 2010): Csepeli Áramtermelő Kft.<br />
7. EdF: Budapesti Erőmű Zrt.<br />
8. Total share <strong>of</strong> power plant investors having a market share <strong>of</strong> less than 5%<br />
9. The three largest power plant companies calculated on <strong>the</strong> basis <strong>of</strong><br />
installed capacities (MVM, Electrabel, AES) differs from <strong>the</strong> three largest<br />
ones calculated on <strong>the</strong> basis <strong>of</strong> production (MVM, RWE, AES).<br />
10. Compensation values would be higher if available or <strong>the</strong> effectively<br />
accessable capacity were taken into account, and lower if import<br />
capacities were taken into account<br />
11. Calculated based on gross installed capacity data (fi gures <strong>of</strong> 2007).<br />
12. (Net) production <strong>of</strong> a given power plant company fed in into <strong>the</strong> network<br />
devided by national gross consumption (fi gures <strong>of</strong> <strong>the</strong> year 2009).<br />
8<br />
Production<br />
(TWh)<br />
15.1<br />
1.5<br />
1.6<br />
5.1<br />
<br />
<br />
<br />
<br />
<br />
<br />
<br />
Market<br />
shares<br />
(in terms <strong>of</strong><br />
production)<br />
46%<br />
5%<br />
5%<br />
16%<br />
3%<br />
<br />
<br />
83%<br />
<br />
<br />
11 12<br />
56%<br />
1 813<br />
local government units performing public<br />
tasks, legal entities <strong>of</strong> churches performing<br />
public tasks and institutions maintained<br />
by foundation, performing public tasks.<br />
The extended circle <strong>of</strong> customers entitled<br />
for universal service resulted in <strong>the</strong> fact that<br />
several medium and small size customers<br />
left free market by 2009. Therefore, <strong>the</strong><br />
share <strong>of</strong> <strong>the</strong> customers circle affected by<br />
administrative price regulation shifted<br />
from 36% to 40% <strong>of</strong> <strong>the</strong> total consumption.<br />
(The structure <strong>of</strong> <strong>the</strong> decline in demand<br />
also contributed to <strong>the</strong> decreased share<br />
<strong>of</strong> free market consumption: <strong>the</strong> demand/<br />
consumption <strong>of</strong> industrial customers<br />
buying electricity typically on free market<br />
dropped to a larger extent than that <strong>of</strong><br />
small and medium size customers opting<br />
for universal service.)<br />
The economic recession resulted in a<br />
decline in electricity consumption <strong>of</strong><br />
approximately 5%. Decreased demand<br />
was accompanied by a drastic fallback in<br />
<strong>the</strong> output <strong>of</strong> domestic power plants (10%)<br />
and by a signifi cant rise in net import. The<br />
total share <strong>of</strong> domestic producers within<br />
gross consumption dropped from 90% to<br />
83%, while <strong>the</strong> share <strong>of</strong> net import within gross consumption,<br />
which decreased temporarily to 10% in 2007-2008 compared<br />
to 15-20% in <strong>the</strong> year subsequent to market opening,<br />
approached 20% again in 2009.<br />
There was a signifi cant change in <strong>the</strong> relative market position<br />
<strong>of</strong> power plant investors: while <strong>the</strong> total production <strong>of</strong><br />
baseload producers (Paks, Mátra) slightly rose, production <strong>of</strong><br />
natural gas fuelled large power plants halved. Since <strong>the</strong> above<br />
baseload producers constituted a part <strong>of</strong> MVM’s contracted<br />
portfolio also in 2009, <strong>the</strong> MVM-focused nature <strong>of</strong> wholesale<br />
market failed to change; majority <strong>of</strong> electricity required to<br />
satisfy domestic consumption (near two thirds) was still sold<br />
through MVM group to universal service suppliers and traders<br />
supplying customers.