

Newark Bay Study - Passaic River Public Digital Library
Newark Bay Study - Passaic River Public Digital Library
Newark Bay Study - Passaic River Public Digital Library

Create successful ePaper yourself
Turn your PDF publications into a flip-book with our unique Google optimized e-Paper software.
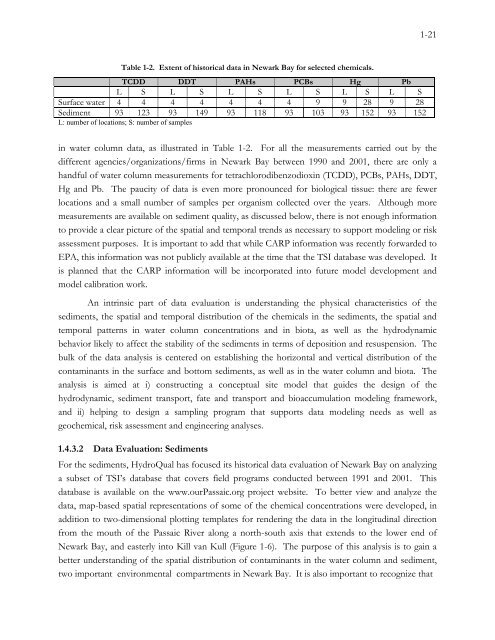
Table 1-2. Extent of historical data in <strong>Newark</strong> <strong>Bay</strong> for selected chemicals.<br />
TCDD DDT PAHs PCBs Hg Pb<br />
L S L S L S L S L S L S<br />
Surface water 4 4 4 4 4 4 4 9 9 28 9 28<br />
Sediment 93 123 93 149 93 118 93 103 93 152 93 152<br />
L: number of locations; S: number of samples<br />
1-21<br />
in water column data, as illustrated in Table 1-2. For all the measurements carried out by the<br />
different agencies/organizations/firms in <strong>Newark</strong> <strong>Bay</strong> between 1990 and 2001, there are only a<br />
handful of water column measurements for tetrachlorodibenzodioxin (TCDD), PCBs, PAHs, DDT,<br />
Hg and Pb. The paucity of data is even more pronounced for biological tissue: there are fewer<br />
locations and a small number of samples per organism collected over the years. Although more<br />
measurements are available on sediment quality, as discussed below, there is not enough information<br />
to provide a clear picture of the spatial and temporal trends as necessary to support modeling or risk<br />
assessment purposes. It is important to add that while CARP information was recently forwarded to<br />
EPA, this information was not publicly available at the time that the TSI database was developed. It<br />
is planned that the CARP information will be incorporated into future model development and<br />
model calibration work.<br />
An intrinsic part of data evaluation is understanding the physical characteristics of the<br />
sediments, the spatial and temporal distribution of the chemicals in the sediments, the spatial and<br />
temporal patterns in water column concentrations and in biota, as well as the hydrodynamic<br />
behavior likely to affect the stability of the sediments in terms of deposition and resuspension. The<br />
bulk of the data analysis is centered on establishing the horizontal and vertical distribution of the<br />
contaminants in the surface and bottom sediments, as well as in the water column and biota. The<br />
analysis is aimed at i) constructing a conceptual site model that guides the design of the<br />
hydrodynamic, sediment transport, fate and transport and bioaccumulation modeling framework,<br />
and ii) helping to design a sampling program that supports data modeling needs as well as<br />
geochemical, risk assessment and engineering analyses.<br />
1.4.3.2 Data Evaluation: Sediments<br />
For the sediments, HydroQual has focused its historical data evaluation of <strong>Newark</strong> <strong>Bay</strong> on analyzing<br />
a subset of TSI’s database that covers field programs conducted between 1991 and 2001. This<br />
database is available on the www.our<strong>Passaic</strong>.org project website. To better view and analyze the<br />
data, map-based spatial representations of some of the chemical concentrations were developed, in<br />
addition to two-dimensional plotting templates for rendering the data in the longitudinal direction<br />
from the mouth of the <strong>Passaic</strong> <strong>River</strong> along a north-south axis that extends to the lower end of<br />
<strong>Newark</strong> <strong>Bay</strong>, and easterly into Kill van Kull (Figure 1-6). The purpose of this analysis is to gain a<br />
better understanding of the spatial distribution of contaminants in the water column and sediment,<br />
two important environmental compartments in <strong>Newark</strong> <strong>Bay</strong>. It is also important to recognize that

