- Page 1 and 2: Appendix C Risk Assessment Draft Co
- Page 3 and 4: This page intentionally left blank
- Page 5 and 6: 8.2.4 Alternative Risk Reduction Co
- Page 7 and 8: Table 8-2. Summary of Risks/Hazards
- Page 9 and 10: This page intentionally left blank
- Page 11 and 12: HPAH High molecular weight PAH HQ H
- Page 13 and 14: This page intentionally left blank
- Page 15 and 16: This page intentionally left blank
- Page 17 and 18: Table 2-1. Summary of Data Used for
- Page 19 and 20: Figure 2-1. Sediment Sampling Locat
- Page 21 and 22: For this biological and sediment da
- Page 23 and 24: Table 2-3. Sample Matrices for Crab
- Page 25 and 26: concentrations (EPC) derived using
- Page 27 and 28: This page intentionally left blank
- Page 29 and 30: all of these erosional areas are be
- Page 31 and 32: Angler/Sportsman: The angler/sports
- Page 33 and 34: • AE(4): Protection and maintenan
- Page 35 and 36: Draft Focused Feasibility Study Ris
- Page 37 and 38: 5.0 HUMAN HEALTH RISK ASSESSMENT -
- Page 39 and 40: overabundant quantities. White catf
- Page 41 and 42: gland under the gills). The anatomy
- Page 43 and 44: State Department of Health [NYSDOH]
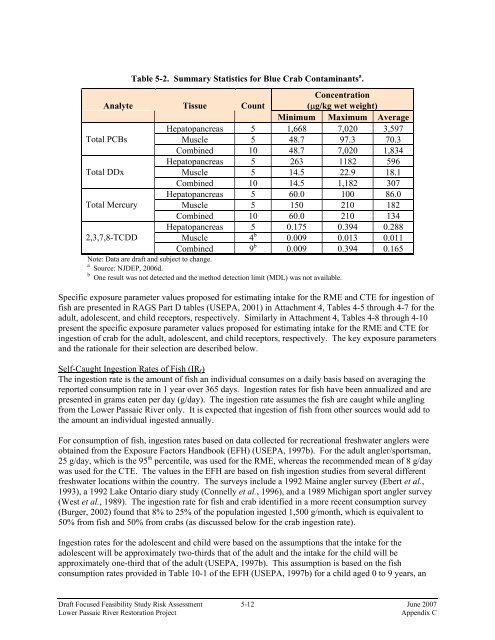
- Page 45 and 46: through 5-7 for 2,3,7,8-TCDD, total
- Page 47: µg/kg 100 90 80 70 60 50 40 30 20
- Page 51 and 52: Crab consumption data were obtained
- Page 53 and 54: Draft Focused Feasibility Study Ris
- Page 55 and 56: have shown that mercury concentrati
- Page 57 and 58: Toxicity studies with laboratory an
- Page 59 and 60: accordance with USEPA’s guideline
- Page 61 and 62: The noncancer HIs are summarized in
- Page 63 and 64: There is a concern for the potentia
- Page 65 and 66: chemical risk drivers, were extensi
- Page 67 and 68: Draft Focused Feasibility Study Ris
- Page 69 and 70: Draft Focused Feasibility Study Ris
- Page 71 and 72: Table 6-1. Exposure Parameters for
- Page 73 and 74: apidly metabolizing PAHs, the etiol
- Page 75 and 76: Table 6-4. Summary of CBRs for Vari
- Page 77 and 78: exposure to inorganic lead (other t
- Page 79 and 80: PAHs, which generally occur as comp
- Page 81 and 82: Table 6-10. Summary of Mammalian TR
- Page 83 and 84: Table 6-13. Summary of Avian Egg Re
- Page 85 and 86: irds), neurological (tremors in sev
- Page 87 and 88: Table 6-16. Summary of Hazard Quoti
- Page 89 and 90: Hazard Indices 100,000 10,000 1,000
- Page 91 and 92: Hazard Ratio 10000 1000 100 10 1 0.
- Page 93 and 94: 6.3.4 Summary of Current Risks The
- Page 95 and 96: and that, overall, the risk assessm
- Page 97 and 98: Draft Focused Feasibility Study Ris
- Page 99 and 100:
Draft Focused Feasibility Study Ris
- Page 101 and 102:
7.0 DEVELOPMENT OF EPCs FOR FUTURE
- Page 103 and 104:
concentrations generated directly f
- Page 105 and 106:
Table 7-1. A Ratio of 1995 TSI Surf
- Page 107 and 108:
COPC/COPEC Ratio of Sediment Histor
- Page 109 and 110:
Ratio of Sediment Historical 95% UC
- Page 111 and 112:
COPC/COPEC Table 7-7. Summary of 95
- Page 113 and 114:
8.0 REMEDIAL ALTERNATIVES FUTURE RI
- Page 115 and 116:
Draft Focused Feasibility Study Ris
- Page 117 and 118:
Table 8-5. Summary of Future Cancer
- Page 119 and 120:
physical processes (sedimentation,
- Page 121 and 122:
8.1.4 Alternative Risk Reduction Co
- Page 123 and 124:
8.1.1.2 Comparison Among Remediatio
- Page 125 and 126:
Information supporting the assessme
- Page 127 and 128:
Draft Focused Feasibility Study Ris
- Page 129 and 130:
NOAEL- and LOAEL-based HIs for the
- Page 131 and 132:
Hazard Ratio Hazard Index 10000 100
- Page 133 and 134:
Draft Focused Feasibility Study Ris
- Page 135 and 136:
Figure 8-3 presents the current and
- Page 137 and 138:
Draft Focused Feasibility Study Ris
- Page 139 and 140:
surveys) for the Lower Passaic Rive
- Page 141 and 142:
Table 8-15. Lower Passaic River Hig
- Page 143 and 144:
pathway is typically associated wit
- Page 145 and 146:
9.0 SUMMARY AND CONCLUSIONS Results
- Page 147 and 148:
health hazards. Based on body weigh
- Page 149 and 150:
Table 9-3. Summary of Estimated Fut
- Page 151 and 152:
In general, six sets of future EPCs
- Page 153 and 154:
10.0 REFERENCES Agency for Toxic Su
- Page 155 and 156:
Brunstom, B. 1989. Toxicity of copl
- Page 157 and 158:
Eisler, R., 1988. Lead hazards to f
- Page 159 and 160:
Horne, M.T. and W.A. Dunson. 1995.
- Page 161 and 162:
McCarty, L.S., and D. Mackay, 1993.
- Page 163 and 164:
developing chicken embryo when inje
- Page 165 and 166:
United States Environmental Protect
- Page 167 and 168:
Organization Re-evaluation of Human
- Page 169 and 170:
ATTACHMENT 1 SUPPORTING DATA
- Page 171 and 172:
Attachment 1 Table 1-1 Summary of C
- Page 173 and 174:
Attachment 1 Table 1-3 Summary of P
- Page 175 and 176:
Attachment 1 Table 1-3 Summary of P
- Page 177 and 178:
Attachment 1 Table 1-3 Summary of P
- Page 179 and 180:
Attachment 1 Table 1-3 Summary of P
- Page 181 and 182:
Attachment 1 Table 1-4 Summary of S
- Page 183 and 184:
Attachment 1 Table 1-4 Summary of S
- Page 185 and 186:
ATTACHMENT 2 SCREENING PROCESS FOR
- Page 187 and 188:
Technical Memorandum Technical Appr
- Page 189 and 190:
Technical Memorandum February 21, 2
- Page 191 and 192:
Technical Memorandum February 21, 2
- Page 193 and 194:
CASRN Units Chemical Marine/ Estuar
- Page 195 and 196:
CASRN Units Chemical Marine/ Estuar
- Page 197 and 198:
CASRN Units Chemical Marine/ Estuar
- Page 199 and 200:
Technical Memorandum February 21, 2
- Page 201 and 202:
Technical Memorandum February 21, 2
- Page 203 and 204:
Technical Memorandum February 21, 2
- Page 205 and 206:
Technical Memorandum February 21, 2
- Page 207 and 208:
Technical Memorandum February 21, 2
- Page 209 and 210:
Technical Memorandum February 21, 2
- Page 211 and 212:
Technical Memorandum February 21, 2
- Page 213 and 214:
CASRN Chemical Units Min Value Qual
- Page 215 and 216:
Attachment A Analytical Data Summar
- Page 217 and 218:
Attachment B Derviation of Protecti
- Page 219 and 220:
Attachment C Supporting Data for PC
- Page 221 and 222:
This page intentionally left blank.
- Page 223 and 224:
Type HHRA Medium Crab Chemical Chlo
- Page 225 and 226:
Type HHRA Medium Crab Chemical DDD
- Page 227 and 228:
Type HHRA Medium Fish Chemical DDE
- Page 229 and 230:
Type HHRA Medium Fish Chemical DDT
- Page 231 and 232:
Type HHRA Medium Crab Chemical Diel
- Page 233 and 234:
Type HHRA Medium Crab Chemical Merc
- Page 235 and 236:
Type HHRA Medium Crab Chemical TCDD
- Page 237 and 238:
Type HHRA and ERA Medium Fish Chemi
- Page 239 and 240:
Type ERA Medium Mummichog Chemical
- Page 241 and 242:
Type ERA Medium Mummichog Chemical
- Page 243 and 244:
Type ERA Medium Mummichog Chemical
- Page 245 and 246:
Type ERA Medium Mummichog Chemical
- Page 247 and 248:
Type ERA Medium Mummichog Chemical
- Page 249 and 250:
Type ERA Medium Mummichog Chemical
- Page 251 and 252:
Type ERA Medium Mummichog Chemical
- Page 253 and 254:
Type ERA Medium Mummichog Chemical
- Page 255 and 256:
Type ERA Medium Mummichog Chemical
- Page 257 and 258:
Type ERA Medium Crab Chemical Chlor
- Page 259 and 260:
Type ERA Medium Crab Chemical DDx -
- Page 261 and 262:
Type ERA Medium Crab Chemical Lead
- Page 263 and 264:
Type ERA Medium Crab Chemical LPAH
- Page 265 and 266:
Type ERA Medium Crab Chemical TCDD
- Page 267 and 268:
Type ERA Medium Crab Chemical TCDD
- Page 269 and 270:
Type ERA Medium Crab Chemical TCDD
- Page 271 and 272:
Type ERA Medium Crab Chemical Total
- Page 273 and 274:
Type ERA Medium Crab Chemical Total
- Page 275 and 276:
Type ERA Medium Fish Chemical DDx -
- Page 277 and 278:
Type ERA Medium Fish (American eel/
- Page 279 and 280:
Type ERA Medium Fish (American eel/
- Page 281 and 282:
Type ERA Medium Fish (American eel/
- Page 283 and 284:
Type ERA and HHRA Medium Fish (Amer
- Page 285 and 286:
Type ERA Medium Fish (American eel/
- Page 287 and 288:
Type ERA Medium Fish (American eel/
- Page 289 and 290:
Type ERA Medium Sediment Chemical C
- Page 291 and 292:
Attachment 3 Type ERA Medium Sedime
- Page 293 and 294:
Attachment 3 Type HHRA Medium Sedim
- Page 295 and 296:
Type ERA Medium Sediment Chemical D
- Page 297 and 298:
Type ERA Medium Sediment Chemical M
- Page 299 and 300:
Type ERA Medium Sediment Chemical H
- Page 301 and 302:
Type ERA Medium Sediment Chemical T
- Page 303 and 304:
Type ERA Medium Sediment Chemical T
- Page 305 and 306:
Type ERA Medium Sediment Chemical T
- Page 307 and 308:
Type ERA Medium Sediment Chemical T
- Page 309 and 310:
Type ERA Medium Sediment Chemical T
- Page 311 and 312:
Type ERA Medium American eel/WhiteP
- Page 313 and 314:
Type ERA Medium American eel/WhiteP
- Page 315 and 316:
Type ERA Medium American eel/WhiteP
- Page 317 and 318:
Type ERA Medium American eel/WhiteP
- Page 319 and 320:
Type ERA Medium American eel/WhiteP
- Page 321 and 322:
Type ERA Medium American eel/WhiteP
- Page 323 and 324:
Type ERA Medium American eel/WhiteP
- Page 325 and 326:
Type ERA Medium American eel/WhiteP
- Page 327 and 328:
Type ERA Medium American eel/WhiteP
- Page 329 and 330:
Attachment 3 Type ERA Medium Americ
- Page 331 and 332:
Type ERA Medium American eel/WhiteP
- Page 333 and 334:
Type ERA Medium American eel/WhiteP
- Page 335 and 336:
Type ERA Medium American eel/WhiteP
- Page 337 and 338:
Type ERA Medium American eel/WhiteP
- Page 339 and 340:
Type ERA Medium American eel/WhiteP
- Page 341 and 342:
Type ERA Medium American eel/WhiteP
- Page 343 and 344:
Type ERA Medium Mummichog Chemical
- Page 345 and 346:
Type ERA Medium Mummichog Chemical
- Page 347 and 348:
Type ERA Medium Mummichog Chemical
- Page 349 and 350:
Type ERA Medium Mummichog Chemical
- Page 351 and 352:
Type ERA Medium Mummichog Chemical
- Page 353 and 354:
Type ERA Medium Mummichog Chemical
- Page 355 and 356:
Type ERA Medium Mummichog Chemical
- Page 357 and 358:
Type ERA Medium Mummichog Chemical
- Page 359 and 360:
Type ERA Medium Mummichog Chemical
- Page 361 and 362:
Attachment 3 Type ERA Medium Mummic
- Page 363 and 364:
Attachment 3 Type ERA Medium Mummic
- Page 365 and 366:
Attachment 3 Type ERA Medium Mummic
- Page 367 and 368:
Type ERA Medium Mummichog Chemical
- Page 369 and 370:
Attachment 3 Type ERE Medium Mummic
- Page 371 and 372:
Type ERE Medium Mummichog Chemical
- Page 373 and 374:
Type ERE Medium Mummichog Chemical
- Page 375 and 376:
Type ERE Medium Sediment Chemical 1
- Page 377 and 378:
Type ERE Medium Sediment Chemical 1
- Page 379 and 380:
Type ERE Medium Sediment Chemical 1
- Page 381 and 382:
Type ERE Medium Sediment Chemical 1
- Page 383 and 384:
Type ERE Medium Sediment Chemical 1
- Page 385 and 386:
Type ERE Medium Sediment Chemical 2
- Page 387 and 388:
Type ERE Medium Sediment Chemical 2
- Page 389 and 390:
Type ERE Medium Sediment Chemical O
- Page 391 and 392:
Type ERE Medium Sediment Chemical T
- Page 393 and 394:
Type ERE Medium Sediment Chemical 2
- Page 395 and 396:
Type ERE Medium Sediment Chemical 2
- Page 397 and 398:
Type ERE Medium Sediment Chemical 2
- Page 399 and 400:
Type ERE Medium Sediment Chemical 2
- Page 401 and 402:
Type ERE Medium Sediment Chemical 3
- Page 403 and 404:
Type ERE Medium Sediment Chemical 3
- Page 405 and 406:
ATTACHMENT 4 HUMAN HEALTH RISK - CU
- Page 407 and 408:
Scenario Timeframe: Current Medium:
- Page 409 and 410:
Scenario Timeframe: Current Medium:
- Page 411 and 412:
Scenario Timeframe: Current/Future
- Page 413 and 414:
Scenario Timeframe: Current/Future
- Page 415 and 416:
Scenario Timeframe: Current/Future
- Page 417 and 418:
Attachment 4 TABLE 4-11 (RAGS PT. D
- Page 419 and 420:
Scenario Timeframe: Current/Future
- Page 421 and 422:
Scenario Timeframe: Current/Future
- Page 423 and 424:
Scenario Timeframe: Current/Future
- Page 425 and 426:
Scenario Timeframe: Current/Future
- Page 427 and 428:
Scenario Timeframe: Current/Future
- Page 429 and 430:
Scenario Timeframe: Current/Future
- Page 431 and 432:
PCB ENHANCEMENT ASSESSMENT 25 of 32
- Page 433 and 434:
Attachment 4 and concern for assess
- Page 435 and 436:
Attachment 4 that the resulting ris
- Page 437 and 438:
Attachment 4 Table 2. Total Aroclor
- Page 439 and 440:
ATTACHMENT 5 CRITICAL BODY RESIDUES
- Page 441 and 442:
Tissue Concentration (ug/g wet weig
- Page 443 and 444:
Tissue Concentration (ug/g wet weig
- Page 445 and 446:
Tissue Concentration (ug/g wet weig
- Page 447 and 448:
Tissue Concentration (ug/g wet weig
- Page 449 and 450:
Tissue Concentration (ug/g wet weig
- Page 451 and 452:
Tissue Concentration (ug/g wet weig
- Page 453 and 454:
Tissue Concentration (ug/g wet weig
- Page 455 and 456:
Tissue Concentration (ug/g wet weig
- Page 457 and 458:
Species Scientific Name Ictalurus p
- Page 459 and 460:
Species Scientific Name Species Com
- Page 461 and 462:
Attachment 5 TABLE 5-3 SUMMARY OF A
- Page 463 and 464:
COPEC TABLE 5-4 CBR-BASED HAZARD QU
- Page 465 and 466:
COPEC TABLE 5-5 CBR-BASED HAZARD QU
- Page 467 and 468:
COPEC TABLE 5-6 CBR-BASED HAZARD QU
- Page 469 and 470:
ATTACHMENT 6 ECOLOGICAL RISK - CURR
- Page 471 and 472:
Hazard Indices Hazard Indices 100,0
- Page 473 and 474:
Attachment 6 TABLE 6-1 CBR-BASED HA
- Page 475 and 476:
Attachment 6 TABLE 6-2 CBR-BASED HA
- Page 477 and 478:
Attachment 6 TABLE 6-3 CBR-BASED HA
- Page 479 and 480:
Attachment 6 TABLE 6-4 SUMMARY OF T
- Page 481 and 482:
Attachment 6 TABLE 6-6 CALCULATION
- Page 483 and 484:
Attachment 6 TABLE 6-8 CALCULATION
- Page 485 and 486:
Attachment 6 TABLE 6-10 CALCULATION
- Page 487 and 488:
Attachment 6 TABLE 6-12 SUMMARY OF
- Page 489 and 490:
Attachment 6 TABLE 6-14 CALCULATION
- Page 491 and 492:
Attachment 6 TABLE 6-16 CALCULATION
- Page 493 and 494:
Attachment 6 TABLE 6-18 CALCULATION
- Page 495 and 496:
Attachment 6 TABLE 6-20 SUMMARY OF
- Page 497 and 498:
Attachment 6 TABLE 6-22 CALCULATION
- Page 499 and 500:
Attachment 6 TABLE 6-24 CALCULATION
- Page 501 and 502:
Attachment 6 TABLE 6-26 CALCULATION
- Page 503 and 504:
Attachment 6 TABLE 6-28 SUMMARY OF
- Page 505 and 506:
This page intentionally left blank.
- Page 507 and 508:
Scenario Timeframe: Future Receptor
- Page 509 and 510:
Scenario Timeframe: Future Receptor
- Page 511 and 512:
Scenario Timeframe: Future Receptor
- Page 513 and 514:
Scenario Timeframe: Future Receptor
- Page 515 and 516:
Scenario Timeframe: Future Receptor
- Page 517 and 518:
Scenario Timeframe: Future Receptor
- Page 519 and 520:
Scenario Timeframe: Future Receptor
- Page 521 and 522:
ATTACHMENT 8 ECOLOGICAL RISK - FUTU
- Page 523 and 524:
FIGURE 8-1 SUMMARY OF TISSUE RESIDU
- Page 525 and 526:
FIGURE 8-3 SUMMARY OF TISSUE RESIDU
- Page 527 and 528:
Hazard Ratio Hazard Ratio FIGURE 8-
- Page 529 and 530:
CASRN Inorganics/Metals Attachment
- Page 531 and 532:
CASRN Inorganics/Metals Attachment
- Page 533 and 534:
CASRN Inorganics/Metals Attachment
- Page 535 and 536:
References: Attachment 8 TABLE 8-7
- Page 537 and 538:
References: Attachment 8 TABLE 8-8
- Page 539 and 540:
References: Attachment 8 TABLE 8-9
- Page 541 and 542:
References: Attachment 8 TABLE 8-10
- Page 543 and 544:
References: Attachment 8 TABLE 8-11
- Page 545 and 546:
References: Attachment 8 TABLE 8-12
- Page 547 and 548:
References: Attachment 8 TABLE 8-13
- Page 549 and 550:
References: Attachment 8 TABLE 8-14
- Page 551 and 552:
References: Attachment 8 TABLE 8-15
- Page 553 and 554:
References: Attachment 8 TABLE 8-16
- Page 555 and 556:
References: Attachment 8 TABLE 8-17
- Page 557 and 558:
References: Attachment 8 TABLE 8-18
- Page 559 and 560:
References: Attachment 8 TABLE 8-19
- Page 561 and 562:
References: Attachment 8 TABLE 8-20
- Page 563 and 564:
References: Attachment 8 TABLE 8-21
- Page 565 and 566:
References: Attachment 8 TABLE 8-22
- Page 567 and 568:
References: Attachment 8 TABLE 8-23
- Page 569 and 570:
References: Attachment 8 TABLE 8-24
- Page 571 and 572:
TABLE 8-26 CALCULATION OF EXPOSURE
- Page 573 and 574:
TABLE 8-28 CALCULATION OF EXPOSURE
- Page 575 and 576:
TABLE 8-30 CALCULATION OF EXPOSURE
- Page 577 and 578:
TABLE 8-32 SUMMARY OF EXPOSURE PATH
- Page 579 and 580:
TABLE 8-34 CALCULATION OF EXPOSURE
- Page 581 and 582:
TABLE 8-36 CALCULATION OF EXPOSURE
- Page 583 and 584:
TABLE 8-38 CALCULATION OF EXPOSURE
- Page 585 and 586:
TABLE 8-40 SUMMARY OF EXPOSURE PATH
- Page 587 and 588:
TABLE 8-42 CALCULATION OF EXPOSURE
- Page 589 and 590:
TABLE 8-44 CALCULATION OF EXPOSURE
- Page 591 and 592:
TABLE 8-46 CALCULATION OF EXPOSURE
- Page 593 and 594:
TABLE 8-48 SUMMARY OF EXPOSURE PATH
- Page 595 and 596:
TABLE 8-50 CALCULATION OF EXPOSURE
- Page 597 and 598:
TABLE 8-52 CALCULATION OF EXPOSURE
- Page 599 and 600:
TABLE 8-54 CALCULATION OF EXPOSURE
- Page 601 and 602:
TABLE 8-56 SUMMARY OF EXPOSURE PATH
- Page 603 and 604:
TABLE 8-58 CALCULATION OF EXPOSURE
- Page 605 and 606:
TABLE 8-60 CALCULATION OF EXPOSURE
- Page 607 and 608:
TABLE 8-62 CALCULATION OF EXPOSURE
- Page 609 and 610:
TABLE 8-64 SUMMARY OF EXPOSURE PATH
- Page 611 and 612:
TABLE 8-66 CALCULATION OF EXPOSURE
- Page 613 and 614:
TABLE 8-68 CALCULATION OF EXPOSURE
- Page 615 and 616:
TABLE 8-70 CALCULATION OF EXPOSURE
- Page 617 and 618:
TABLE 8-72 SUMMARY OF EXPOSURE PATH
- Page 619 and 620:
TABLE 8-74 CALCULATION OF EXPOSURE
- Page 621 and 622:
TABLE 8-76 CALCULATION OF EXPOSURE
- Page 623 and 624:
TABLE 8-78 CALCULATION OF EXPOSURE
- Page 625 and 626:
TABLE 8-80 SUMMARY OF EXPOSURE PATH
- Page 627 and 628:
TABLE 8-82 CALCULATION OF EXPOSURE
- Page 629 and 630:
TABLE 8-84 CALCULATION OF EXPOSURE
- Page 631 and 632:
TABLE 8-86 CALCULATION OF EXPOSURE
- Page 633 and 634:
TABLE 8-88 SUMMARY OF EXPOSURE PATH
- Page 635 and 636:
TABLE 8-90 CALCULATION OF EXPOSURE
- Page 637 and 638:
TABLE 8-92 CALCULATION OF EXPOSURE
- Page 639 and 640:
TABLE 8-94 CALCULATION OF EXPOSURE
- Page 641 and 642:
TABLE 8-96 SUMMARY OF EXPOSURE PATH
- Page 643 and 644:
SCENARIO TIMEFRAME: FUTURE (2048) M
- Page 645 and 646:
TABLE 8-100 CALCULATION OF EXPOSURE
- Page 647 and 648:
TABLE 8-102 CALCULATION OF EXPOSURE
- Page 649 and 650:
TABLE 8-104 SUMMARY OF EXPOSURE PAT
- Page 651 and 652:
TABLE 8-106 CALCULATION OF EXPOSURE
- Page 653 and 654:
TABLE 8-108 CALCULATION OF EXPOSURE
- Page 655 and 656:
TABLE 8-110 CALCULATION OF EXPOSURE
- Page 657 and 658:
TABLE 8-112 SUMMARY OF EXPOSURE PAT
- Page 659 and 660:
TABLE 8-114 CALCULATION OF EXPOSURE
- Page 661 and 662:
TABLE 8-116 CALCULATION OF EXPOSURE
- Page 663 and 664:
TABLE 8-118 CALCULATION OF EXPOSURE
- Page 665 and 666:
TABLE 8-120 SUMMARY OF EXPOSURE PAT
- Page 667 and 668:
TABLE 8-122 CALCULATION OF EXPOSURE
- Page 669 and 670:
TABLE 8-124 CALCULATION OF EXPOSURE
- Page 671 and 672:
TABLE 8-126 CALCULATION OF EXPOSURE
- Page 673 and 674:
TABLE 8-128 SUMMARY OF EXPOSURE PAT
- Page 675 and 676:
TABLE 8-130 CALCULATION OF EXPOSURE
- Page 677 and 678:
TABLE 8-132 CALCULATION OF EXPOSURE
- Page 679 and 680:
TABLE 8-134 CALCULATION OF EXPOSURE
- Page 681 and 682:
TABLE 8-136 SUMMARY OF EXPOSURE PAT
- Page 683 and 684:
TABLE 8-138 CALCULATION OF EXPOSURE
- Page 685 and 686:
TABLE 8-140 CALCULATION OF EXPOSURE
- Page 687 and 688:
TABLE 8-142 CALCULATION OF EXPOSURE
- Page 689 and 690:
TABLE 8-144 SUMMARY OF EXPOSURE PAT
- Page 691 and 692:
TABLE 8-146 CALCULATION OF EXPOSURE
- Page 693 and 694:
TABLE 8-148 CALCULATION OF EXPOSURE
- Page 695 and 696:
TABLE 8-150 CALCULATION OF EXPOSURE
- Page 697 and 698:
TABLE 8-152 SUMMARY OF EXPOSURE PAT
- Page 699 and 700:
TABLE 8-154 CALCULATION OF EXPOSURE
- Page 701 and 702:
TABLE 8-156 CALCULATION OF EXPOSURE
- Page 703 and 704:
TABLE 8-158 CALCULATION OF EXPOSURE
- Page 705 and 706:
TABLE 8-160 SUMMARY OF EXPOSURE PAT
- Page 707 and 708:
TABLE 8-162 CALCULATION OF EXPOSURE
- Page 709 and 710:
TABLE 8-164 CALCULATION OF EXPOSURE
- Page 711 and 712:
TABLE 8-166 CALCULATION OF EXPOSURE
- Page 713:
TABLE 8-168 SUMMARY OF EXPOSURE PAT