- Page 2 and 3:
The Geography of Phytochemical Race
- Page 4 and 5:
Dr. Bruce A. Bohm 3685 West 15th Av
- Page 6 and 7:
Acknowledgments I thank many worker
- Page 8 and 9:
x Abstract which biosynthetic step
- Page 10 and 11:
xii Zusammenfassung Leider wurden n
- Page 12 and 13:
xiv Contents 2.3.11 Thymus (Lamiace
- Page 14 and 15:
xvi Contents 4 Intercontinental Dis
- Page 16 and 17:
xviii Contents 6.8 Kerguelen Island
- Page 18 and 19:
2 1 Introduction It is useful to me
- Page 20 and 21:
4 2 Examples Within Continents Fig.
- Page 22 and 23:
6 2 Examples Within Continents Fig.
- Page 24 and 25:
8 2 Examples Within Continents each
- Page 26 and 27:
10 2 Examples Within Continents of
- Page 28 and 29:
12 2 Examples Within Continents can
- Page 30 and 31:
14 2 Examples Within Continents (4)
- Page 32 and 33:
16 2 Examples Within Continents Fig
- Page 34 and 35:
18 2 Examples Within Continents Fig
- Page 36 and 37:
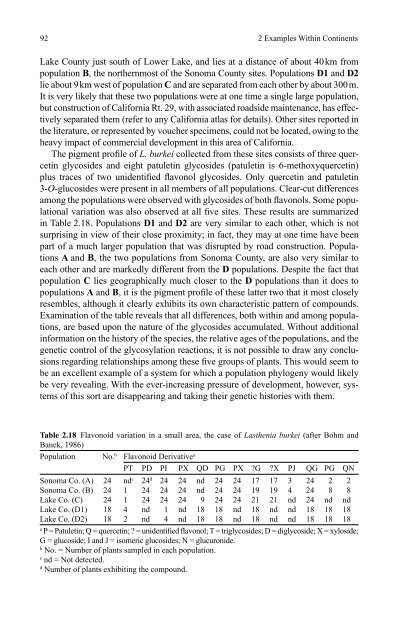
20 2 Examples Within Continents Tab
- Page 38 and 39:
22 2 Examples Within Continents Tab
- Page 40 and 41:
24 2 Examples Within Continents Kno
- Page 42 and 43:
26 2 Examples Within Continents Fig
- Page 44 and 45:
28 2 Examples Within Continents pre
- Page 46 and 47:
30 2 Examples Within Continents ear
- Page 48 and 49:
32 2 Examples Within Continents div
- Page 50 and 51:
34 2 Examples Within Continents zon
- Page 52 and 53:
36 2 Examples Within Continents Mas
- Page 54 and 55:
38 2 Examples Within Continents nat
- Page 56 and 57:
40 2 Examples Within Continents Fig
- Page 58 and 59: 42 2 Examples Within Continents Fig
- Page 60 and 61: 44 2 Examples Within Continents 2.3
- Page 62 and 63: 46 2 Examples Within Continents sou
- Page 64 and 65: 48 2 Examples Within Continents was
- Page 66 and 67: 50 2 Examples Within Continents Fig
- Page 68 and 69: 52 2 Examples Within Continents Fig
- Page 70 and 71: 54 2 Examples Within Continents Fig
- Page 72 and 73: 56 2 Examples Within Continents wel
- Page 74 and 75: 58 2 Examples Within Continents thy
- Page 76 and 77: 60 2 Examples Within Continents Fig
- Page 78 and 79: 62 2 Examples Within Continents Tab
- Page 80 and 81: 64 2 Examples Within Continents Fig
- Page 82 and 83: 66 2 Examples Within Continents und
- Page 84 and 85: 68 2 Examples Within Continents pop
- Page 86 and 87: 70 2 Examples Within Continents 2.6
- Page 88 and 89: 72 2 Examples Within Continents Fig
- Page 90 and 91: 74 2 Examples Within Continents Tab
- Page 92 and 93: 76 2 Examples Within Continents 2.6
- Page 94 and 95: 78 2 Examples Within Continents Tab
- Page 96 and 97: 80 2 Examples Within Continents Fig
- Page 98 and 99: 82 2 Examples Within Continents Mos
- Page 100 and 101: 84 2 Examples Within Continents Fig
- Page 102 and 103: 86 2 Examples Within Continents Fig
- Page 104 and 105: 88 2 Examples Within Continents The
- Page 106 and 107: 90 2 Examples Within Continents Fig
- Page 110 and 111: 94 2 Examples Within Continents tha
- Page 112 and 113: 96 2 Examples Within Continents Fig
- Page 114 and 115: 98 2 Examples Within Continents and
- Page 116 and 117: 100 2 Examples Within Continents Ar
- Page 118 and 119: 102 2 Examples Within Continents st
- Page 120 and 121: 104 2 Examples Within Continents co
- Page 122 and 123: 106 2 Examples Within Continents Fi
- Page 124 and 125: 108 2 Examples Within Continents wi
- Page 126 and 127: 110 2 Examples Within Continents Fi
- Page 128 and 129: 112 2 Examples Within Continents al
- Page 130 and 131: 114 2 Examples Within Continents Fi
- Page 132 and 133: 116 2 Examples Within Continents Ch
- Page 134 and 135: 118 2 Examples Within Continents Ta
- Page 136 and 137: 120 2 Examples Within Continents 2.
- Page 138 and 139: 122 2 Examples Within Continents un
- Page 140 and 141: Chapter 3 After the Ice According t
- Page 142 and 143: 3.1 North America 127 Fig. 3.1 Comp
- Page 144 and 145: 3.1 North America 129 7-O-glucoside
- Page 146 and 147: 3.1 North America 131 been found to
- Page 148 and 149: 3.1 North America 133 structural ty
- Page 150 and 151: 3.1 North America 135 Two species c
- Page 152 and 153: 3.1 North America 137 3.1.5 Thuja p
- Page 154 and 155: 3.1 North America 139 allele freque
- Page 156 and 157: 3.2 North American Conifers 141 fro
- Page 158 and 159:
3.2 North American Conifers 143 hom
- Page 160 and 161:
3.2 North American Conifers 145 Fig
- Page 162 and 163:
3.2 North American Conifers 147 cam
- Page 164 and 165:
3.2 North American Conifers 149 hig
- Page 166 and 167:
3.2 North American Conifers 151 dis
- Page 168 and 169:
3.2 North American Conifers 153 Fig
- Page 170 and 171:
3.2 North American Conifers 155 agr
- Page 172 and 173:
3.2 North American Conifers 157 Tab
- Page 174 and 175:
3.2 North American Conifers 159 Fol
- Page 176 and 177:
3.2 North American Conifers 161 sim
- Page 178 and 179:
3.3 Europe 163 Fig. 3.11 Compounds
- Page 180 and 181:
3.3 Europe 165 levels of 3-carene i
- Page 182 and 183:
3.4 South America 167 historic time
- Page 184 and 185:
3.4 South America 169 Fig. 3.13 Com
- Page 186 and 187:
3.4 South America 171 Mediterranean
- Page 188 and 189:
174 4 Intercontinental Disjunctions
- Page 190 and 191:
176 4 Intercontinental Disjunctions
- Page 192 and 193:
178 4 Intercontinental Disjunctions
- Page 194 and 195:
180 4 Intercontinental Disjunctions
- Page 196 and 197:
182 4 Intercontinental Disjunctions
- Page 198 and 199:
184 4 Intercontinental Disjunctions
- Page 200 and 201:
186 4 Intercontinental Disjunctions
- Page 202 and 203:
188 4 Intercontinental Disjunctions
- Page 204 and 205:
190 4 Intercontinental Disjunctions
- Page 206 and 207:
192 4 Intercontinental Disjunctions
- Page 208 and 209:
194 4 Intercontinental Disjunctions
- Page 210 and 211:
196 4 Intercontinental Disjunctions
- Page 212 and 213:
198 4 Intercontinental Disjunctions
- Page 214 and 215:
200 4 Intercontinental Disjunctions
- Page 216 and 217:
202 4 Intercontinental Disjunctions
- Page 218 and 219:
204 4 Intercontinental Disjunctions
- Page 220 and 221:
206 4 Intercontinental Disjunctions
- Page 222 and 223:
208 4 Intercontinental Disjunctions
- Page 224 and 225:
210 4 Intercontinental Disjunctions
- Page 226 and 227:
212 4 Intercontinental Disjunctions
- Page 228 and 229:
214 4 Intercontinental Disjunctions
- Page 230 and 231:
216 4 Intercontinental Disjunctions
- Page 232 and 233:
218 5 Wide Disjunctions consisting
- Page 234 and 235:
220 5 Wide Disjunctions and, unrela
- Page 236 and 237:
222 5 Wide Disjunctions Fig. 5.3 Co
- Page 238 and 239:
224 5 Wide Disjunctions Fig. 5.4 Co
- Page 240 and 241:
226 5 Wide Disjunctions differences
- Page 242 and 243:
228 5 Wide Disjunctions also been i
- Page 244 and 245:
230 5 Wide Disjunctions Table 5.2 A
- Page 246 and 247:
232 5 Wide Disjunctions Fig. 5.7 Co
- Page 248 and 249:
234 5 Wide Disjunctions Southern He
- Page 250 and 251:
236 5 Wide Disjunctions obtained. E
- Page 252 and 253:
238 5 Wide Disjunctions Table 5.4 O
- Page 254 and 255:
240 5 Wide Disjunctions Fig. 5.12 C
- Page 256 and 257:
242 5 Wide Disjunctions comparable
- Page 258 and 259:
244 5 Wide Disjunctions J. Agardh f
- Page 260 and 261:
246 6 Oceanic Islands Fig. 6.1 Loca
- Page 262 and 263:
248 6 Oceanic Islands Fig. 6.2 Comp
- Page 264 and 265:
250 6 Oceanic Islands levels of spe
- Page 266 and 267:
252 6 Oceanic Islands Fig. 6.3 Comp
- Page 268 and 269:
254 6 Oceanic Islands Compound Chem
- Page 270 and 271:
256 6 Oceanic Islands been cytogene
- Page 272 and 273:
258 6 Oceanic Islands Fig. 6.5 Comp
- Page 274 and 275:
260 6 Oceanic Islands compounds wit
- Page 276 and 277:
262 6 Oceanic Islands preparation o
- Page 278 and 279:
264 6 Oceanic Islands Fig. 6.8 Map
- Page 280 and 281:
266 6 Oceanic Islands (formerly the
- Page 282 and 283:
268 6 Oceanic Islands It is not pos
- Page 284 and 285:
270 6 Oceanic Islands appropriate p
- Page 286 and 287:
272 6 Oceanic Islands A single popu
- Page 288 and 289:
274 6 Oceanic Islands Fig. 6.11 Map
- Page 290 and 291:
276 6 Oceanic Islands primarily of
- Page 292 and 293:
278 6 Oceanic Islands the present c
- Page 294 and 295:
280 6 Oceanic Islands Fuerteventura
- Page 296 and 297:
282 6 Oceanic Islands tetraploid Me
- Page 298 and 299:
284 6 Oceanic Islands to support re
- Page 300 and 301:
286 7 Polar Disjunctions and variet
- Page 302 and 303:
288 7 Polar Disjunctions Fig. 7.2 C
- Page 304 and 305:
290 7 Polar Disjunctions Fig. 7.3 C
- Page 306 and 307:
292 7 Polar Disjunctions (1978), an
- Page 308 and 309:
294 7 Polar Disjunctions Table 7.1
- Page 310 and 311:
296 7 Polar Disjunctions occurs thr
- Page 312 and 313:
Chapter 8 Conclusions Some years ag
- Page 314 and 315:
302 Bibliography Amico, V., Caccame
- Page 316 and 317:
304 Bibliography Bennett, K. D. 199
- Page 318 and 319:
306 Bibliography Caccamese, S., R.
- Page 320 and 321:
308 Bibliography ———, Hussain
- Page 322 and 323:
310 Bibliography Del Pero Martinez,
- Page 324 and 325:
312 Bibliography ——— 1987. A
- Page 326 and 327:
314 Bibliography ———. 1878. F
- Page 328 and 329:
316 Bibliography Herz, W. and Kumar
- Page 330 and 331:
318 Bibliography Jutila, H. M. 1996
- Page 332 and 333:
320 Bibliography Levin, D. A. 1976.
- Page 334 and 335:
322 Bibliography Masuda, M., Abe, T
- Page 336 and 337:
324 Bibliography ———. 1966. A
- Page 338 and 339:
326 Bibliography Prus-Glowacki, W.
- Page 340 and 341:
328 Bibliography Sanders, R. W. 197
- Page 342 and 343:
330 Bibliography ———, Morgan,
- Page 344 and 345:
332 Bibliography Takhajan, A. 1969.
- Page 346 and 347:
334 Bibliography von Rudloff, E. 19
- Page 348 and 349:
336 Bibliography ———, Koenig,
- Page 350 and 351:
Plant Family Index Algae Codiaceae,
- Page 352 and 353:
Plant Genus Index Algae Chondrococc
- Page 354 and 355:
Plant Genus Index 343 Bryophytes (l
- Page 356 and 357:
346 Subject Index Cyanogenesis, gen
- Page 358:
348 Subject Index Romania, 36 Rooib