Goldin & Homonoff - DataSpace at Princeton University
Goldin & Homonoff - DataSpace at Princeton University Goldin & Homonoff - DataSpace at Princeton University
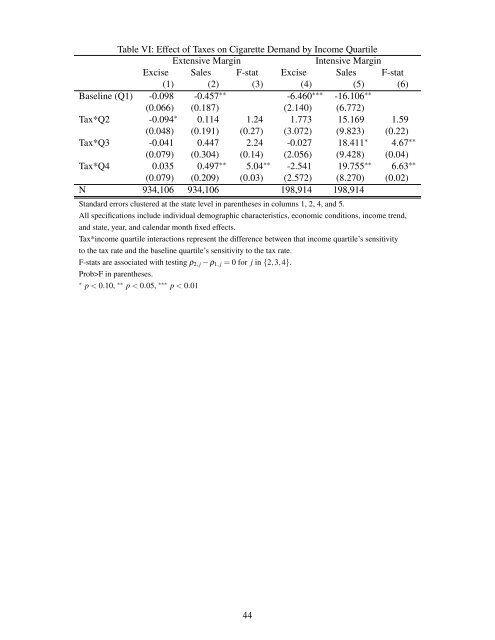
Table VI: Effect of Taxes on Cigarette Demand by Income Quartile Extensive Margin Intensive Margin Excise Sales F-stat Excise Sales F-stat (1) (2) (3) (4) (5) (6) Baseline (Q1) -0.098 -0.457 ∗∗ -6.460 ∗∗∗ -16.106 ∗∗ (0.066) (0.187) (2.140) (6.772) Tax*Q2 -0.094 ∗ 0.114 1.24 1.773 15.169 1.59 (0.048) (0.191) (0.27) (3.072) (9.823) (0.22) Tax*Q3 -0.041 0.447 2.24 -0.027 18.411 ∗ 4.67 ∗∗ (0.079) (0.304) (0.14) (2.056) (9.428) (0.04) Tax*Q4 0.035 0.497 ∗∗ 5.04 ∗∗ -2.541 19.755 ∗∗ 6.63 ∗∗ (0.079) (0.209) (0.03) (2.572) (8.270) (0.02) N 934,106 934,106 198,914 198,914 Standard errors clustered at the state level in parentheses in columns 1, 2, 4, and 5. All specifications include individual demographic characteristics, economic conditions, income trend, and state, year, and calendar month fixed effects. Tax*income quartile interactions represent the difference between that income quartile’s sensitivity to the tax rate and the baseline quartile’s sensitivity to the tax rate. F-stats are associated with testing ρ2, j − ρ1, j = 0 for j in {2,3,4}. Prob>F in parentheses. ∗ p < 0.10, ∗∗ p < 0.05, ∗∗∗ p < 0.01 44
Table VII: Sales Tax Exemptions for Cigarettes Extensive Margin Intensive Margin (1) (2) Excise Tax -0.134 ∗∗∗ -6.408 ∗∗∗ (0.035) (1.041) Excise*Low-income 0.046 -0.245 (0.063) (2.440) Sales Tax*Non-exempt -0.858 ∗∗∗ -0.249 (0.292) (15.182) Sales*Low-income*Non-exempt -0.351 -17.094 ∗ (0.292) (8.431) Sales Tax*Exempt -1.264 ∗∗ -23.665 (0.519) (30.629) Sales*Low-income*Exempt -0.012 1.954 (0.391) (15.944) F-stat 4.10 1.64 prob>F 0.05 0.21 N 934,106 198,914 Standard errors clustered at the state level in parentheses. All specifications include individual demographic characteristics, economic conditions, income trend, and state, year, and calendar month fixed effects. The F-stat is for the test of equality between the sales*low-income interaction between states that exempt cigarettes from the sales tax and states that do not. ∗ p < 0.10, ∗∗ p < 0.05, ∗∗∗ p < 0.01 45
- Page 1 and 2: Smoke Gets in Your Eyes: Cigarette
- Page 3 and 4: cigarette’s posted price, and a s
- Page 5 and 6: form BCi : (p +tp +tr)xi + yi ≤ M
- Page 7 and 8: tax types: R(tp,tr) = (tp +tr)(xA +
- Page 9 and 10: ∂yB = −x. ∂tr Substituting th
- Page 11 and 12: consumers. An implication of the re
- Page 13 and 14: Data on state-level cigarette excis
- Page 15 and 16: variable (y) represents cigarette d
- Page 17 and 18: and is not statistically significan
- Page 19 and 20: Table IV presents our results. Colu
- Page 21 and 22: D. Tax Base Differences Between the
- Page 23 and 24: more by income in non-exempt states
- Page 25 and 26: with the variable assigned a value
- Page 27 and 28: to cigarette register taxes decline
- Page 29 and 30: References [1] Becker, Gary, Michae
- Page 31 and 32: Appendix A: Welfare Analysis Under
- Page 33 and 34: Again, the first term represents a
- Page 35 and 36: Appendix C: A Cognitive Cost Model
- Page 37 and 38: income yields: ∂Gi ∂Mi = 1 2 t2
- Page 39 and 40: Table I: Summary of Cigarette Tax C
- Page 41 and 42: Table III: Effect of Taxes on Cigar
- Page 43: Table V: Effect of Taxes on Cigaret
- Page 47 and 48: Table IX: Instrumenting for Price w
- Page 49 and 50: Table XI: Alternative Demand Models
- Page 51 and 52: Table XIII: State Trends Extensive
- Page 53 and 54: Figure II: Aggregate Cigarette Cons
Table VI: Effect of Taxes on Cigarette Demand by Income Quartile<br />
Extensive Margin Intensive Margin<br />
Excise Sales F-st<strong>at</strong> Excise Sales F-st<strong>at</strong><br />
(1) (2) (3) (4) (5) (6)<br />
Baseline (Q1) -0.098 -0.457 ∗∗ -6.460 ∗∗∗ -16.106 ∗∗<br />
(0.066) (0.187) (2.140) (6.772)<br />
Tax*Q2 -0.094 ∗ 0.114 1.24 1.773 15.169 1.59<br />
(0.048) (0.191) (0.27) (3.072) (9.823) (0.22)<br />
Tax*Q3 -0.041 0.447 2.24 -0.027 18.411 ∗ 4.67 ∗∗<br />
(0.079) (0.304) (0.14) (2.056) (9.428) (0.04)<br />
Tax*Q4 0.035 0.497 ∗∗ 5.04 ∗∗ -2.541 19.755 ∗∗ 6.63 ∗∗<br />
(0.079) (0.209) (0.03) (2.572) (8.270) (0.02)<br />
N 934,106 934,106 198,914 198,914<br />
Standard errors clustered <strong>at</strong> the st<strong>at</strong>e level in parentheses in columns 1, 2, 4, and 5.<br />
All specific<strong>at</strong>ions include individual demographic characteristics, economic conditions, income trend,<br />
and st<strong>at</strong>e, year, and calendar month fixed effects.<br />
Tax*income quartile interactions represent the difference between th<strong>at</strong> income quartile’s sensitivity<br />
to the tax r<strong>at</strong>e and the baseline quartile’s sensitivity to the tax r<strong>at</strong>e.<br />
F-st<strong>at</strong>s are associ<strong>at</strong>ed with testing ρ2, j − ρ1, j = 0 for j in {2,3,4}.<br />
Prob>F in parentheses.<br />
∗ p < 0.10, ∗∗ p < 0.05, ∗∗∗ p < 0.01<br />
44


