Goldin & Homonoff - DataSpace at Princeton University
Goldin & Homonoff - DataSpace at Princeton University
Goldin & Homonoff - DataSpace at Princeton University

You also want an ePaper? Increase the reach of your titles
YUMPU automatically turns print PDFs into web optimized ePapers that Google loves.
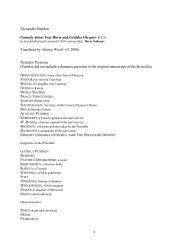
Table IV: Effect of Taxes on Cigarette Demand by Income - Extensive and Intensive Margins<br />
Extensive Margin Intensive Margin<br />
(1) (2) (3) (4) (5) (6)<br />
Excise Tax -0.165 ∗∗∗ -0.136 ∗∗∗ -0.128 ∗∗∗ -7.665 ∗∗∗ -7.379 ∗∗∗ -6.423 ∗∗∗<br />
(0.035) (0.036) (0.035) (1.102) (1.055) (1.077)<br />
Sales Tax -0.333 ∗ -0.094 -0.092 0.200 1.428 1.392<br />
(0.181) (0.160) (0.160) (5.885) (7.077) (7.234)<br />
Excise*Low-income 0.082 0.081 0.045 3.665 ∗ 3.672 ∗ -0.211<br />
(0.058) (0.059) (0.063) (1.974) (1.985) (2.518)<br />
Sales*Low-income -0.339 -0.337 -0.350 -16.690 ∗∗ -16.710 ∗∗ -17.579 ∗∗<br />
(0.229) (0.230) (0.219) (7.673) (7.666) (7.841)<br />
Income -0.123 ∗∗∗ -0.123 ∗∗∗ -0.106 ∗∗∗ -0.272 -0.272 1.533 ∗∗∗<br />
(0.006) (0.006) (0.011) (0.186) (0.186) (0.312)<br />
Income Trend -0.002 -0.232 ∗∗∗<br />
(0.001) (0.028)<br />
Economic Conditions x x x x<br />
Income Trend x x<br />
F-st<strong>at</strong> 3.53 3.44 3.13 7.07 7.11 5.24<br />
prob>F 0.07 0.07 0.09 0.01 0.01 0.03<br />
N 934,106 934,106 934,106 198,914 198,914 198,914<br />
Standard errors clustered <strong>at</strong> the st<strong>at</strong>e level in parentheses.<br />
All specific<strong>at</strong>ions include individual demographic characteristics and st<strong>at</strong>e, year, and calendar month fixed effects.<br />
The F-st<strong>at</strong> is associ<strong>at</strong>ed with the test for equality between the excise*low-income and sales*low-income<br />
interaction coefficients.<br />
∗ p < 0.10, ∗∗ p < 0.05, ∗∗∗ p < 0.01<br />
42