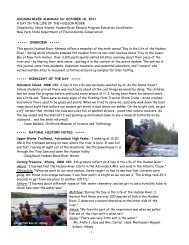
1 R/V Revelle, cruise 1204, Lamon Bay 2, Legaspi to Kaohsiung, 24 ...
1 R/V Revelle, cruise 1204, Lamon Bay 2, Legaspi to Kaohsiung, 24 ...
1 R/V Revelle, cruise 1204, Lamon Bay 2, Legaspi to Kaohsiung, 24 ...

You also want an ePaper? Increase the reach of your titles
YUMPU automatically turns print PDFs into web optimized ePapers that Google loves.
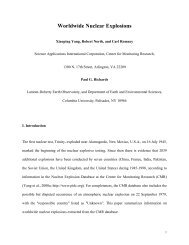
R/V <strong>Revelle</strong>, <strong>cruise</strong> <strong>1204</strong>, <strong>Lamon</strong> <strong>Bay</strong> 2, <br />
<strong>Legaspi</strong> <strong>to</strong> Kaohsiung, <strong>24</strong> April 14 May 2012 <br />
Personnel drop off at Port Irene, Philippines on 11 May <br />
Arnold L. Gordon, Chief Scientist <br />
<br />
<br />
Mayon Volcano, <strong>Legaspi</strong>, the Philippines <br />
<br />
<br />
I Introduction: <br />
<br />
The research objectives of the <strong>cruise</strong> is <strong>to</strong> quantity the spatial and temporal <br />
characteristics of the ocean processes governing the stratification & circulation <br />
within <strong>Lamon</strong> <strong>Bay</strong> and their relationship <strong>to</strong> marine productivity and ecosystems and <br />
<strong>to</strong> investigate possible linkage of <strong>Lamon</strong> <strong>Bay</strong> dynamics <strong>to</strong> the development of the <br />
Kuroshio. <br />
<br />
The observational program consists of integrated physical and biological <br />
oceanography measurements, obtained from ship‐based underway oceanographic <br />
and meteorological sensors, including the hull mounted ADCP; and by water column <br />
stations (CTD‐O2 with a <strong>24</strong>‐bottle 10‐liter water sample rosette, figure 1 shows <br />
stations obtained in 2011). Net <strong>to</strong>ws. The sea floor sediment was sampled with <br />
gravity cores. <br />
<br />
There are two ship based research phases linked <strong>to</strong>gether by an array of <br />
moorings recording ocean currents and T/S (Table 1) and by a land based high <br />
frequency radio array, as well as satellite coverage of SST, ocean color and altimetry, <br />
and larger scale ocean observations by global observational programs and by OKMC <br />
(Origin of the Kuroshio and Mindanao Current, a ONR program). <br />
<br />
1
II <strong>Lamon</strong> <strong>Bay</strong> <strong>cruise</strong> #1 LB01, May/June 2011 <strong>Revelle</strong> <strong>cruise</strong> 1107. for LB01 <br />
report go <strong>to</strong>: <br />
http://www.ldeo.columbia.edu/~agordon/Reports/<strong>Lamon</strong><strong>Bay</strong>2011_Report.pdf ] <br />
The figures in this report will be (by ~25 May 2012) placed in a PowerPoint file at <br />
http://www.ldeo.columbia.edu/~agordon/Reports <br />
<br />
<br />
<br />
Figure 1. Station/track map of <strong>Lamon</strong> <strong>Bay</strong> 1, May/June 2011 (LB01). Red dots show <br />
drifter deployments [13 in <strong>to</strong>tal]; red triangles are mooring deployment sites [6 in <br />
<strong>to</strong>tal, see Table I]. There were 45 CTD stations most with water samples for <br />
chemistry. The track extending the coverage <strong>to</strong> the NEC bifurcation during Typhoon <br />
Songda [Philippine designated name: Chedeng] <br />
<br />
<br />
<br />
TABLE I <br />
Moorings deployed during <strong>Lamon</strong> <strong>Bay</strong> <strong>cruise</strong> 1 [May/June 2011] <br />
see LB01 report for mooring configuation @ <br />
http://www.ldeo.columbia.edu/~agordon/Reports/<strong>Lamon</strong><strong>Bay</strong>2011_Report.pdf <br />
<br />
<br />
<br />
what long°E latitude°N Day GMT depth <br />
TRBM1 123.7233 14.9517 22may2011 145 <br />
TRBM2 121.7572 15.1581 27may2011 192 <br />
2
TRBM3: 121.7415 15.8186 28may2011 180 <br />
T/S Bot<strong>to</strong>m: 121.7201 15.8158 28may2011 86 <br />
Mooring [line] 1 122.9715 14.7405 30may2011 226 <br />
Mooring [line] 2 1<strong>24</strong>.2274 15.7540 31may2011 757 <br />
<br />
<br />
III <strong>Lamon</strong> <strong>Bay</strong> Cruise 2 <br />
<br />
[A] <strong>Lamon</strong> <strong>Bay</strong> 2 work plan approach <br />
<br />
Phase 1: Box‐in <strong>Lamon</strong> <strong>Bay</strong> proper with closely spaced (~25 km) CTD/rosette <strong>to</strong> <br />
1500 m (or shallower sea floor) along a 1<strong>24</strong>.25° E N‐S line from ~14.25°N <strong>to</strong> 16.5°N; <br />
an E‐W line along 16.5°N, with a few vertical and oblique plank<strong>to</strong>n net <strong>to</strong>w stations, <br />
listening <strong>to</strong> mooring at 15.5°, 1<strong>24</strong>.25°. Two CTD/rosette <strong>to</strong> 4000 m <strong>to</strong> see what's <br />
happening within the western deep ocean trough. <br />
<br />
Phase 2: Interior of the 'phase 2 box': CTD/rosette <strong>to</strong> 1500 m (or shallower sea <br />
floor) with one 4000 m CTD/rosette <strong>to</strong> complete the deep water trough sampling of <br />
phase 1; a few vertical and oblique plank<strong>to</strong>n net <strong>to</strong>w stations; listening <strong>to</strong> moorings; <br />
gravity cores; with underway grids [surface water, hull ADCP] <strong>to</strong> expose spatial <br />
patterns of the surface layer characteristics. <br />
<br />
Phase 3: <strong>Lamon</strong> <strong>Bay</strong> southern shelf, with CTD/rosette <strong>to</strong> shelf /upper slope floor; <br />
listen <strong>to</strong> shelf moorings; a few vertical and oblique plank<strong>to</strong>n net <strong>to</strong>w stations; and <br />
gravity cores. <br />
<br />
Phase 4: recover moorings, with CTD/rosette <strong>to</strong> 1500 m or shallower sea floor and <br />
underway survey. <br />
<br />
Phase 5: north of 16.5°N, with priority of closely spaced (~25 km) CTD/rosette <strong>to</strong> <br />
1500 m or shallower sea floor along 18.35°N <strong>to</strong> 1<strong>24</strong>.25°E and along 1<strong>24</strong>.25°E from <br />
16.5N and 18.35N. Within this box: underway grid with possible CTD/rosette as <br />
time allows. <br />
<br />
Phase 6: Survey [underway data and XBT] Luzon Strait, enroute <strong>to</strong> Kao‐hsiung, <strong>to</strong> <br />
related . <br />
<br />
[B] <strong>Lamon</strong> <strong>Bay</strong> <strong>cruise</strong> 2 Personnel <br />
<br />
1 Arnold Gordon <strong>Lamon</strong>t‐Doherty, Columbia U <br />
2 Laura David University of the Philippines Diliman <br />
3 Aletta Yniguez University of the Philippines Diliman <br />
4 Ma. Lourdes McGlone University of the Philippines Diliman <br />
5 Gil Jacin<strong>to</strong> University of the Philippines Diliman <br />
6 Atsushi Watanabe Tokyo Institute of Technology <br />
7 Cesar Villanoy University of the Philippines Diliman <br />
3
8 Fernando Siringan University of the Philippines Diliman <br />
9 Jay Mar Quevedo University of the Philippines Diliman <br />
10 Pierre Flament University of Hawaii <br />
11 Ma. Teresa Escobar University of the Philippines Diliman <br />
12 Mary Chris Tentia University of the Philippines Diliman <br />
13 Rose Lopez University of the Philippines Diliman <br />
14 Kristina Cordero University of the Philippines Diliman <br />
15 Lara Sot<strong>to</strong> University of the Philippines Diliman <br />
16 Rhodelyn Saban University of the Philippines Diliman <br />
17 Dianne Deauna University of the Philippines Diliman <br />
18 Olivia Cabrera University of the Philippines Diliman <br />
19 Isabel Senal University of the Philippines Diliman <br />
20 Marianne Camoying University of the Philippines Diliman <br />
21 Iris Bollozos University of the Philippines Diliman <br />
22 Mayra Hernandez‐Gonzalez University of Baja California <br />
23 Asmi Napitu <strong>Lamon</strong>t‐Doherty, Columbia U <br />
<strong>24</strong> Paul Lethaby University of Hawaii <br />
25 Phil Mele <strong>Lamon</strong>t‐Doherty, Columbia U <br />
26 Allan Noveno Observer, Philippine Navy <br />
27 Frank Delahoyde Computer Tech, SCRIPPS <br />
28 Meghan Donohue Restech, SCRIPPS <br />
29 Brett Hembrough Restech, SCRIPPS <br />
<br />
4 <br />
<br />
<br />
LB02 scientists <br />
<br />
[C] Data Collection Summary: <br />
<br />
The figures in this report will be (by ~25 May 2012) placed in a PowerPoint file at <br />
http://www.ldeo.columbia.edu/~agordon/Reports <br />
<br />
5
<br />
<br />
Figure 2a: Station/track map of <strong>Lamon</strong> <strong>Bay</strong> 2, April/May 2012. There were 78 CTD <br />
stations (temperature, salinity, oxygen), <strong>to</strong> 1500 m or <strong>to</strong> the shallower sea floor; 4 <br />
stations descended <strong>to</strong> 4000 meters <strong>to</strong> observe the waters within a deep ocean <br />
trough within <strong>Lamon</strong> <strong>Bay</strong>. Water samples were taken for CTD oxygen <br />
standardization and for determination of nutrient, carbon chemistry, and ecosystem <br />
parameters. Underway data, besides ADCP and <strong>Revelle</strong> ‘Real‐time Underway and <br />
Meteorological Data’ (ocean surface temperature and salinity; oxygen; Chlorophyll‐<br />
A (fluorometer);Transmissivity), included pCO2. <br />
6
<br />
Figure 2b. A subset of stations had net <strong>to</strong>ws <strong>to</strong> ~200 m <strong>to</strong> sample the ‘living’ <br />
component (plank<strong>to</strong>n, and the occasional fish) of the upper water column. Gravity <br />
cores of the sea floor sediments were taken at 9 sites. The red font [lower map] <br />
shows the mooring deployed in LB01 (see: Table I). The Trawl Resistant Bot<strong>to</strong>m <br />
Mooring [TRBM] 1 and 2 could not be recovered, all other were recovered. XBT <br />
were taken during the Luzon Strait survey. <br />
<br />
<br />
TABLE II <br />
7 <br />
Moorings recovery results in 2012 <strong>Lamon</strong> <strong>Bay</strong> <strong>cruise</strong> 2 [April/May 2012] <br />
<br />
Mooring recovered [local] data recovery <br />
TRBM1 dragged for; did not leave sea floor; did not recover <br />
dragged for; ascent <strong>to</strong> 30 m below sea surface; did <br />
TRBM2 <br />
not recover <br />
TRBM3 [with <br />
seacat]: 4/30/12 15:00 full data <br />
recovered; <br />
problem with <br />
T/S Bot<strong>to</strong>m: 4/30/12 16:30 download <br />
full data; deep S4 <br />
Mooring [line] 1 5/3/12 7:15 cm flooded <br />
Mooring [line] 2 5/4/12 6:00 full data <br />
<br />
<br />
IV Results of <strong>Lamon</strong> <strong>Bay</strong> Program: <br />
<br />
[A] Summary of <strong>Lamon</strong> <strong>Bay</strong> Cruise #1 (2011) key science results [see full report at <br />
http://www.ldeo.columbia.edu/~agordon/Reports/<strong>Lamon</strong><strong>Bay</strong>2011_Report.pdf ] <br />
<br />
The circulation within <strong>Lamon</strong> <strong>Bay</strong> (defined here as west of 1<strong>24</strong>°E, south of <br />
18°N, north of 14°N) is vigorous, with surface layer currents often between 1 and 2 <br />
kts. The Kuroshio at 18.35°N (northeastern tip of Luzon) was nearly 3 kts at the sea <br />
surface, and extended <strong>to</strong> ~350 m. Within <strong>Lamon</strong> <strong>Bay</strong> are 2 energetic gyres or <br />
dipoles that bracket a northwestward stream in<strong>to</strong> the Kuroshio. These features <br />
extend <strong>to</strong> only 150‐200 m. The cyclonic dipole is within the southern tier of <strong>Lamon</strong> <br />
<strong>Bay</strong>; the much more energetic anticyclonic dipole is <strong>to</strong> the north of the Kuroshio <br />
feeder stream. This sets up a bifurcation along the western boundary of <strong>Lamon</strong> <strong>Bay</strong>, <br />
near 16°‐17°N, which is likely more relevant <strong>to</strong> the Kuroshio than the bifurcation <br />
near 13°N. The first occurrence of (what I would call) the Kuroshio is at the 16.5°N <br />
western boundary. The vorticity transfer linking the nascent Kuroshio <strong>to</strong> the dipoles <br />
needs <strong>to</strong> be considered in understanding the origin of the Kuroshio. <br />
<br />
The <strong>Lamon</strong> <strong>Bay</strong> dipole has a branch entering in<strong>to</strong> Polillo Strait, and then <br />
exported from the shelf north of Calagua Island, introducing low salinity surface <br />
water in<strong>to</strong> the <strong>Lamon</strong> <strong>Bay</strong> cyclonic dipole. <strong>Lamon</strong> <strong>Bay</strong> is a confluence of waters from <br />
different ocean regimes that then contribute <strong>to</strong> the Kuroshio. During LB01 the <br />
Kuroshio off the northeastern point of Luzon is mainly drawn from North Pacific <br />
subtropical water (subtropical component of the North Equa<strong>to</strong>rial Current) and <br />
western North Pacific Kuroshio recirculation. Input from the equa<strong>to</strong>rial component <br />
of the North Equa<strong>to</strong>rial Current, derived from the bifurcation near 13°N, is small. <br />
<br />
The water mass and <strong>to</strong> some extent the circulation pattern observed during <br />
LB02 is quite different as observed ~11 months ago during LB01, as presented in <br />
the following overview, and as with all that changes: blame it on El Niño. <br />
8
<br />
[B] Overview of <strong>Lamon</strong> <strong>Bay</strong> Cruise #2 (2012) key science results [The figures in this <br />
section will be placed by ~25 May 2012 in a PowerPoint file at <br />
http://www.ldeo.columbia.edu/~agordon/Reports] <br />
<br />
LB02 data in comparison <strong>to</strong> <strong>Lamon</strong> <strong>Bay</strong> <strong>cruise</strong> 1 (LB01; May/June 2011) <br />
provide important new insights in<strong>to</strong> the origin of the Kuroshio before it encounters <br />
Luzon Strait. I refer <strong>to</strong> this stage of the Kuroshio system as the nascent Kuroshio. <br />
While we see increase in the velocity/transport in comparison LB01, what may be <br />
more important are the observed changes of the source (or 'headwaters') of the <br />
nascent Kuroshio. The ENSO based changing nature of the Kuroshio source waters is <br />
excepted <strong>to</strong> have far reaching effects, as the ENSO fac<strong>to</strong>r effectively links the <br />
equa<strong>to</strong>rial and subtropical regimes of the North Pacific during La Niña; isolating the <br />
subtropical North Pacific during El Niño. <br />
<br />
§ LB01 & LB02 stratification profiles, potential temperature/salinity scatter: <br />
<br />
Profiles of temperature, salinity and oxygen and the relationship of salinity <br />
and oxygen <strong>to</strong> temperature (Figures 3 and 4) reveal the diversity of water types that <br />
characterize <strong>Lamon</strong> <strong>Bay</strong> and the changes that occurred between the two ship based <br />
studies of LB01 and LB02. The distinct difference of the April/May LB02 <br />
stratification from the May/June LB01 stratification is best seen at the S‐max and S‐<br />
min core layers. The S‐max is derived from the evaporative subtropical, spreads <br />
<strong>to</strong>ward the equa<strong>to</strong>r below the Ekman layer; the S‐min is derived from the NW North <br />
Pacific, and is designated as North Pacific Intermediate Water (NPIW). <br />
<br />
<br />
9
<br />
<br />
Figure 3. Potential temperature, salinity and oxygen of the upper kilometer of <br />
<strong>Lamon</strong> <strong>Bay</strong> as observed in LB01 (black symbols) and LB02 (red, cyan and green <br />
symbols). The map in lower left provides positions of the CTD profiles shown in the <br />
figure. Tropical water introduced in<strong>to</strong> the <strong>Lamon</strong> <strong>Bay</strong> region by the northward <br />
flowing limb of the North Equa<strong>to</strong>rial Current (NEC) bifurcation has saltier S‐max <br />
within the upper thermocline and saltier S‐Min at thermocline base than does the <br />
subtropical waters of the western North Pacific, identified here as Kuroshio water, <br />
which is enriched in North Pacific Intermediate Water (NPIW). The 'Polillo <br />
depression' is the ~850 m hole near 14.5°N, 121.75°E, the likely source of the low <br />
oxygen layer found over the <strong>Lamon</strong> <strong>Bay</strong> southern shelf and adjacent slope. <br />
<br />
<br />
10
<br />
Figure 4a. Potential temperature vs. salinity scatter observed in LB01 (black <br />
symbols) and LB02 (red, cyan and green symbols). The map in lower left provides <br />
positions of the CTD stations shown in the figure. The boxes text within the figure <br />
provide identify key results in terms of the NEC vs. Kuroshio source of the <strong>Lamon</strong> <br />
<strong>Bay</strong> stratification. <br />
<br />
<br />
<br />
11 <br />
<br />
Figure 4b. Potential temperature vs. oxygen (ml/l) scatter observed in LB01 (black <br />
symbols) and LB02 (red, cyan and green symbols). The map in upper left provides <br />
positions of the CTD stations shown in the figure. Kuroshio s‐max higher in oxy than <br />
NEC s‐max; the Kuroshio oxy‐min occurs at colder temperatures than that of the <br />
tropical NEC water. <br />
<br />
12
<br />
<br />
Figure 4c Same as Figure 4a, but the LB01 data points removed <strong>to</strong> show only LB02 <br />
T/S scatter. The coastal waters near Pilillo Island and in the embayment at Port <br />
Irene display strongly altered profile <strong>to</strong> a depth of ~350 m, removing the S‐max and <br />
attenuating the S‐min core layer, signifying more than a low salinity surface layer <br />
sweeping over the thermocline of the open ocean. <br />
<br />
13
<br />
Figure 4d. Comparison of the S‐max and S‐min of the two LB <strong>cruise</strong>s. The time <br />
period (April/may 2012) of LB02 displays greater presence tropical North <br />
Equa<strong>to</strong>rial Current water than the LB01 period (May/June, 2011). <br />
<br />
<br />
The time series T/S from the recovered mooring time (Figure 5) show that <br />
the transition within the nascent Kuroshio from the Kuroshio recirculation gyre <br />
regime (weak S‐max; strong S‐min) of LB01 <strong>to</strong> the NEC regime (strong S‐max; weak <br />
S‐min) observed during LB02, occurred in late December 2011 (eastern site) <strong>to</strong> <br />
early February 2012 (western site) time frame. It <strong>to</strong>ok ~1 month for the increased <br />
NEC injection in<strong>to</strong> the <strong>Lamon</strong> <strong>Bay</strong> <strong>to</strong> invade the cyclonic dipole of the southwest <br />
corner of the <strong>Bay</strong>. The height of the La Niña phase occurred in December 2011 (see <br />
lower right panel of Figure 11). <br />
<br />
<br />
14 <br />
<br />
15 <br />
<br />
<br />
<br />
Figure 5 a,b Time series of temperature and salinity and T/S scatter from TRBM3 <br />
and the long mooring 2 (see Table I and II). Figure 5c shows the combined T/S <br />
scatter of the two moorings [left panel] with the approximate fit overlaid on the <br />
LB01 and LB02 T/S [right panel]. <br />
<br />
<br />
<br />
§ T/S stratification sections view, with ship ADCP sections: <br />
<br />
Insight in<strong>to</strong> the spatial distribution of the S‐max and S‐min core layers, which <br />
mark the NEC vs. Kuroshio source, can be seen in the salinity sections. <br />
<br />
<br />
Figure 6. Position of the salinity and ship ADCP sections shown in Figure 6. <br />
16 <br />
<br />
<br />
<br />
<br />
17 <br />
<br />
<br />
Figure 7. Salinity distribution for the upper 1000 m along the sections shown in <br />
Figure 6. Note: the sections are presented in order of the station number, left <strong>to</strong> <br />
right; the N‐S, E‐W orientation is noted within the section panel. The right panels <br />
show the current speed across the section for the upper ~550 m obtained by the <br />
ship mounted 75 kHz ADCP underway system, cm/sec (+60, red <strong>to</strong> ‐60, blue <br />
cm/sec). The ADCP section is often not for the full lateral length of the salinity <br />
section. The km scale is noted at the base of the sections. <br />
<br />
The salty S‐max core layer marked in the sections (Figure 7) is derived from <br />
the tropical water injected in<strong>to</strong> <strong>Lamon</strong> <strong>Bay</strong> from the NEC via the bifurcation. The <br />
lower salinity S‐max and fresher S‐min stratum marks the western North Pacific <br />
subtropical regime of the Kuroshio recirculation gyre. The western North Pacific <br />
subtropical water is observed only in the northeastern stations of the LB02 array, in <br />
contrast <strong>to</strong> its far more pervasive distribution observed within <strong>Lamon</strong> <strong>Bay</strong> by LB01. <br />
<br />
<br />
§ Surface Layer Circulation: <br />
<br />
<strong>Lamon</strong> <strong>Bay</strong> 21‐53 m current vec<strong>to</strong>rs color coded by SSS (Figure 8): The <br />
circulation pattern revealed by LB01 and LB02 are similar. A flow, referred <strong>to</strong> as the <br />
Kuroshio feeder current crosses <strong>Lamon</strong> <strong>Bay</strong>, reaching the western margin near 16°N <br />
<strong>to</strong> begin the nascent Kuroshio. The Kuroshio feeder current separates an <br />
18
anticyclonic dipole from a cyclonic dipole. While the patterns of LB01 and LB02 <br />
have similarities, there are some differences in amplitude, but the primary one has <br />
<strong>to</strong> do with the water characteristics feeding in<strong>to</strong> <strong>Lamon</strong> <strong>Bay</strong>, as discussed above, and <br />
summaries below. <br />
<br />
<br />
Figure 8. Sea surface salinity (SSS) color‐coded current vec<strong>to</strong>rs within <strong>Lamon</strong> <strong>Bay</strong> <br />
for LB01 (right panel) and LB02 (left panel). <br />
<br />
<br />
§ Transport: <br />
<br />
The nascent Kuroshio crossing 18.35°N (Figure 9): The Kuroshio is stronger <br />
and reaches greater depths during LB02 than LB01. The transport increased from <br />
~10‐11 Sv <strong>to</strong> 15‐16 Sv. The surface current speeds doubled. When the nascent <br />
Kuroshio is fed from the NEC regime rather than from the Kuroshio recirculation <br />
regime, it is strengthened. The NEC source is amplified during La Niña when the <br />
bifurcation shifts southward. <br />
<br />
19 <br />
<br />
Figure 9. Comparison of the northward flow across 18.35°N of LB01 and LB02. The <br />
maximum speed of the nascent Kuroshio in LB02 was twice that of LB01 and the <br />
transport 50% greater. The geostrophic speed relative <strong>to</strong> 1000 db of the Kuroshio <br />
axis in LB02 as determined by the CTD data is 1.35 m/sec. <br />
<br />
Transport across key sections of LB02 (Figure 10) exceed that of LB01, by <br />
~50%, attesting <strong>to</strong> the additional injection of tropical water from the North <br />
Equa<strong>to</strong>rial Current. A quick estimate of the transport of the western section of the <br />
19°N section (not shown on figure 10, see station map Figure 2a) yield transport of <br />
~20 Sv. It is possible that the enhanced transport relative <strong>to</strong> 18.35°N is due <strong>to</strong> <br />
greater incorporation of Kuroshio recirculation gyre water. <br />
20 <br />
<br />
<br />
<br />
Figure 10. Transport across select zonal and meridional sections of <strong>Lamon</strong> bay <br />
<br />
§ North Equa<strong>to</strong>rial Current Bifurcation (Figure 11): <br />
<br />
During LB01 Typhoon Songda forced the <strong>Revelle</strong> <strong>to</strong> move out of <strong>Lamon</strong> <strong>Bay</strong> <br />
<strong>to</strong>wards the south, in<strong>to</strong> the NEC bifurcation region. The bifurcation at that time was <br />
found <strong>to</strong> be in the 13°‐14° N band. In April 2012, just prior <strong>to</strong> LB02, the bifurcation <br />
was again observed during the <strong>Revelle</strong> transit from Freemantle <strong>to</strong> <strong>Legaspi</strong>. It was <br />
observed <strong>to</strong> be further south, 10°‐11°N. Southward shift of the bifurcation during La <br />
Niña [lower right panel shows the nino4 index] is expected, relative <strong>to</strong> El Niño (Qiu <br />
and Chen 2010) and presumably relative <strong>to</strong> the more neutral ENSO state of <br />
May/June 2011 LB01 period. <br />
<br />
21 <br />
<br />
Figure 11. North Equa<strong>to</strong>rial Current Bifurcation observed during LB01 and LB02. <br />
<br />
<br />
The more southerly position of the bifurcation as expected <strong>to</strong> direct more of <br />
the NEC water in<strong>to</strong> the northern limb, leading in<strong>to</strong> <strong>Lamon</strong> <strong>Bay</strong>, and the nascent <br />
Kuroshio, which is consistent with the observations of LB02. <br />
<br />
§ Summarizing Schematic (Figure 12): <br />
<br />
The CTD data and the ship based underway data from both LB01 and LB02, <br />
plus the mooring time series can be brought <strong>to</strong>gether in<strong>to</strong> a schematic 'conceptual' <br />
representation consistent with the broad array of data, as well on results reported <br />
in publications and model output. Such a schematic is shown in Figure 12. <br />
22 <br />
23 <br />
<br />
Figure 12. The schematic shown above is based on the CTD (T/S stratification) and <br />
ship‐based ADCP currents of the upper ~600 m obtained by the <strong>Lamon</strong> <strong>Bay</strong> <br />
research <strong>cruise</strong>s of May/June 2011 and April/May 2012, which covered the area <br />
south of ~19°N west of ~126°E and the NEC bifurcation region [typhoon de<strong>to</strong>ur in <br />
2011 and transit from Fremantle in 2012]. The nino4 in May 2011 was near zero, <br />
but we take it as representative of an El Niño condition relative <strong>to</strong> the La Niña <br />
condition of April 2012. Maximum La Niña phase occurred in December 2011. The <br />
South China Sea throughflow connection is from Gordon et al, 2012, GRL; Luzon <br />
Strait throughflow and ENSO from Hurlburt, et al., 2011, Oceanography. The <br />
relationship of the NEC bifurcation <strong>to</strong> ENSO is from Qiu and Chen 2010, JPO. <br />
<br />
During LB01 (neutral ENSO phase) the Kuroshio off the east coast of Luzon <br />
consisted mostly of Kuroshio recirculation gyre, composed of western North Pacific <br />
subtropical thermocline and Intermediate water water. Kuroshio off Luzon in LB02 <br />
(La Niña ENSO phase) is composed mainly of North Equa<strong>to</strong>rial Current (NEC) water, <br />
with its characteristic a more intense S‐max and weaker S‐min than that of the NW <br />
Pacific subtropical stratification. The Kuroshio recirculation gyre retreated <strong>to</strong> the <br />
north. LB02 flow pattern is about the same as LB01, though of higher <br />
speeds/transport, with a Kuroshio feeder current bracketed by the anticyclonic and <br />
cyclonic dipoles, but the thermohaline stratification composing the nascent <br />
Kuroshio has changed. It is likely that the changing nature of the nascent Kuroshio <br />
within <strong>Lamon</strong> <strong>Bay</strong> is a function of the ENSO sensitive North Equa<strong>to</strong>rial Current <br />
(NEC) bifurcation, as represented in the schematic. <br />
<br />
During La Niña the nascent Kuroshio transport increases and its composition <br />
incorporates greater amounts of tropical NEC water, as the bifurcation shifts <br />
southward (Qiu and Chen, 2010, JPO). Concurrently during La Niña the Kuroshio <br />
recirculation gyre regime retreats northward from <strong>Lamon</strong> <strong>Bay</strong>. In El Niño, as <br />
suggested by the LB01 neutral ENSO conditions, the NEC input is reduced and the <br />
Kuroshio recirculation gyre projects in<strong>to</strong> <strong>Lamon</strong> <strong>Bay</strong>. When the Luzon Strait <br />
westward throughflow is large during El Niño, that portion is expected <strong>to</strong> be drawn <br />
from the Kuroshio recirculation. <br />
The Mindanao Current transport is expected <strong>to</strong> vary out‐of‐phase with ENSO <br />
relative <strong>to</strong> the NEC feed in<strong>to</strong> <strong>Lamon</strong> <strong>Bay</strong>. This brings up interesting questions about <br />
the leakage of the Mindanao Current in<strong>to</strong> the Indonesian throughflow, which <br />
decreases in El Niño, opposite <strong>to</strong> the expected Mindanao transport. This may have <br />
something <strong>to</strong> do with the leakage dynamics from retroflection structures, i.e. the <br />
Mindanao retroflection [eddy] leakage in<strong>to</strong> the Sulawesi Sea and/or the South China <br />
Sea throughflow effect (Gordon et al., 2012, GRL, in press): ITF comment: During El <br />
Niño the SCS throughflow via Sibutu Passage blocks Mindanao surface layer leakage <br />
<strong>to</strong> Makassar Strait, which lowers the Makassar net transport, counteracting the <br />
greater Mindanao transport associated with the northern bifurcation position. <br />
§ Possible Implications of an ENSO [bifurcation] dependent Kuroshio source: <br />
• During La Niña there is increased injection of NEC tropical Pacific water in<strong>to</strong> the <br />
subtropical North Pacific; during El Niño the subtropical North Pacific is more <br />
'isolated' from the NEC. <br />
• The NEC enhanced Kuroshio transport during La Niña, leads <strong>to</strong> greater northward <br />
heat flux in<strong>to</strong> the North Pacific; and might reduce western pacific warm pool <br />
volume. <br />
• The NEC injection in<strong>to</strong> the subtropical regime, on climatic average (the integrated <br />
La Niña/El Niño phases), balances the loss of North Pacific water through the Bering <br />
Straits (~1 Sv) and through Luzon Strait (~3 Sv) in<strong>to</strong> the South China Sea (that most <br />
likely advects in<strong>to</strong> the Indian Ocean as part of the Indonesia Throughflow) , and <strong>to</strong> <br />
the export of North Pacific Intermediate water within the Mindanao Current (2 Sv?). <br />
During El Niño the Kuroshio recirculation gyre reaches in<strong>to</strong> <strong>Lamon</strong> <strong>Bay</strong>, it may be <br />
the primary feed the westward ‘leakage’ in<strong>to</strong> the South China Sea, (Luzon Strait <br />
westward transport is increased during El Niño, HYCOM, Hurbert et al 2011). In this <br />
way the Kuroshio recirculation gyre exports the accumulated NEC injected during <br />
the previous La Niña phases, that is not taken up by the Bering Straits and NPIW <br />
export. <br />
<strong>24</strong>
<br />
• More potential implications? effect on ecosystems, linkage with PDO, impact on <br />
ITF, west Pacific warm pool, etc.. <br />
§ Luzon Strait Survey, ship underway system and XBT: <br />
<br />
<br />
<br />
Figure 13a. ocean current vec<strong>to</strong>rs 21‐53 meters, color coded by SST and SSS within <br />
Luzon Strait . <br />
<br />
<br />
25
<br />
Figure 13b; XBT profiles in Luzon Strait <br />
isotherms tilt in a geostrophic way <br />
<br />
<br />
Acknowledgements: <br />
<strong>Lamon</strong> <strong>Bay</strong> <strong>cruise</strong> 2 was extraordinarily productive. With calm weather , no <br />
typhoon, we met our objectives. Our knowledge of the origin of the Kuroshio has <br />
been advanced. This was achieved with the support of a great ship, operated by <br />
dedicated 'can‐do' people: Captain Tom Desjardins established a good 'vibes' <br />
throughout the ship. Eric Wakeman, Melissa Turner and David Gilmartin handled <br />
the ship skillfully as the science group lowered and retrieved all sort of stuff in the <br />
ocean. The engineering group lead by chief Paul Mauricio kept things running <br />
smooth. The science team was effective, highly responsible, always there when <br />
needed. The Philippine group is a delight <strong>to</strong> work with. Special thanks is extended <strong>to</strong> <br />
my loyal, dedicated, research assistant, Phil Mele. Scripps ResTechs Meghan <br />
Donohue and Brett Hembrough are most competent and cheerful, allowing the <br />
science team <strong>to</strong> interface with the ship facilities seamlessly. It was so nice <strong>to</strong> sail <br />
again with Frank Delahoyde, who’s computer support allowed us <strong>to</strong> do more. Ship <br />
food just great, thanks <strong>to</strong> Jay Erickson and Steve Lamb. <br />
26 <br />
I am greatly appreciative of the assistance <strong>to</strong> the science program provided by Allan <br />
Noveno, the Philippine Navy Observer. <br />
<br />
I cannot think of anything negative <strong>to</strong> say about <strong>Revelle</strong> and its people. Great job! <br />
<br />
14 May 2012 <br />
Arnold L. Gordon, Chief Scientist <br />
<br />
<br />
<br />
§ University of the Philippines Marine Science Institute: Shelf Pacific Interaction in <br />
<strong>Lamon</strong> <strong>Bay</strong>, Philippines (SPIL), University of the Philippines Diliman, coordinated by <br />
Cesar Villanoy <br />
<br />
CTD Fluorometer LSS and Transmissometer: Olive Cabrera; <br />
Plank<strong>to</strong>n Sampling: Aletta Yniguez; <br />
Sediment cores: Fernando Siringan; <br />
Chemical Oceanography: Gil S. Jacin<strong>to</strong>, Maria Lourdes San Diego–McGlone, <br />
Maria Teresa L. Escobar, Maria Isabel S. Senal, Lara Patricia A. Sot<strong>to</strong>, Mary <br />
Chris L. Tentia; Atsushi Watanabe [pCO2, Tokyo Institute of Technology] <br />
<br />
§ Frank Delahoyde‐ SIO Shipboard Technical Support LB02 Shipboard CTD Data <br />
Acquisition and Processing <br />
<br />
§ Phil Mele‐ CTD stations map/table <br />
<br />
§ Meghan Donohue and Brett Hembrough‐ Research Marine Technician Group <br />
Report: RR<strong>1204</strong> Deck Operations; Dragging for TRBMs <br />
<br />
27
Introduction<br />
Philippine Component Cruise Report<br />
The Philippine component of the <strong>Lamon</strong> <strong>Bay</strong> Program is <strong>to</strong> investigate the interaction<br />
between the Philippine shelf and the northern branch of the North Equa<strong>to</strong>rial Current<br />
(NEC) and potential implications of these interactions on the biological productivity in the<br />
area. This <strong>cruise</strong> is the 2 nd and last of the oceanographic <strong>cruise</strong>s for the Office of Naval<br />
Research (ONR) funded <strong>Lamon</strong> <strong>Bay</strong> program in collaboration with Arnold Gordon of<br />
<strong>Lamon</strong>t Doherty Earth Observa<strong>to</strong>ry, Columbia University and Pierre Flament of the School<br />
of Oceanography and Earth Science and Technology, University of Hawaii. The data<br />
collected from the <strong>cruise</strong>s, moorings and coastal HFRADAR will be complemented by shelf<br />
surveys on board smaller chartered fishing boats.<br />
Data from the 2011 <strong>cruise</strong> and from satellite images have shown a strong link between the<br />
chlorophyll distribution patterns and circulation, highlighting the role of physical dynamics<br />
in shaping biological productivity patterns in this area. The Philippine component’s<br />
objective for this <strong>cruise</strong> is <strong>to</strong> gain an understanding on the distribution of chlorophyll<br />
pigment concentrations, water chemistry parameters, phy<strong>to</strong>plank<strong>to</strong>n and zooplank<strong>to</strong>n<br />
composition and abundance relevant <strong>to</strong> biological primary productivity and <strong>to</strong> relate these<br />
distributions <strong>to</strong> the physical environment. Sediment cores were also collected <strong>to</strong> analyze<br />
long-‐term variations of water column productivity. The water chemistry methods and<br />
preliminary results are described in the next report.<br />
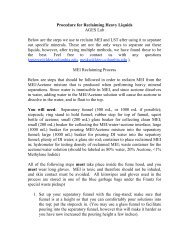
Methods<br />
Underway System and CTD Chlorophyll<br />
The RV <strong>Revelle</strong> has an underway and meteorological system that au<strong>to</strong>matically measures<br />
the parameters shown in Table 1. UW data are time and GPS location stamped. The UW<br />
system at the Hydrolab was flushed with freshwater at approximately 0000 H GMT<br />
everyday during the <strong>cruise</strong> <strong>to</strong> minimize biofouling of the sensors, particularly the<br />
fluorometer. Underway measurements were conducted all along the <strong>cruise</strong> track (Figure<br />
1). Water samples from the UW system were also collected at the CTD stations and filtered<br />
using GFF filters for chlorophyll analysis in the lab for validation of the chlorophyll<br />
fluorescence measurements.<br />
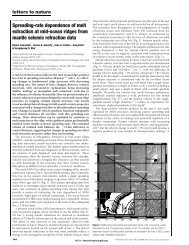
The main features of the circulation in the <strong>Lamon</strong> <strong>Bay</strong> area is the Kuroshio feeder current<br />
which is formed from the NEC and separates from the shelf at around 123.5°E. It flows<br />
northwest and at 16.5N becomes a western boundary current. Within <strong>Lamon</strong> <strong>Bay</strong>, the
dominant feature is the cyclonic dipole and is a rather steady feature nased on satellite data<br />
and 2011 and 2012 <strong>cruise</strong> data. The core of the Kuroshio feeder current forms the<br />
boundary between the low chlorophyll oligotrophic waters in the anticyclonic dipole <strong>to</strong> the<br />
east and the high chlorophyll waters of the cyclonic dipole <strong>to</strong> the west (Figure 3a). The<br />
cyclonic dipole in <strong>Lamon</strong> <strong>Bay</strong> can be discerned from the chlorophyll concentration<br />
distribution patterns and is consistent with overlain underway surface velocity vec<strong>to</strong>rs<br />
(Figure 3b and c).<br />
The underway data confirms what the satellite data show. Chlorophyll concentrations<br />
along the <strong>cruise</strong> track distinctly separates the <strong>Lamon</strong> <strong>Bay</strong> waters from the rest in terms of<br />
salinity and chlorophyll a (Figure 4). Chlorophyll profiles from the CTD data also confirm<br />
the difference in subsurface chlorophyll between the dipoles. A vertical section of<br />
chlorophyll from the surface <strong>to</strong> 300m depth extending from the channel between Polillo<br />
Island and Luzon <strong>to</strong> the northeast across the Kuroshio feeder shows a decrease in surface<br />
chlorophyll concentration and a weakening and deepening of the deep chlorophyll<br />
maximum (DCM) from 75m <strong>to</strong> 135m (Figure 5). The relatively higher chlorophyll<br />
concentration in <strong>Lamon</strong> <strong>Bay</strong> is most likely sustained by nutrient input from riverine<br />
sources (lower surface salinity) and from upwelling associated with the cyclonic dipole.<br />
Table 1. RV <strong>Revelle</strong> Underway/MET Parameters<br />
Parameter Name<br />
Air Temperature<br />
Barometer<br />
Relative Humidity<br />
Wind<br />
Precipitation<br />
Long Wave Radiation<br />
Short Wave Radiation<br />
Surface PAR<br />
Sea surface Temperature<br />
Sea surface salinity<br />
Chlorophyll fluorescense<br />
Dissolved oxygen
19 o N<br />
18 o N<br />
17 o N<br />
16 o N<br />
15 o N<br />
14 o N<br />
13 o N<br />
121 o E 122 o E 123 o E 1<strong>24</strong> o E 125 o E 126 o E 127 o 12<br />
E<br />
o N<br />
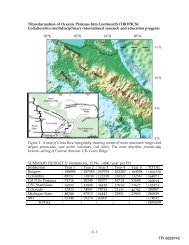
Figure 1. Cruise Track (red lines) and station locations (black -‐ CTD only, blue -‐ CTD + water chemistry, red -‐<br />
CTD + water chemistry + carbonate chemistry).<br />
Student Version of MATLAB
19 o N<br />
18 o N<br />
17 o N<br />
16 o N<br />
15 o N<br />
14 o N<br />
13 o N<br />
121 o E 122 o E 123 o E 1<strong>24</strong> o E 125 o E 126 o E 127 o 12<br />
E<br />
o N<br />
Figure 2. Plank<strong>to</strong>n net <strong>to</strong>w (left) and sediment gravity core (right) stations.<br />
19 o N<br />
18 o N<br />
17 o N<br />
16 o N<br />
15 o N<br />
14 o N<br />
13 o N<br />
121 o E 122 o E 123 o E 1<strong>24</strong> o E 125 o E 126 o E 127 o 12<br />
E<br />
o N<br />
Student Version of MATLAB<br />
Student Version of MATLAB
Figure 3. MODIS chlorophyll-‐a image for April 26, 2012 overlain with inferred circulation (A) and actual<br />
current velocities from hull-‐mounted Acoustic Doppler Current Profiler (B & C).
Figure 4. Underway measurements of temperature (<strong>to</strong>p left, °C), salinity (<strong>to</strong>p right, psu), and<br />
chlorophyll (bot<strong>to</strong>m, mg/m3).
Figure 5. Chlorophyll (V) section from channel west of Polillo across the nascient Kuroshio.<br />
Figure 6. Map of the 400m deep hole southwest of Polillo Island.
Oxygen<br />
While looking for potential sources of subsurface low oxygen water observed in the<br />
CTD profiles, We also investigated the small 400m deep basin within the shelf area<br />
southwest of Polillo Island (Figure 6). The deepest connection between this basin<br />
and the outside is 200m (Figure 7). At 380 m, the<br />
temperature difference between the basin and the adjacent <strong>Lamon</strong> <strong>Bay</strong> is about 8°C.<br />
This high temperature may be partly responsible for the difference in apparent<br />
oxygen utilization (AOU) between the basin and adjacent stations from 150-‐400m<br />
depth (Figure 8).<br />
Figure 7. Along channel temperature and salinity profiles. Heavy red line represent profiles from the<br />
basin.
PrDM<br />
0<br />
100<br />
200<br />
300<br />
400<br />
500<br />
50 100 150<br />
Sbeox0Mm/Kg<br />
200<br />
Figure 8. Dissolved oxygen concentration and AOU profiles for Stations 35-‐38.<br />
15°N<br />
Plank<strong>to</strong>n Sampling and Determination<br />
Based on the analyzed data from the <strong>cruise</strong> held last year, there was a difference in<br />
both phy<strong>to</strong>plank<strong>to</strong>n and zooplank<strong>to</strong>n composition for each of the identified water<br />
14°N<br />
/Users/cesarvillanoy/Desk<strong>to</strong>p/spil/SIO/LAM2012_allctd.var<br />
121.6°E 122°E<br />
/Users/cesarvillanoy/Desk<strong>to</strong>p/spil/SIO/DefaultView.xview<br />
circulation features in <strong>Lamon</strong> <strong>Bay</strong> and the northeastern /Users/cesarvillanoy/Desk<strong>to</strong>p/spil/SIO/LAM2012_allctd.sec<br />
part of the Philippines.<br />
2012-05-10T10:29:38<br />
These were the Kuroshio feeder stream, anti-‐ and cyclonic dipoles, and Polillo<br />
current. Plank<strong>to</strong>n composition was based only on samples collected using Niskin<br />
bottle samplers. For this <strong>cruise</strong>, however, both bottle samplers and bongo nets were<br />
used <strong>to</strong> collect plank<strong>to</strong>n samples. Sixty-‐six (66) CTD stations were chosen for<br />
collection using Niksin bottles and fifteen (15) stations for bongo net deployment<br />
(Figure 2). Two types (oblique and vertical) of net deployment were employed on<br />
selected stations strategically chosen <strong>to</strong> represent the different water circulation<br />
features in the study area, particularly <strong>Lamon</strong> <strong>Bay</strong>. The target taxa <strong>to</strong> be identified<br />
are the general groups of phy<strong>to</strong>-‐, zoo-‐, and ichthyoplank<strong>to</strong>n. Data from both <strong>cruise</strong>s<br />
would ideally answer queries such as (1) What types of fish larvae are found in the<br />
different areas? (2) What are the potential and actual prey of these fish larvae? (3)<br />
What is the general plank<strong>to</strong>n composition of the bay and how abundant are they?<br />
and (4) How are the trophic dynamics affected by hydrodynamic features?<br />
Collection and preservation of plank<strong>to</strong>n samples<br />
Niskin Bottles<br />
14.5°N<br />
PrDM<br />
Ocean Data View<br />
0<br />
100<br />
200<br />
300<br />
400<br />
500<br />
0 50 100 150 200 250<br />
AOU [µmol/kg]<br />
Ocean Data View<br />
Plank<strong>to</strong>n sampling was done through filtration of 10L water samples per depth<br />
obtained from Niskin bottles attached <strong>to</strong> a rosette. Five general depths for deep<br />
stations were (1) subsurface (1m), (2) above the deep chlorophyll maximum (DCM),<br />
(3) DCM, (4) below the DCM and (5) 200 meters. Modifications were made for some<br />
stations where either there were more than one DCMs observed or the DCM covered<br />
a wider depth profile. The modifications included an upper and lower DCM or an<br />
upper limit of DCM, middle of DCM and lower limit of DCM. Samples for each depth<br />
Ocean Data View<br />
odv cesarvillanoy@dhcp-1-68-a8-6d-11-f9-78.rrevelle.sio.ucsd.edu
were equally divided in<strong>to</strong> two with one half sieved and fixed for phy<strong>to</strong>plank<strong>to</strong>n<br />
analysis, and the other half for zooplank<strong>to</strong>n. Samples for phy<strong>to</strong>plank<strong>to</strong>n analysis<br />
were first subjected <strong>to</strong> a multi-‐excitation fluorescence sensor (Infinity-‐ME) before<br />
being sieved. Samples will be brought back <strong>to</strong> the lab for further analysis using the<br />
FlowCAM and conventional microscopy. Sample description and fixatives used are<br />
described in Table 2.<br />
Bongo Nets<br />
Bongo nets with a mouth diameter of 60cm, length of 2.5m and mesh size of 335µm<br />
were used for either oblique or vertical <strong>to</strong>wing.<br />
A <strong>to</strong>tal of 9 vertical <strong>to</strong>ws were conducted for quantitative and qualitative analysis of<br />
ichthyoplank<strong>to</strong>n. Flowmeters were placed at the center of each ring and a 20kg<br />
weight was attached in the middle of the two rings. The nets were deployed down <strong>to</strong><br />
200m at a rate of 30m/min and retrieved at a rate of 20m/min. Approximately 5ml<br />
of soda water was poured in<strong>to</strong> each cod end and carefully mixed, before sieving of<br />
the samples. This is <strong>to</strong> prevent the fish larvae from eviscerating. Samples from each<br />
cod end were split in half using a Folsom splitter. Half of the sample was sieved with<br />
a cu<strong>to</strong>ut of a 64µm mesh, placed in a petri dish, sealed and placed in the freezer.<br />
These will be used for gut pigment analysis <strong>to</strong> be conducted in the lab. The other<br />
half of the sample was further split in<strong>to</strong> two, sieved through a 200µm mesh and<br />
placed in wide-‐mouthed plastic bottles. One was fixed with ethanol and the other<br />
with neutralized formalin. Both samples will be sorted for fish larvae then analyzed<br />
for zooplank<strong>to</strong>n composition and abundance using the FlowCAM and conventional<br />
microscopy.<br />
Oblique <strong>to</strong>ws were conducted for qualitative analysis of ichthyoplank<strong>to</strong>n. A net<br />
depressor (~12kg) attached with additional weights (20kg) was used for these<br />
<strong>to</strong>ws. Three <strong>to</strong> four pieces of menthol crystal was placed in each cod end <strong>to</strong> subtly<br />
subdue any jellies caught <strong>to</strong> prevent them from preying on any fish larvae. The nets<br />
were deployed down <strong>to</strong> 200m for 4 stations and 100m for 2 stations at a rate of<br />
30m/min. The ship speed was kept at a range of 0.1 <strong>to</strong> 0.6 knots maintaining a 45°<br />
of the cable while simultaneously retrieving the nets at a rate of 15m/min. Samples<br />
from each cod end were transferred in separate bins and observed for fish larvae.<br />
Larvae were then isolated and fixed in ethanol with a drop of glycerin. Identification<br />
and gut analysis will be conducted back in the lab.<br />
Details of bongo net samples are described in Table 2. All further labora<strong>to</strong>ry work<br />
will be conducted at the UP-‐MSI lab.
Table 2. Description of samples collected<br />
Sampling<br />
apparatus<br />
1 Niskin bottles Filtered with 20µm<br />
sieve<br />
2 Niskin bottles Filtered with 20µm<br />
sieve<br />
3 Bongo nets<br />
(335µm)<br />
4 Bongo nets<br />
(335µm)<br />
5 Bongo nets<br />
(335µm)<br />
6 Bongo nets<br />
(335µm)<br />
Infinity-ME Analysis<br />
Sample description Fixative Target taxa <strong>to</strong> be analyzed<br />
Filtered with 64µm<br />
sieve<br />
Filtered with 200µm<br />
sieve<br />
Filtered with 200µm<br />
sieve<br />
Isolated from oblique<br />
<strong>to</strong>ws<br />
Neutralized<br />
formalin<br />
Phy<strong>to</strong>plank<strong>to</strong>n<br />
Ethanol Zooplank<strong>to</strong>n<br />
frozen Gut pigment analysis of zooplank<strong>to</strong>n and<br />
ichthyoplank<strong>to</strong>n<br />
Neutralized<br />
formalin<br />
Gelatinous zooplank<strong>to</strong>n and Ichthyoplank<strong>to</strong>n<br />
Ethanol Zooplank<strong>to</strong>n and Ichthyoplank<strong>to</strong>n<br />
Ethanol Ichthyoplank<strong>to</strong>n (larvae) for gut analysis<br />
A Multi-‐wavlengthExcitation Fluorometer(Infinity ME) has been developed by JFE<br />
Advantech Co., Ltd, which uses 12 light-‐emitting diodes <strong>to</strong> illuminate nine excitation<br />
wavelengths (375, 395, 420, 435, 470, 490, 535, 570, 590 nm) and record the<br />
inherent absorption spectra of phy<strong>to</strong>plank<strong>to</strong>n species, thereby obtaining a more<br />
rapid means of distinguishing phy<strong>to</strong>plank<strong>to</strong>n types. The absorptions are calibrated<br />
<strong>to</strong> chl a units. The current calibration file from the manufacturer is based on<br />
Chae<strong>to</strong>ceros sp. as the representative species for dia<strong>to</strong>ms, Microcystis sp. for<br />
cyanobacteria, and Nannochlorophsis sp. for green algae. This instrument was used<br />
<strong>to</strong> analyze the discrete depth samples obtained from the Niskin bottles.<br />
Representative stations from the key circulation features (Polilio Current, Cyclonic<br />
Dipole, Anti-‐cyclonic dipole, and Kuroshio Feeder Stream) previously seen were<br />
initially analyzed. The very partial results from the Infinity-‐ME showed that<br />
cyanobacteria and dia<strong>to</strong>ms concentrations were relatively high in all representative<br />
stations among the four circulation zones (Figure 9). Green algae were exhibited low<br />
concentrations in all stations. Dia<strong>to</strong>ms tended <strong>to</strong> have uni-‐modal distribution,<br />
possibly contributing <strong>to</strong> the DCM, while the cyanobacteria had two peaks that were<br />
at depths where dia<strong>to</strong>ms were not abundant (except for station 48 which only<br />
peaked above the dia<strong>to</strong>m peak). The cyanobacteria group were particularly high in<br />
concentrations at station 48 located within the zone of the anti-‐cyclonic dipole.<br />
During some of the sample runs with the FlowCAM (see section below discussing<br />
this), the cyanobacteria Trichodesmium was often observed.
Figure 9. Vertical profiles of phy<strong>to</strong>plank<strong>to</strong>n groups of representative stations for the four circulations<br />
zones: Polilio Current (PC), Cyclonic Dipole (CD), Anti-‐Cyclonic Dipole (ACD) and Kuroshio<br />
Feeder Stream (KFS). The (a) dia<strong>to</strong>m group is represented by Chae<strong>to</strong>ceros sp., Microcystis sp.<br />
for cyanobacteria (b) and Nannochloropsis sp. for the green algae group (c).<br />
FlowCAM analysis<br />
A FlowCAM (Flow Cy<strong>to</strong>meter and Microscope) purchased through ONR funds was<br />
used on board <strong>to</strong> optimize analysis of live samples, and <strong>to</strong> develop a library for<br />
future au<strong>to</strong>mated classification of plank<strong>to</strong>n. Extra water from DCMs of selected<br />
stations were collected, sieved with a 20µm and diluted <strong>to</strong> ~10ml. Serial sieving<br />
(300µm, 100µm and 20µm) was then done <strong>to</strong> sort the samples according <strong>to</strong> size.<br />
Au<strong>to</strong>image mode<br />
Samples less than 300µm but greater than 100µm were run through a 300µm<br />
flowcell under 4X magnification. Particles or organisms are pho<strong>to</strong>graphed as they<br />
flow through the flow cell at a rate of 0.100ml/min. Figure 10 is a partial visual<br />
spreadsheet of one of the runs on au<strong>to</strong>image mode.<br />
Trigger mode<br />
Samples less than 100µm but greater than 20µm were run through a 100µm flowcell<br />
under 100X magnification. Particles or organisms with pigments that react <strong>to</strong> the<br />
laser and fluoresce are pho<strong>to</strong>graphed as they flow through the flow cell at a rate of<br />
0.080ml/min. Figure 11 is a partial visual spreadsheet of one of the runs on trigger<br />
mode.
Figure 10. Samples from DCM of Station 57 under au<strong>to</strong>image mode.<br />
Figure 11. Samples from upper DCM of Station 68 under trigger mode.
Sediment Coring<br />
The OSU gravity corer was used <strong>to</strong> obtain sediment samples during the <strong>Lamon</strong> <strong>Bay</strong><br />
2012 Cruise (Figure 12 and Figure 13). Figure 14 shows the nine sampling stations<br />
that were occupied during the <strong>cruise</strong>. Out of the nine stations, eight were<br />
successfully sampled. After the collection of the sediment cores, styro plugs were<br />
placed in the pipes as s<strong>to</strong>ppers and then covered with core caps in both ends. The<br />
sediment cores were sealed using a duct tape and were s<strong>to</strong>red at room with 42ºF<br />
(5.56ºC). The coordinates, core lengths and water depths of each sampling were<br />
recorded. Table 3 shows the summary of samples acquired during the <strong>cruise</strong>.<br />
Figure 12. The OSU gravity corer during retrieval.<br />
Figure 13. One of the sediment cores and the <strong>to</strong>p view of its sediment.
Table 3. Core sampling stations.<br />
Figure 14. Core stations<br />
Sampling Date Core ID Latitude Longitude Water Depth (m) Length (m)<br />
April 28, 2012 1 15 9.7044 N 123 17.40<strong>24</strong> E 1580 1.75<br />
April 28, 2012 2 15 44.7660 N 123 58.3686 E 2990 1.35<br />
April 30, 2012 3 15 21.3690 N 122 1.4268 E 2228 1.45<br />
April 30, 2012 x 15 38.1408 N 121 58.7850 E 2500 X<br />
May 1, 2012 4 14 23.6112 N 121 44.5080 E 388 2.15<br />
May 4, 2012 5 16 45.0276 N 1<strong>24</strong> 15.0042 E 2820 2.30<br />
May 6, 2012 6 17 46.2018 N 123 15.7290 E 2600 0.96<br />
May 10 ,2012 7 18 35.3148 N 122 0.0150 E 550 1.96<br />
May 10, 2012 8 18 57.0000 N 121 0.0850 E 325 0.30<br />
Note: x-‐ indicates that no sediment was retrieved<br />
Future Analysis<br />
The sediment cores will be used <strong>to</strong> reconstruct primary productivity, upwelling and<br />
paleoclimate during the last few thousand years. It is expected that the cores will<br />
yield different temporal resolutions. Of specific interest is the past 2000 years. An<br />
XRF-‐core scanner will be used for the initial analysis <strong>to</strong> help pick which cores <strong>to</strong><br />
analyze in detail. Combinations of geochemical proxies, paleon<strong>to</strong>logical and<br />
biomarker indica<strong>to</strong>rs will be utilized for the reconstructions.
Shelf Pacific Interaction in <strong>Lamon</strong> <strong>Bay</strong>,<br />
Philippines (SPIL)<br />
Chemical Oceanography<br />
R/V Roger <strong>Revelle</strong><br />
Marine Science Institute, University of the Philippines and Tokyo Institute of<br />
Technology<br />
<strong>24</strong> April – 12 May 2012
Introduction<br />
Shelf Pacific Interaction in <strong>Lamon</strong> <strong>Bay</strong>, Philippines (SPIL)<br />
Chemical Oceanography<br />
R/V Roger <strong>Revelle</strong><br />
<strong>24</strong> April – 12 May 2012<br />
Cruise Report<br />
The <strong>cruise</strong> in 2012 offered another opportunity <strong>to</strong> study <strong>Lamon</strong> <strong>Bay</strong> and the Bicol Shelf area. This<br />
eastern coast and shelf of Luzon is a unique area encompassed by the bifurcation of the western<br />
boundary North Equa<strong>to</strong>rial Current (NEC) in<strong>to</strong> the Kurushio and Mindanao Currents. The shelf<br />
configuration is fairly complicated with a unique shelf extension (“bump”) along the edge near<br />
15.5°N and 123.5°E as well as unusual shallowing at the edge before the depth increases at the<br />
slope. The complex <strong>to</strong>pography of the Bicol shelf is hypothesized <strong>to</strong> result in the formation of<br />
westward moving eddy structures originating from northward branch of the bifurcation of the NEC.<br />
These features appear <strong>to</strong> provide nutrients <strong>to</strong> the less productive offshore areas as they entrain<br />
chlorophyll-‐rich waters from the shelf.<br />
The chemical oceanography component of SPIL aims <strong>to</strong> understand how the interaction between the<br />
shelf and open ocean and its influence on coastal processes are characterized by chemical features<br />
(C, N, P) of the Bicol Shelf and off-‐shelf areas. The following are some questions this component<br />
hopes <strong>to</strong> address:<br />
1. Which chemical parameters indicate the presence of upwelling on the Bicol Shelf?<br />
2. Is there cross-‐shelf exchange of C, N, and P?<br />
3. How do physical processes (e.g. upwelling) affect the biogeochemistry of C, N, and P?<br />
4. What forms (organic or inorganic) of C and N are exported or accumulated from the shelf <strong>to</strong><br />
off-‐shelf, or <strong>to</strong> the open sea and within and outside eddies?<br />
5. What nutrients or physical properties limit primary production in the shelf?<br />
6. Is the Bicol shelf a source (upwelling) or sink (primary production) of carbon?<br />
7. Is ocean pH lower on the shelf (due <strong>to</strong> upwelling)? Are pH changes/differences associated<br />
with anthropogenic activities (on the shelf area and near the coast) distinguishable from<br />
water column biological processes?<br />
8. What insights on ocean acidification can we gain from the behavior of the carbonate-‐related<br />
parameters (pH, alkalinity and DIC) on the shelf area and the impinging NEC?<br />
Methodology<br />
University of the Philippines, Marine Science Institute:<br />
Gil S. Jacin<strong>to</strong>, Maria Lourdes San Diego – McGlone, Maria Teresa L. Escobar,<br />
Maria Isabel S. Senal, Lara Patricia A. Sot<strong>to</strong>, Mary Chris L. Tentia<br />
Tokyo Institute of Technology:<br />
Atsushi Watanabe
Shelf Pacific Interaction in <strong>Lamon</strong> <strong>Bay</strong>, Philippines (SPIL)<br />
Chemical Oceanography<br />
R/V Roger <strong>Revelle</strong><br />
<strong>24</strong> April – 12 May 2012<br />
Collection of water samples from selected depths using the CTD-‐rosette was done for a suite of<br />
chemical parameters (Table 1). Sampling strategy was either a “full cast” or “normal cast”. There<br />
were 13 “full casts” from shelf and off-‐shelf stations where samples for all the chemical parameters<br />
were obtained. The rest of the stations had “normal casts” where water samples for only selected<br />
parameters were acquired (Figure 1). Water samples at varying depths (typically 4 depths including<br />
a few from 1500m) were also obtained for Winkler oxygen determination starting at Station 10 until<br />
Station 40 at intermittent stations (<strong>to</strong>tal of 14) <strong>to</strong> calibrate the CTD DO sensor. Primary productivity<br />
measurements were done at 3 sites (representing offshore, shelf and mid-‐section stations) using the<br />
light and dark bottle method. Table 2 summarizes the parameters obtained at the sampling stations.<br />
University of the Philippines, Marine Science Institute:<br />
Gil S. Jacin<strong>to</strong>, Maria Lourdes San Diego – McGlone, Maria Teresa L. Escobar,<br />
Maria Isabel S. Senal, Lara Patricia A. Sot<strong>to</strong>, Mary Chris L. Tentia<br />
Tokyo Institute of Technology:<br />
Atsushi Watanabe
Shelf Pacific Interaction in <strong>Lamon</strong> <strong>Bay</strong>, Philippines (SPIL)<br />
Chemical Oceanography<br />
R/V Roger <strong>Revelle</strong><br />
<strong>24</strong> April – 12 May 2012<br />
Table 1. Sea water samples obtained for determination of various chemical parameters.<br />
Parameter<br />
Dissolved oxygen<br />
(DO)<br />
Dissolved<br />
inorganic carbon,<br />
<strong>to</strong>tal alkalinity,<br />
pH (CO2) Onboard pH (pH)<br />
Dissolved organic<br />
carbon (DOC )<br />
Total dissolved<br />
nitrogen and<br />
phosphorus (TDN<br />
and TDP)<br />
Chromophoricdis<br />
solved organic<br />
matter (CDOM )<br />
Particulate<br />
organic carbon<br />
and nitrogen<br />
(POC, PON)<br />
Nutrients (DIN,<br />
DIP, silicate)<br />
Chlorophyll-‐a<br />
(Chl-‐a)<br />
Primary<br />
productivity<br />
Sampling<br />
strategy<br />
All stations,<br />
selected depths 1.0<br />
Volume<br />
required (L) Sample preparation Analysis Method of analysis<br />
Silicone tubing,<br />
overflow On board<br />
Overflow,<br />
preservation with<br />
HgCl 2<br />
Spectropho<strong>to</strong>metric<br />
method, Winkler titration<br />
method<br />
DIC analyzer,<br />
spectropho<strong>to</strong>metric<br />
method, titration<br />
14 stations, all<br />
depths<br />
All stations, all<br />
1.0<br />
Lab<br />
depths 0.05 None On board pH meter<br />
14 stations, all<br />
depths 0.05<br />
14 stations, all<br />
depths 0.15<br />
14 stations,<br />
selected depths 0.2<br />
Underway pCO2 measurement<br />
In-‐line filter,<br />
overflow,<br />
preservation with<br />
acid Lab<br />
In-‐line filter,<br />
overflow Lab<br />
In-‐line filter,<br />
overflow<br />
Lab and on<br />
board<br />
High temperature<br />
combustion oxidation<br />
Persulphate oxidation,<br />
analyze as DIN<br />
Fluorescence via bench<strong>to</strong>p<br />
fluorometer<br />
14 stations, all<br />
depths 4.5 Filtration (manifold) Lab CHN elemental analyzer<br />
Colorimetric method with<br />
All stations, all<br />
segmented flow nutrient<br />
depths<br />
All stations,<br />
0.3 none Lab au<strong>to</strong>analyzer<br />
selected depths 2.5 Filtration (manifold) Lab Fluorometric<br />
Light and dark bottle<br />
method,<br />
BOD bottles,<br />
Spectropho<strong>to</strong>metric<br />
14 stations,<br />
incubation for 4<br />
method and Winkler<br />
selected depths 10<br />
hours in a water bath On board titration<br />
Seawater pumped up from 3-‐4m below sea level by the ship at a flow rate of ca. 20L min -‐1 was<br />
continuously fed <strong>to</strong> a plastic container (approx. 100L) set on the deck outside Hydro Lab. Inside the<br />
container, an equilibra<strong>to</strong>r for pCO2 analyzer was set. A gas-‐permeable membrane tube was used <strong>to</strong><br />
equilibrate seawater CO2 with sample air [Sai<strong>to</strong> et al., 1995]. Then the equilibrated CO2 in the dry air<br />
was measured with a non-‐dispersive infrared analyzer (NDIR: Li-‐Cor 820) set in the Hydro Lab<br />
(Kimo<strong>to</strong> CO2-‐09). The NDIR was calibrated every 6-‐hr using a series of CO2 standard gases (0,<br />
498ppm). Atmospheric CO2 was measured 10 min every hour, and rest of the time seawater CO2<br />
was measured.<br />
University of the Philippines, Marine Science Institute:<br />
Gil S. Jacin<strong>to</strong>, Maria Lourdes San Diego – McGlone, Maria Teresa L. Escobar,<br />
Maria Isabel S. Senal, Lara Patricia A. Sot<strong>to</strong>, Mary Chris L. Tentia<br />
Tokyo Institute of Technology:<br />
Atsushi Watanabe
Shelf Pacific Interaction in <strong>Lamon</strong> <strong>Bay</strong>, Philippines (SPIL)<br />
Chemical Oceanography<br />
R/V Roger <strong>Revelle</strong><br />
<strong>24</strong> April – 12 May 2012<br />
Temperature & salinity meter (Compact-‐CT, JFE Advantec), Chl-‐a & Turbidity meter (Compact-‐CKU,<br />
JFE Advantec), and DO meter (AROW, JFE Advantec) were also set in the container. TS was measured<br />
every 1 min, Chl-‐a&Turb, DO were measured every 5 min, respectively. Samples for carbonate<br />
system parameters were collected from the container at all the stations except for Stations 33, 71<br />
and 78 (N =75). Samples for Chl-‐a and DO were also collected from the container 2 times or 3 times<br />
every day from May 4 <strong>to</strong> May 9 (N =14) in order <strong>to</strong> calibrate the sensors.<br />
Water collections from the CTD/rosette<br />
Waters for carbonate system parameters and H2O iso<strong>to</strong>pes (δ 18 O and δ 2 H) were collected from the<br />
CTD/rosette at 1m depth on all stations except for Stations 33, 73 and 78 (N=75). Vertical samplings<br />
were conducted at Stations 5,10,15,20,25,30,35,40,45,50,55,59,65, and 70 (N =195).<br />
All the samples for carbonate system parameters (<strong>to</strong>tal alkalinity, dissolved inorganic carbon, pH)<br />
were analyzed on board within 12 hours after collection, using a close-‐cell titration system (Kimo<strong>to</strong><br />
ATT05). Samples were kept in a water bath at 25 o C until just before the analysis.<br />
Figure 1. Stations occupied for water sampling<br />
University of the Philippines, Marine Science Institute:<br />
Gil S. Jacin<strong>to</strong>, Maria Lourdes San Diego – McGlone, Maria Teresa L. Escobar,<br />
Maria Isabel S. Senal, Lara Patricia A. Sot<strong>to</strong>, Mary Chris L. Tentia<br />
Tokyo Institute of Technology:<br />
Atsushi Watanabe
Table 2. Summary of parameters obtained per station<br />
CTD Lat Long DO pH nutrients chl-‐a CDOM CO2 DOC TDN<br />
POC/<br />
PN<br />
primary<br />
prod<br />
DCM<br />
depth (m)<br />
1 14.26 1<strong>24</strong>.239 l l l l l l l l l 100<br />
2 14.50 1<strong>24</strong>.<strong>24</strong>9 l l l l l 105<br />
3 14.75 1<strong>24</strong>.250 l l l l l l l l l 105<br />
4 15.00 1<strong>24</strong>.251 l l l l l<br />
5 15.25 1<strong>24</strong>.250 l l l l l l l l l 140<br />
6 15.50 1<strong>24</strong>.250 SKIPPED<br />
7 15.75 1<strong>24</strong>.211 l l l l l 140<br />
8 16.00 1<strong>24</strong>.251 l l l l l 145<br />
9 16.00 1<strong>24</strong>.251 l l l l l 140<br />
10 16.50 1<strong>24</strong>.251 l l l l l 140<br />
11 16.50 1<strong>24</strong>.002 l l l l l 135<br />
12 16.50 123.747 l l l l l 135<br />
13 16.50 123.498 l l l l l 135<br />
14 16.50 123.250 l l l l l 140<br />
15 16.50 123.009 l l l l l l l l l 135<br />
16 16.50 122.750 l l l l l l l l l 105<br />
17 16.50 122.500 l l l l l 105<br />
18 16.25 123.<strong>24</strong>9 l l l l l 145<br />
19 16.00 123.250 l l l l l 125<br />
20 15.75 123.250 l l l l l l l l l l 125<br />
21 15.50 123.250 l l l l l 100<br />
22 15.16 123.290 l l l l l l l l l 90<br />
23 14.76 122.972 l l l l l 65<br />
<strong>24</strong> 14.95 123.722 l l l l l 120<br />
25 15.75 123.973 l l l l l 140<br />
26 16.00 123.000 l l l l l 135<br />
27 15.75 122.750 l l l l l l l l l 135<br />
28 15.50 122.501 l l l l l 135<br />
29 15.25 122.<strong>24</strong>7 l l l l l 135<br />
30 15.12 122.000 l l l l l l 110<br />
31 15.36 122.0<strong>24</strong> l l l l l l l l l 100<br />
32 15.64 121.978 l l l l l 100<br />
33 15.82 121.741 SKIPPED<br />
34 15.20 121.756 l l l l l 95<br />
35 14.39 121.742 l l l l l l l l l 60<br />
36 14.53 121.806 l l l l l l l l l 75<br />
37 14.76 121.805 l l l l l 75<br />
38 14.98 121.719 l l l l l 75<br />
39 15.17 122.502 l l l l l 75<br />
40 15.00 122.499 l l l l l 70<br />
41 14.89 122.499 l l l l l l l l l 91<br />
42 16.75 1<strong>24</strong>.250 l l l l l 130
Shelf Pacific Interaction in <strong>Lamon</strong> <strong>Bay</strong>, Philippines (SPIL)<br />
Chemical Oceanography<br />
R/V Roger <strong>Revelle</strong><br />
<strong>24</strong> April – 12 May 2012<br />
43 17.00 1<strong>24</strong>.250 l l l l l 140<br />
44 17.25 1<strong>24</strong>.250 l l l l l 125<br />
45 17.50 1<strong>24</strong>.250 l l l l l 115<br />
46 17.75 1<strong>24</strong>.251 l 100<br />
47 18.00 1<strong>24</strong>.251 l l l l l 100<br />
48 18.25 1<strong>24</strong>.250 l l l l l l l l l 135<br />
49 18.35 123.999 l l l l l 138<br />
50 18.35 123.750 l<br />
51 18.35 123.501 l l l l l 125<br />
52 18.35 123.<strong>24</strong>9 l<br />
53 18.35 123.001 l l l l l 135<br />
54 18.35 122.750 l 130<br />
55 18.35 122.500 l l l l l 105<br />
56 17.12 122.567 l l l l l 75<br />
57 17.12 122.749 l l l l l 110<br />
58 17.12 123.000 l l l l l<br />
59 17.12 123.251 l l l l l 150<br />
60 17.12 123.500 l<br />
61 17.12 123.750 l l l l l 140<br />
62 17.12 1<strong>24</strong>.000 l l 100<br />
63 17.12 1<strong>24</strong>.250 l l l l l<br />
64 17.12 125.000 l l l l l 135<br />
65 17.12 126.000 l l l l l 130<br />
66 19.00 126.000 l l l l l 120<br />
67 19.00 125.500 l l l l l<br />
68 19.00 125.000 l l l l l 110/ 120<br />
69 19.00 1<strong>24</strong>.500 l<br />
70 19.00 1<strong>24</strong>.000 l l l l l 120<br />
71 19.00 123.500 l<br />
72 19.00 123.000 l l l l l 115<br />
73 19.00 122.750 l<br />
74 19.00 122.500 l l l l l 130<br />
75 19.00 122.250 l 130<br />
76 19.00 122.000 l l l l l<br />
77 18.35 122.002 l l l<br />
78 18.47 121.520 l l l<br />
University of the Philippines, Marine Science Institute:<br />
Gil S. Jacin<strong>to</strong>, Maria Lourdes San Diego – McGlone, Maria Teresa L. Escobar,<br />
Maria Isabel S. Senal, Lara Patricia A. Sot<strong>to</strong>, Mary Chris L. Tentia<br />
Tokyo Institute of Technology:<br />
Atsushi Watanabe
Initial Results and Discussion<br />
Dissolved oxygen calibration<br />
A good correlation was obtained (r 2 = 0.9934) between the CTD-‐ and the Spectropho<strong>to</strong>meter-‐derived<br />
DO values, with a slope of 1.0502 (n=<strong>24</strong>8) (Figure 2).<br />
0.0 1.0 2.0 3.0 4.0<br />
DO from spec<strong>to</strong>pho<strong>to</strong>metric method<br />
5.0<br />
Figure 2. Comparison of DO obtained using the Spectropho<strong>to</strong>metric method and the CTD DO sensor<br />
pH calibration<br />
DO from CTD sensor<br />
5.0<br />
4.0<br />
3.0<br />
2.0<br />
1.0<br />
0.0<br />
DO (ml/L) correlaAon<br />
y = 1.050x + 0.164<br />
R² = 0.993<br />
Good correlation (r=0.9972) was also obtained between pH measured using the pH meter (Metrohm<br />
654) and the Total Alkalinity titra<strong>to</strong>r (Kimo<strong>to</strong> ATT-‐05) (Figure 3). Calibration line: y=0.97<strong>24</strong>x +<br />
0.2346; n=134.<br />
Figure 3. Comparison of pH obtained using the pH meter and <strong>to</strong>tal alkalinity titra<strong>to</strong>r
Verical profiles<br />
DO profiles<br />
Shelf Pacific Interaction in <strong>Lamon</strong> <strong>Bay</strong>, Philippines (SPIL)<br />
Chemical Oceanography<br />
R/V Roger <strong>Revelle</strong><br />
<strong>24</strong> April – 12 May 2012<br />
DO values were high at the surface and decreased at lower depth with a minimum at approximately<br />
750m (Figure 4).<br />
Figure 4. Vertical profiles of DO (from CTD) for all CTD stations<br />
pH profiles<br />
pH values at the surface were high and steadily decreased with depth at the photic layer, below<br />
which the pH remained uniform (Figure 5). The depth of the pH minima roughly coincided with<br />
depth of the DO minima at ~750m (Figure 4). Processes that consume carbonic acid (e.g.<br />
pho<strong>to</strong>synthesis in upper layers) increase pH, while processes that produce carbonic acid (e.g.<br />
respiration) decrease pH values.<br />
University of the Philippines, Marine Science Institute:<br />
Gil S. Jacin<strong>to</strong>, Maria Lourdes San Diego – McGlone, Maria Teresa L. Escobar,<br />
Maria Isabel S. Senal, Lara Patricia A. Sot<strong>to</strong>, Mary Chris L. Tentia<br />
Tokyo Institute of Technology:<br />
Atsushi Watanabe
Figure 5. Vertical profiles of pH (uncorrected) for all CTD stations<br />
CDOM profiles<br />
Shelf Pacific Interaction in <strong>Lamon</strong> <strong>Bay</strong>, Philippines (SPIL)<br />
Chemical Oceanography<br />
R/V Roger <strong>Revelle</strong><br />
<strong>24</strong> April – 12 May 2012<br />
Chromophoric DOM (CDOM) considered a bio-‐refrac<strong>to</strong>ry fraction of DOM, is low at the surface and<br />
increased with depth (Figure 6). This is a consequence of pho<strong>to</strong>degradation of CDOM at the surface<br />
and remineralization of biogenic sinking particles at lower depths.<br />
Figure 6. Vertical profiles of Chromophoric DOM (CDOM) (uncorrected) for all CTD stations<br />
University of the Philippines, Marine Science Institute:<br />
Gil S. Jacin<strong>to</strong>, Maria Lourdes San Diego – McGlone, Maria Teresa L. Escobar,<br />
Maria Isabel S. Senal, Lara Patricia A. Sot<strong>to</strong>, Mary Chris L. Tentia<br />
Tokyo Institute of Technology:<br />
Atsushi Watanabe
Correlations<br />
pH vs AOU<br />
Shelf Pacific Interaction in <strong>Lamon</strong> <strong>Bay</strong>, Philippines (SPIL)<br />
Chemical Oceanography<br />
R/V Roger <strong>Revelle</strong><br />
<strong>24</strong> April – 12 May 2012<br />
pH values correlated well with AOU (r=0.9934) (Figure 7), which suggests that similar processes<br />
(pho<strong>to</strong>synthesis, respiration) affect both parameters. The empirical relationship was determined <strong>to</strong><br />
be: pH = -‐0.00258 AOU + 8.122 (n= 746).<br />
Figure 7. Correlation of pH and AOU<br />
CDOM vs AOU<br />
For more offshore stations, CDOM correlated well with AOU (r=0.9353) (Figure 8). This suggests that<br />
production of CDOM can be coupled <strong>to</strong> the remineralization of biogenic sinking particles. The<br />
empirical relationship was determined <strong>to</strong> be: CDOM = 1.073 AOU + 1398 (n= 138).<br />
University of the Philippines, Marine Science Institute:<br />
Gil S. Jacin<strong>to</strong>, Maria Lourdes San Diego – McGlone, Maria Teresa L. Escobar,<br />
Maria Isabel S. Senal, Lara Patricia A. Sot<strong>to</strong>, Mary Chris L. Tentia<br />
Tokyo Institute of Technology:<br />
Atsushi Watanabe
Figure 8. Correlation of CDOM and AOU<br />
Shelf Pacific Interaction in <strong>Lamon</strong> <strong>Bay</strong>, Philippines (SPIL)<br />
Chemical Oceanography<br />
R/V Roger <strong>Revelle</strong><br />
<strong>24</strong> April – 12 May 2012<br />
For stations closer <strong>to</strong> the coast, CDOM can be associated with land derived organic matter from<br />
rivers and runoff. This was seen in the higher CDOM values in the 400m basin (Stn 35) and adjacent<br />
shelf area (Figure 9). When CDOM was correlated with AOU, an r value of 0.66846 was obtained.<br />
The relatively lower DO in the basin and the higher AOU suggests that the organic matter introduced<br />
in<strong>to</strong> the shelf and 400m basin uses up DO in the remineralization process. Water from this basin<br />
may then be the source of the local subsurface DO minimum observed in outlying areas.<br />
University of the Philippines, Marine Science Institute:<br />
Gil S. Jacin<strong>to</strong>, Maria Lourdes San Diego – McGlone, Maria Teresa L. Escobar,<br />
Maria Isabel S. Senal, Lara Patricia A. Sot<strong>to</strong>, Mary Chris L. Tentia<br />
Tokyo Institute of Technology:<br />
Atsushi Watanabe
Shelf Pacific Interaction in <strong>Lamon</strong> <strong>Bay</strong>, Philippines (SPIL)<br />
Chemical Oceanography<br />
R/V Roger <strong>Revelle</strong><br />
<strong>24</strong> April – 12 May 2012<br />
Figure 9. CDOM, DO, AOU trends in the deep basin (Stn 35) and adjacent shelf area<br />
Atmospheric xCO2 (mole fraction of CO2 in dry air) was 400.6 +-‐ 3.4 (N=4003) ppm during the <strong>cruise</strong>,<br />
which is about pCO2 = 384 µatm at SST 30 o C. Because the temperature differences were found<br />
between the ship’s underway data and water temperature in the container, measured xCO2 was<br />
corrected <strong>to</strong> the in-‐situ temperature using the relation presented by Takahashi et al. [1993]. The<br />
obtained pCO2 was close <strong>to</strong> equilibrium in the offshore side and high in the inner <strong>Lamon</strong> <strong>Bay</strong> region<br />
(Figure 10 (A)). Lower pCO2 was found especially along the 19 o N transect possibly related <strong>to</strong> low SST.<br />
Total alkalinity (TA) and dissolved inorganic carbon (DIC) obtained from surface 50m were compared<br />
with salinity in Figure 11. Tight linear relationships were obtained (TA = 58.81*SALINITY + 232.6, R 2 =<br />
0.982, DIC = 44.05*SALINITY + 402.6, R 2 = 0.964, N=109). Higher intercept of DIC compared with TA<br />
indicates organic matter remineralization in low salinity range, which possibly explains partially the<br />
higher pCO2 found in inner <strong>Lamon</strong>t <strong>Bay</strong> where salinity was low.<br />
University of the Philippines, Marine Science Institute:<br />
Gil S. Jacin<strong>to</strong>, Maria Lourdes San Diego – McGlone, Maria Teresa L. Escobar,<br />
Maria Isabel S. Senal, Lara Patricia A. Sot<strong>to</strong>, Mary Chris L. Tentia<br />
Tokyo Institute of Technology:<br />
Atsushi Watanabe
LB02 Shipboard CTD Data Acquisition and Processing<br />
SIO Shipboard Technical Support<br />
A <strong>to</strong>tal of 78 CTD/rosette casts were made on LB02, usually <strong>to</strong> 1500m or within 10m of the bot<strong>to</strong>m. Four casts<br />
were made <strong>to</strong> 4000m: 005/01, 015/01, 020/01 and 059/01. There were no major problems with any of the<br />
deployments.<br />
A Seabird Electronics SBE911 CTD system, SIO STS S/N 401, was used for all casts. This system had<br />
secondary temperature and conductivity, dissolved oxygen, fluorometer, transmissometer, altimeter and SPAR<br />
sensors in addition <strong>to</strong> the primary temperature, conductivity and pressure sensors. The primary temperature and<br />
conductivity sensors were used for all reported CTD measurements.<br />
CTD 401 Sensor Configuration<br />
Sensor Serial Number Calibration Date, Location<br />
SBE 9 Digiquartz Pressure 401 2011-12-02, SIO ODF<br />
SBE 3 Temperature (primary) 03-4941 2011-11-02, SBE<br />
SBE 4 Conductivity (primary) 04-1870 2011-11-29, SBE<br />
SBE 3 Temperature (secondary) 03-4943 2011-11-22, SBE<br />
SBE 4 Conductivity (secondary) 04-1919 2011-11-29, SBE<br />
SBE 43 Dissolved Oxygen 43-0255 2011-11-23, SBE<br />
Seatech Transmissometer CST-1189DR 2008-11-03, Seatech<br />
Seapoint Fluorometer SCF 3003<br />
Benthos Altimeter 41832<br />
Surface PAR QSR-2200 202227 2006-02-02, SBE<br />
The CTD was mounted horizontally in a rosette frame which also held <strong>24</strong> 2.5L Niskin bottles and a SBE32<br />
Carousel water sampler. The rosette was deployed from the <strong>Revelle</strong> starboard side squirt boom using the aft<br />
Desh-5 Markey winch with a 0.322” conducting sea cable.<br />
The CTD data were acquired using Seabird SeaSave-7.21d acquisition software running on a Windows PC. The<br />
acquisition direc<strong>to</strong>ry was shared on the network and watched by sioodf-5.1.6 software running on a Linux<br />
system. At the end of each deployment, the Linux system made a copy of the acquired CTD data, then<br />
processed it. The processed data were then made available for plotting, reporting and downloading from a<br />
shipboard website.<br />
CTD data processing consisted of applying calibrations, filtering for noise and artifacts and adjusting the phase<br />
and amplitude of sensors <strong>to</strong> match response times. A 0.5 second time series was made of the whole cast, then a<br />
2.0 db pressure series was made of the down cast.<br />
Problems encountered on two deployments (005/01 and 033/01) resulted in unrecoverable bad data for portions<br />
of the down casts. For these casts, the up cast pressure series data were reported. The rosette hit the bot<strong>to</strong>m on<br />
055/01, but the data and sensor calibrations were not affected. The sea cable was reterminated prior <strong>to</strong> 056/01.<br />
The temperature and conductivity sensor calibrations were moni<strong>to</strong>red by comparing primary and secondary<br />
sensors on each cast. The temperature sensors had a mean difference of 0.00303ºC for all pressures with a<br />
standard deviation of 0.00601ºC (N=1772). The conductivity sensors had a difference of 0.001025mS/cm for all<br />
pressures with a standard deviation of 0.005443mS/cm (N=1761). Since these differences were nearly constant<br />
on the timescale of this <strong>cruise</strong>, no corrections were made <strong>to</strong> either the temperature or conductivity calibrations.<br />
The dissolved oxygen sensor calibration was moni<strong>to</strong>red by examining calibrated O2 as a function of potential<br />
temperature for groups of adjacent casts. Although some dissolved oxygen samples were taken from the rosette<br />
bottles and analyzed during the <strong>cruise</strong>, both the number of samples taken and the generally shallow depth of<br />
the samples substantially reduced their utility for CTD sensor calibration. Since no other independent dissolved<br />
oxygen measurements were made, the accuracy of the CTD O2 measurements cannot be quantified.
LB02 Shipboard Instruments and Measurements<br />
SIO Shipboard Technical Support<br />
The R/V <strong>Revelle</strong> has a collection of permanently installed sensors and instruments. Data from these systems<br />
were collected on LB02.<br />
Meteorological and sea surface measurements were made with the Met system, which acquires the data from<br />
various shipboard sources and generates a continuous time series. These data include: wind speed and<br />
direction, solar radiation, dew point and relative humidity, precipitation, air temperature, barometric pressure, sea<br />
surface temperature, sea surface salinity, sea surface sound speed, dissolved oxygen, fluorometer (chlorophyll<br />
A), latitude, longitude, speed over ground, course over ground, heading and bot<strong>to</strong>m depth. The data are<br />
continuously displayed on a shipboard website.<br />
Two RDI ADCP systems, an OS75 and a NB150, were used by a system running the UHDS software from<br />
University of Hawaii <strong>to</strong> make continuous underway ADCP measurements. The OS75 system has a range of up<br />
<strong>to</strong> 800m, the NB150 up <strong>to</strong> 250m. The data are continuously displayed on a shipboard website.<br />
Two SIO-built hydrographic doppler sonar systems (HDSS) were used <strong>to</strong> collect data during LB02. These<br />
systems measure current shear <strong>to</strong> very high precision. The systems operate at 50kHz and 140kHz.<br />
WAMOS is an X-band RADAR based ocean wave height measurement system that calculates wave periods and<br />
deduces swell components. Data from this system were collected during LB02.<br />
The Bell Aero BGM-3 gravimeter measures earth's gravity <strong>to</strong> very high precision. A time series of the gravity data<br />
was collected during LB02.<br />
Three echosounder systems are installed on <strong>Revelle</strong> and were used during LB02. The Kongsberg EM122<br />
multibeam echosounder is a 12kHz multibeam system and generates swath maps of bathymetry. It was run<br />
continuously and additionally used for depth estimates during CTD deployments. Sound speed profiles used <strong>to</strong><br />
calibrate the echosounder were derived from CTD profiles. The 3.5kHz and 12kHz Knudsen single beam<br />
echosounders were used intermittently <strong>to</strong> obtain bot<strong>to</strong>m estimates. The 3.5kHz echosounder is a sub-bot<strong>to</strong>m<br />
profiler and was frequently used during gravity cores. The 12kHz echosounder was used during mooring<br />
recoveries <strong>to</strong> detect and range the moorings.<br />
Navigation instruments on <strong>Revelle</strong> include Furuno GP150, Ashtech ADU3, Leica MX420 and Trimble SPS461<br />
GPSes, and Ixsea Hydrins and Phins inertial guidance and motion reference units. Data from these instruments<br />
were collected on LB02.
<strong>Lamon</strong> <strong>Bay</strong> <strong>cruise</strong> 2 [LB02] CTD/rosette Phil Mele<br />
78 profiles of temperature, salinity and dissolved oxygen were obtained using equipment provided by<br />
ODF/SIO. The basic package consisted of a SeaBird Electronics SBE911+ CTD system fitted with<br />
two sets of ducted conductivity and temperature sensors, dual pumps, and a single SBE43 dissolved<br />
oxygen sensor. The sensor suite was mounted vertically. One second GP90 GPS data was merged<br />
with the CTD data stream and recorded at every CTD scan. Data were acquired using a Windows PC<br />
and SeaBird Seasave software. Data was processed by a suite of ODF programs. The CTD package<br />
remained on deck during the <strong>cruise</strong>.<br />
Most profiles were <strong>to</strong> 1500 m or <strong>to</strong> within 10 m of the bot<strong>to</strong>m. Four stations were <strong>to</strong> 4000 m.<br />
Approach <strong>to</strong> the bot<strong>to</strong>m was guided by a Benthos altimeter mounted on the frame.<br />
Water samples were collected using a <strong>24</strong>-position carousel fitted with <strong>24</strong> 10 liter water sample bottles.<br />
Water samples were collected for on board analysis of disolved oxygen for standardizing the CTD data,<br />
determined by modified Winkler method for a spectropho<strong>to</strong>meter.
CTD Summary Table:<br />
sta lat (N) lon (E) yyyy/mm/dd hh:mm<br />
1 14 15.54 1<strong>24</strong> 14.35 2012/04/25 00:39<br />
2 14 30.02 1<strong>24</strong> 14.93 2012/04/25 04:01<br />
3 14 45.17 1<strong>24</strong> 15.03 2012/04/25 06:33<br />
4 14 59.99 1<strong>24</strong> 15.07 2012/04/25 09:11<br />
5 15 15.00 1<strong>24</strong> 15.01 2012/04/25 11:51<br />
6 15 29.97 1<strong>24</strong> 15.01 2012/04/25 16:40<br />
7 15 44.97 1<strong>24</strong> 12.67 2012/04/25 19:25<br />
8 15 59.99 1<strong>24</strong> 15.07 2012/04/25 23:51<br />
9 16 14.92 1<strong>24</strong> 15.08 2012/04/26 02:34<br />
10 16 29.93 1<strong>24</strong> 15.07 2012/04/26 05:15<br />
11 16 29.99 1<strong>24</strong> 0.10 2012/04/26 08:23<br />
12 16 29.90 123 44.81 2012/04/26 11:09<br />
13 16 30.08 123 29.89 2012/04/26 14:10<br />
14 16 30.02 123 15.01 2012/04/26 17:09<br />
15 16 30.05 123 0.51 2012/04/26 20:00<br />
16 16 30.01 122 45.02 2012/04/27 00:35<br />
17 16 29.95 122 30.00 2012/04/27 03:11<br />
18 16 15.05 123 14.96 2012/04/27 10:15<br />
19 16 0.02 123 14.99 2012/04/27 13:02<br />
20 15 45.12 123 15.01 2012/04/27 16:09<br />
21 15 30.04 123 14.99 2012/04/27 21:36<br />
22 15 9.70 123 17.40 2012/04/28 00:51<br />
23 14 45.52 122 58.31 2012/04/28 07:33<br />
<strong>24</strong> 14 57.05 123 43.34 2012/04/28 12:45<br />
25 15 44.77 123 58.37 2012/04/28 17:28<br />
26 16 0.03 123 0.02 2012/04/29 05:43<br />
27 15 44.97 122 45.03 2012/04/29 09:21<br />
28 15 29.98 122 30.06 2012/04/29 12:42<br />
29 15 15.22 122 14.83 2012/04/29 16:50<br />
30 15 7.18 122 0.02 2012/04/29 20:19<br />
31 15 21.37 122 1.43 2012/04/29 22:39<br />
32 15 38.<strong>24</strong> 121 58.68 2012/04/30 03:42<br />
33 15 49.09 121 44.47 2012/04/30 06:27<br />
34 15 11.87 121 45.33 2012/05/01 00:11<br />
35 14 23.60 121 44.51 2012/05/01 10:12<br />
36 14 32.06 121 48.34 2012/05/01 13:22<br />
37 14 45.31 121 48.29 2012/05/01 15:17<br />
38 14 58.90 121 43.12 2012/05/01 17:21<br />
39 15 10.33 122 30.11 2012/05/02 13:32<br />
40 15 0.07 122 29.94 2012/05/02 16:06<br />
41 14 53.<strong>24</strong> 122 29.96 2012/05/02 18:39<br />
42 16 45.02 1<strong>24</strong> 14.99 2012/05/04 19:14
sta lat (N) lon (E) yyyy/mm/dd hh:mm<br />
43 16 59.97 1<strong>24</strong> 15.01 2012/05/05 00:39<br />
44 17 14.95 1<strong>24</strong> 15.02 2012/05/05 03:19<br />
45 17 29.98 1<strong>24</strong> 15.02 2012/05/05 06:26<br />
46 17 45.03 1<strong>24</strong> 15.04 2012/05/05 08:59<br />
47 18 0.02 1<strong>24</strong> 15.04 2012/05/05 11:39<br />
48 18 14.98 1<strong>24</strong> 15.00 2012/05/05 14:48<br />
49 18 20.97 123 59.96 2012/05/05 18:07<br />
50 18 21.01 123 45.01 2012/05/05 20:45<br />
51 18 20.95 123 30.09 2012/05/05 23:02<br />
52 18 21.01 123 14.95 2012/05/06 01:28<br />
53 18 21.00 123 0.04 2012/05/06 03:59<br />
54 18 21.05 122 45.02 2012/05/06 06:27<br />
55 18 21.01 122 29.99 2012/05/06 08:59<br />
56 17 7.15 122 34.01 2012/05/07 00:34<br />
57 17 7.22 122 44.92 2012/05/07 02:12<br />
58 17 7.21 122 59.98 2012/05/07 04:46<br />
59 17 7.22 123 15.07 2012/05/07 07:39<br />
60 17 7.28 123 30.02 2012/05/07 11:39<br />
61 17 7.18 123 45.01 2012/05/07 14:33<br />
62 17 7.15 1<strong>24</strong> 0.02 2012/05/07 17:<strong>24</strong><br />
63 17 7.22 1<strong>24</strong> 14.99 2012/05/07 20:13<br />
64 17 7.23 1<strong>24</strong> 59.99 2012/05/08 01:05<br />
65 17 7.17 126 0.01 2012/05/08 07:07<br />
66 19 0.05 125 59.99 2012/05/08 17:01<br />
67 18 59.98 125 30.08 2012/05/08 20:54<br />
68 18 59.99 125 0.02 2012/05/09 00:43<br />
69 18 59.98 1<strong>24</strong> 30.08 2012/05/09 04:41<br />
70 19 0.02 1<strong>24</strong> 0.07 2012/05/09 08:31<br />
71 19 0.03 123 29.99 2012/05/09 12:16<br />
72 19 0.01 123 0.07 2012/05/09 16:16<br />
73 18 59.95 122 45.04 2012/05/09 18:52<br />
74 19 0.01 122 29.98 2012/05/09 21:26<br />
75 18 59.99 122 14.85 2012/05/09 23:51<br />
76 18 54.02 122 0.05 2012/05/10 02:29<br />
77 18 35.32 122 0.01 2012/05/10 06:14<br />
78 18 46.90 121 51.97 2012/05/10 10:10
Scripps Institution of Oceanography Research Marine Technician Group<br />
RR<strong>1204</strong> Deck Operations<br />
Multiple operations were conducted on board R/V Roger <strong>Revelle</strong> by the Research Marine<br />
Technicians (Restechs) for the recovery of scientific data. The majority of deck operations were<br />
CTD casts. Additional operations included vertical and oblique bongo net <strong>to</strong>ws, OSU style<br />
gravity cores, traditional subsurface mooring recoveries, TRBM recoveries, dragging, and<br />
dredging. The bongo net was provided by the University of the Philippines. The moorings and<br />
TRBMs were owned by University of Hawaii and <strong>Lamon</strong>t Doherty Earth Observa<strong>to</strong>ry. All other<br />
equipment was provided by the SIO Restechs.<br />
CTD and <strong>24</strong> Place Bottle Rosette<br />
The CTD and sensors were attached <strong>to</strong> a <strong>24</strong> place bottle rosette frame. A mount was developed<br />
for mounting the par sensor safely above the bottle <strong>to</strong>ps and inside of the outer ring. Throughout<br />
the <strong>cruise</strong> various o-rings on the bottles were replaced as they broke. Two bottle spouts were<br />
also replaced after they broke early in the <strong>cruise</strong>. Bottle #5 had its lanyard slightly shortened<br />
after it likely stretched during use, which led <strong>to</strong> a single misfire. The par sensor was removed for<br />
all casts over 2000m depth and reinstalled after cast completion.<br />
Bongo Net<br />
The bongo net was not sufficiently weighted for both vertical and oblique <strong>to</strong>ws. A lanyard was<br />
made for their depressor weight and dive weights were added <strong>to</strong> help add some more necessary<br />
weight. For the vertical <strong>to</strong>ws a 50lb weight was added <strong>to</strong> the center of the bongo net frame that<br />
is needed <strong>to</strong> keep it vertical. This bongo net frame is not engineered <strong>to</strong> be strong enough <strong>to</strong> add<br />
the necessary weight needed <strong>to</strong> properly operate vertical and oblique <strong>to</strong>ws. The largest amount<br />
of weight was added <strong>to</strong> the frame that would not cause structural damage. It would be best for<br />
this bongo frame <strong>to</strong> be redesigned <strong>to</strong> hold a 100-150lbs weight in the center of the frame and the<br />
depressor weight should be around 75-100lbs. The net was deployed <strong>to</strong> 200m at a speed of<br />
30m/min.<br />
OSU Style Gravity Corer<br />
The OSU style gravity corer is the preferred type of gravity corer used by the restechs. It can be<br />
adapted <strong>to</strong> various environments easily with its adjustable weights and use of a schedule 40 PVC<br />
pipe. The machined corer parts are attached <strong>to</strong> a 10ft long PVC pipe for each deployment. The<br />
PVC pipe acts as the liner, which can quickly and easily be removed once the instrument is<br />
recovered. The gravity corer was deployed on the 9/16” mechanical wire at a max speed of<br />
55m/min with a ground penetrating speed averaging 15-20m/min. The core is recovered with a<br />
5-10m/min pull out from the seafloor. Once the corer is safely in the water column the wire may<br />
come in between 40m/min and 55 m/min.<br />
Traditional Subsurface Mooring Recoveries<br />
Three subsurface moorings were recovered with the restech directing operations. The moorings<br />
were hooked in<strong>to</strong> as they came along the side of the ship with a line leading through the A-frame
<strong>to</strong> the TSE winch. The TSE winch hauled in the mooring line as instruments were safely<br />
removed. One very short mooring was recovered by hand in the ship’s small workboat.<br />
TRBM Recovery<br />
Once the TRBM surfaced, the ship’s small workboat went over <strong>to</strong> it <strong>to</strong> hook a line in<strong>to</strong> it. There<br />
is no way <strong>to</strong> hook in<strong>to</strong> the TRBM from the ship like a normal mooring. The small boat then<br />
slowly dragged the TRBM float <strong>to</strong> the stern of the ship. A line hooked <strong>to</strong> the lifting point of the<br />
TRBM float was <strong>to</strong>ssed <strong>to</strong> the restech on the stern and attached <strong>to</strong> a lifting line on the capstan.<br />
Once the float was secured on deck with s<strong>to</strong>pper lines, a yale grip was attached <strong>to</strong> the 400m<br />
spectra line connecting the float <strong>to</strong> the anchor. The float was then disconnected from the spectra<br />
line. The yale grip was attached <strong>to</strong> the TSE winch <strong>to</strong> haul the 400m of spectra and anchor in.<br />
The tagging points on the anchor are not large enough even for our small hooks <strong>to</strong> be able <strong>to</strong><br />
hook a tagline on. In a few locations tangling and knotting of the spectra line was observed.<br />
These all appeared <strong>to</strong> be caused by the coiling jobs held <strong>to</strong>gether by rubber bands. Recovery of<br />
the TRBM was smooth, but must be done with the assistance of a small boat.<br />
Dragging and Dredging<br />
The Roger <strong>Revelle</strong> and the Scripps Institution of Oceanography Research Marine Technician<br />
Group do not regularly carry dragging equipment onboard. Usually dragging has been<br />
predetermined as an event that will occur on a <strong>cruise</strong> during a pre-<strong>cruise</strong> meeting. However,<br />
there is always a chance that dragging will be requested in the midst of a <strong>cruise</strong> when there are<br />
no other options available. In these circumstances the restech on board utilizes any equipment<br />
that is available or can be quickly created onboard that can apply <strong>to</strong> a general concept of<br />
dragging.<br />
Dragging is typically a last resort technique for the recovery of oceanographic instruments. It is<br />
performed by laying a wire with a hooking device and weight attached on<strong>to</strong> the seafloor, which<br />
is then pulled along bot<strong>to</strong>m by winch and ship in a specified pattern. Dragging is similar <strong>to</strong> rock<br />
dredging in that they share the same winching techniques and wire is being placed on the<br />
seafloor. There are various methods and techniques that range from being specific <strong>to</strong> the<br />
instrument <strong>to</strong> general use. The success rate for dragging varies from technician <strong>to</strong> technician,<br />
institution <strong>to</strong> institution as well as instrument <strong>to</strong> instrument. For the most part though it is<br />
believed that the success rate for dragging is less than 50% (no official data has ever been<br />
collected).<br />
Dredging is a technique used <strong>to</strong> recover rocks from the seafloor. An SIO style dredge has a<br />
<strong>to</strong>othed mouth opening of about 3ftx1.5ft with a 5ft chain basket. It weighs about 800lbs and has<br />
a 50lb weight added <strong>to</strong> the basket just prior <strong>to</strong> deployment. Dredging is performed by setting<br />
wire down in a straight line over a set distance on the seafloor in an upslope direction. At the<br />
end of the line the ship stays stationary while the winch wire is hauled in. The restech pays very<br />
careful attention <strong>to</strong> the tension and constantly adjusts the wire speed <strong>to</strong> maintain the dredge on<br />
the seafloor with the best tension <strong>to</strong> gather rocks.<br />
During this <strong>cruise</strong> the restechs used an I-beam with and without hooks for dragging and a dredge<br />
<strong>to</strong> try <strong>to</strong> recover two TRBMs. Overall a <strong>to</strong>tal of seven drag attempts and 2 dredges were<br />
completed. None of these attempts brought the TRBM floats <strong>to</strong> the surface. All drags and
dredges were performed in straight paths do <strong>to</strong> the design of the TRBMs. Do <strong>to</strong> strong currents<br />
at one sight the dredges were pulled downslope.
Scripps Institution of Oceanography Research Marine Technician Group<br />
Dragging for TRBMs<br />
Cruise RR<strong>1204</strong><br />
May 1, 2012 <strong>to</strong> May 4, 2012<br />
Pounding, dragging, and dredging exercises were conducted for two Flotation Technologies<br />
TRBMs at locations 15° 9.486’N 121° 45.432’E and 14° 57.102’N 123° 43.398’E that failed <strong>to</strong><br />
surface after the dual acoustic releases confirmed release. Both of the releases were owned by<br />
Dr. Pierre Flament of the University of Hawaii. The water depth measured via the ships<br />
multibeam and echosounders at these two locations were 148m and 191m respectively.<br />
The R/V Roger <strong>Revelle</strong> carries an assortment of rigging and dragging gear aboard for unplanned<br />
retrieval attempts of lost moorings. The ship also has the ability <strong>to</strong> weld, adapt, and create items<br />
with the resources currently on board at a given time. The equipment available during RR<strong>1204</strong><br />
were 3 large weighted dragging hooks, 100lb clump weight, Benthos Acoustic Pinger Model<br />
2216, weak links, and an SIO style dredge. Using various resources on board a 19ft I-Beam<br />
dragger was developed. The ship also has two winches full of 3x19 mechanical wire in ¼” and<br />
9/16” diameters. The advantage of performing dragging exercises off of <strong>Revelle</strong> is the dynamic<br />
positioning system that allows the ship <strong>to</strong> precisely maneuver around an instrument on the<br />
seafloor.<br />
TRBM 15° 9.486’N 121° 45.432’E<br />
At the direction of Dr. Flament, the first tactic used involved attaching a 100lb weight <strong>to</strong> the ¼”<br />
hydro wire with the pinger placed 10m above. The weight was then pounded in<strong>to</strong> the seafloor<br />
every 10 <strong>to</strong> 20m and dragged around the TRBM in a 40m square trying <strong>to</strong> jolt the float in<strong>to</strong><br />
surfacing. Throughout this process the science party was constantly tracking the TRBM using<br />
their acoustic transducer with the acoustic releases attached <strong>to</strong> the TRBM. The research<br />
technicians were tracking our pinger and wire via the 12kHz hull transducer, the MET winch<br />
display, LCI-90s, and ship’s navigation system. Do <strong>to</strong> the restrictions of daylight, proximity <strong>to</strong><br />
shore, and the shallow waters we were in we left the first Flament TRBM station <strong>to</strong> return before<br />
first light <strong>to</strong> start beam dragging operations. The TRBM float was still on the seafloor upon<br />
departure.<br />
Do <strong>to</strong> the design of the TRBM traditional dragging methods did not seem like the best way <strong>to</strong><br />
approach ways <strong>to</strong> recover the TRBM. It was unders<strong>to</strong>od by all that our chances were low for<br />
retrieving the instrument by dragging and we did not want <strong>to</strong> turtle the TRBM either. A spare<br />
20ft long I-beam was adapted in<strong>to</strong> a dragging bar by drilling holes at either end. A two-part wire<br />
bridle was attached <strong>to</strong> the beam, which was then attached <strong>to</strong> the 9/16” trawl wire. The beam drag<br />
was lowered <strong>to</strong> the seafloor and wire laid out in straight line passes over the instrument position<br />
using our DP system. The goal of this method was <strong>to</strong> hopefully just bump the instrument<br />
causing the foam block <strong>to</strong> dislodge and surface. After each pass the wire was hauled in being<br />
carefully moni<strong>to</strong>red by the research technician for tension spikes. Again the scientists continued<br />
<strong>to</strong> moni<strong>to</strong>r the instrument acoustically. On the third pass tension increased significantly leading
the tech <strong>to</strong> presume that they had bumped the TRBM as intended. The acoustic signal changed<br />
causing us <strong>to</strong> put the ship’s workboat in the water. The workboat acoustically moni<strong>to</strong>red the<br />
instrument and found the exact position where the instrument was floating 30m below the<br />
surface. A large grapple was added <strong>to</strong> each end of the beam before deploying it <strong>to</strong> try <strong>to</strong> snag<br />
the TRBM line between the float and the anchor. Two passes were made one midwater and<br />
another was made at depth. There were no indications via tension that we had made contact with<br />
the TRBM.<br />
A <strong>to</strong>tal of 5 dragging attempts were made on this TRBM without success. It is believed that the<br />
instrument is securely floating at 30 <strong>to</strong> 40m below the surface still attached <strong>to</strong> the anchor as<br />
designed with its line knotted. Thus causing its inability <strong>to</strong> rise fully <strong>to</strong> the surface.<br />
TRBM 14° 57.102’N 123° 43.398’E<br />
Similarly <strong>to</strong> the previous TRBM, after both acoustic releases indicated release the TRBM did not<br />
start <strong>to</strong> rise <strong>to</strong> the surface. Unlike the previous station this instrument was not on a<br />
<strong>to</strong>pographically flat seafloor. There was a 1/3 slope with a 1.6 knot current. A few other<br />
<strong>to</strong>pographic mounds were nearby as well. These all made it difficult for our preferred dragging<br />
approaches on this TRBM.<br />
Two dragging and two dredging attempts were made. Do <strong>to</strong> the current going up slope we had <strong>to</strong><br />
conduct these drags going down slope and in<strong>to</strong> the current for the ship <strong>to</strong> have the best<br />
maneuverability. The first drag was done with just the beam. The second drag was done with<br />
the beam and three dragging hooks. Several tension nibbles were observed, but no large tension<br />
spikes on both drags. Upon recovery of the beam with hooks, two hooks showed evidence of<br />
being hung up on something. These hooks were bent back and had busted welds indicating a<br />
hard substrate.<br />
The dredging attempts were very similar <strong>to</strong> the beam dragging efforts. The SIO style rock<br />
dredge was attached <strong>to</strong> the 9/16” trawl wire and set on the seafloor with the wire paid out over<br />
the seafloor in straight passes before being hauled in. Both dredging pulls had small nipples as it<br />
dug along the surface of the seafloor. On both attempts it recovered coral rock. The first dredge<br />
also got a biological bonus of a small skinny snake like fish that will be identified by the science<br />
party on shore. The second dredge pulled up a small amount of 100lb test monofilament that<br />
was poorly knotted and showed evidence of use as a hand line.<br />
After all of theses attempts the acoustic signal from the TRBM still indicated a released<br />
instrument stuck on the seafloor. The slope and the presence of fishing gear could be the cause<br />
of the instrument not surfacing.