Kiribati - SPREP
Kiribati - SPREP
Kiribati - SPREP

You also want an ePaper? Increase the reach of your titles
YUMPU automatically turns print PDFs into web optimized ePapers that Google loves.
Pacific Islands Renewable<br />
<strong>SPREP</strong> Energy Project<br />
U N<br />
D P<br />
PIREP<br />
our islands, our lives…<br />
A climate change partnership of GEF, UNDP, <strong>SPREP</strong> and the Pacific Islands<br />
The Secretariat of the Pacific Regional Environment Programme<br />
Pacific Regional<br />
Energy Assessment<br />
2004<br />
An Assessment of the Key Energy Issues,<br />
Barriers to the Development of Renewable Energy<br />
to Mitigate Climate Change, and Capacity<br />
Development Needs for Removing the Barriers<br />
KIRIBATI<br />
National Report<br />
Volume 5
<strong>SPREP</strong> IRC Cataloguing-in-Publication Data<br />
Wade, Herbert<br />
Pacific Regional Energy Assessment 2004 :<br />
an assessment of the key energy issues, barriers<br />
to the development of renewable energy to<br />
mitigate climate change, and capacity development<br />
needs to removing the barriers : <strong>Kiribati</strong> National<br />
Report / Herbert Wade; Peter Johnston. – Apia,<br />
Samoa : <strong>SPREP</strong>, 2005.<br />
xvi, 60 p. : figs., tables ; 29 cm. – (Pacific Islands<br />
Renewable Energy Project. Technical report ; no.05)<br />
“This report is based on data gathered by a<br />
PIREP team consisting of Mautaake Tannang,<br />
Herbert Wade and Peter Johnston”<br />
ISBN: 982-04-0289-1<br />
1. Energy development – <strong>Kiribati</strong>. 2. Energy sources, Renewable<br />
- <strong>Kiribati</strong>. 3. Energy research –<strong>Kiribati</strong>. 4. Conservation of<br />
energy resources – <strong>Kiribati</strong>. 5. Conservation of natural resources<br />
– <strong>Kiribati</strong>. 6. Energy consumption – Climate factors – <strong>Kiribati</strong>.<br />
I. Peter Johnston. II. Tannang, Mautaake. III. Pacific Islands<br />
Renewable Energy Project (PIREP). IV. Secretariat of the Pacific<br />
Regional Environment Programme (<strong>SPREP</strong>). V. Title.<br />
VI. Series.<br />
333.794159681
Currency Equivalent: One Australian Dollar ≈ 0.79 US Dollars February<br />
2004<br />
Fiscal Year: January to December<br />
Time Zone: GMT/UTC +12 (Gilberts), -11 (Phoenix), -10 (Line)<br />
This report is based on data gathered by a PIREP team consisting of:<br />
Mautaake Tannang, (National PIREP Coordinator),<br />
Herbert Wade (International Consultant/Team Leader)<br />
and<br />
Peter Johnston, (International Consultant)<br />
The international consultants visited <strong>Kiribati</strong> 9-14 February and 21-24 February, 2004<br />
An earlier draft of this report was reviewed by the <strong>Kiribati</strong> Government, Secretariat of<br />
the Pacific Regional Environment Programme (<strong>SPREP</strong>), the United Nations<br />
Development Programme (UNDP) and others, however, the contents are the<br />
responsibility of the undersigned and do not necessarily represent the views of the<br />
Government of <strong>Kiribati</strong>, <strong>SPREP</strong>, UNDP, the Global Environment Facility or the<br />
individuals who kindly provided the information on which this assessment is based.<br />
Herbert Wade<br />
Peter Johnston<br />
October 2004<br />
i
ACRONYMS<br />
AAGR Average Annual Growth Rate<br />
AC Alternating Current<br />
ACP African, Caribbean, Pacific countries<br />
ADB Asian Development Bank<br />
ANZ Australia New Zealand Banking Corporation<br />
BoK Bank of <strong>Kiribati</strong><br />
CCA Common Country Assessment (of the UN)<br />
CIA Central Intelligence Agency (USA)<br />
CEMA Commodities Export Monitoring Authority<br />
CROP Council of Regional Organisations of the Pacific<br />
DBK Development Bank of <strong>Kiribati</strong><br />
DANIDA Denmark International Development Agency<br />
DC Direct Current<br />
DSM Demand Side Management for efficient electricity use<br />
EC European Community<br />
EIA Environmental Impact Assessment<br />
EEZ Extended Economic Zone<br />
ENSO El Niño/El Niña oceanic climate cycle<br />
EPU Energy Planning Unit (GoK)<br />
ESCAP Economic and Social Commission for Asia and the Pacific (UN)<br />
EU European Union<br />
EWG Energy Working Group of CROP<br />
FSPK Foundation for the Peoples of the South Pacific, <strong>Kiribati</strong><br />
GDP Gross Domestic Product<br />
GEF Global Environment Facility<br />
GHG Greenhouse Gas<br />
GMT/UTC Greenwich Mean Time/Universal Time Coordinate<br />
GNP Gross National Product<br />
GoK Government of <strong>Kiribati</strong><br />
HF High Frequency<br />
Hp Horsepower<br />
IIEJ Institute of Energy Economics, Japan<br />
IMF International Monetary Fund<br />
JICA Japan International Cooperation Agency<br />
KCMC <strong>Kiribati</strong> Copra Marketing Company<br />
KOIL <strong>Kiribati</strong> Oil Company<br />
kV Kilo-Volts (thousands of volts)<br />
kVA Kilo-Volt-Amperes (Thousands of Volt Amperes of power)<br />
kW Kilo-Watt (Thousands of Watts of power)<br />
kWh Kilo-Watt-Hour (Thousands of Watt Hours of energy)<br />
kWp Kilo-Watts peak power (at standard conditions) from PV panels<br />
LPG Liquefied Petroleum Gas<br />
MCI&T Ministry of Commerce, Industry and Tourism<br />
MDG Millennium Development Goals<br />
MELAD Ministry of Environment, Lands and Agriculture<br />
MW&U Ministry of Works and Utilities<br />
MWE Ministry of Works and Energy (now the MPW&U)<br />
MW Millions of Watts (Megawatts)<br />
MWr Megawatts of wind capacity at the wind speed used for rating<br />
NDS National Development Strategy<br />
NOAA National Oceanographic and Atmospheric Administration (USA)<br />
OTEC Ocean Thermal Energy Conversion<br />
PIC Pacific Island Country<br />
PACER Pacific Agreement on Closer Economic Relations<br />
PEDP Pacific Energy Development Programme (UN 1982-1993)<br />
PICCAP Pacific Islands Climate Change Assistance Programme (GEF/UNDP)<br />
PICTA Pacific Island Countries Trade Agreement<br />
PIEPSAP Pacific Islands Energy Policies and Strategic Action Planning<br />
ii
PIFS Pacific Islands Forum Secretariat<br />
PIREP Pacific Island Renewable Energy Project (GEF/UNDP)<br />
PPA Pacific Power Association<br />
PREA Pacific Regional Energy Assessment (1992)<br />
PREFACE Pacific Rural/Renewable Energy France-Australia Common Endeavour<br />
PUB Public Utilities Board<br />
PV Photovoltaic<br />
REC Rural Electrification Company (proposed to replace the SEC)<br />
RERF Revenue Equalisation Reserve Fund<br />
SEC Solar Energy Company<br />
SHS Solar Home System<br />
SOPAC South Pacific Applied Geoscience Commission<br />
SPC Secretariat of the Pacific Communities<br />
<strong>SPREP</strong> Secretariat of the Pacific Regional Environment Programme<br />
SWH Solar Water Heater<br />
SWOT Strengths, Weaknesses, Opportunities and Threats<br />
toe tonnes of oil equivalent<br />
TSKL Telecom Services of <strong>Kiribati</strong> Limited<br />
UNDP United Nations Development Programme<br />
UNEP United Nations Environment Programme<br />
UNESCO United Nations Educational, Scientific and Cultural Organization<br />
USP University of the South Pacific<br />
V Volts<br />
WB World Bank<br />
Wh Watt hours of energy<br />
iii
Energy Conversions, CO2 Emissions and Measurements<br />
The following conventions are used in all volumes of the PIREP country reports<br />
unless otherwise noted.<br />
Fuel Unit<br />
Typical<br />
Density<br />
kg / litre<br />
Typical<br />
Density<br />
l / tonne<br />
Gross<br />
Energy<br />
MJ / kg<br />
Gross<br />
Energy<br />
MJ / litre<br />
Kg CO2 equivalent e<br />
Oil Equiv.:<br />
toe / unit<br />
(net) per GJ per litre<br />
Biomass Fuels:<br />
Fuelwood (5% mcwb) tonne 18.0 0.42 94.0<br />
Coconut residues (air dry) a<br />
Shell (15% mcwb) harvested tonne 14.6 0.34<br />
Husk (30% mcwb harvested tonne 12.0 0.28<br />
Average (air dry) b tonne 14.0 0.33<br />
Coconut palm (air dry) tonne 11.5 0.27<br />
Charcoal tonne 30.0 0.70<br />
Bagasse tonne 9.6 96.8<br />
Vegetable & Mineral Fuels:<br />
Crude oil tonne 42.6 1.00<br />
Coconut oil tonne 0.920 1,100 38.4 0.90<br />
LPG tonne 0.510 1,960 49.6 25.5 1.17 59.4 1.6<br />
Ethanol tonne 27.0 0.63<br />
Gasoline (super) tonne 0.730 1,370 46.5 34.0 1.09 73.9 2.5<br />
Gasoline (unleaded) tonne 0.735 1,360 46.5 34.2 1.09 73.9 2.5<br />
Aviation gasoline (Avgas) tonne 0.695 1,440 47.5 33.0 1.12 69.5 2.3<br />
Lighting Kerosene tonne 0.790 1,270 46.4 36.6 1.09 77.4 2.8<br />
Aviation turbine fuel (jet fuel) tonne 0.795 1,260 46.4 36.9 1.09 70.4 2.6<br />
Automotive diesel (ADO) tonne 0.840 1,190 46.0 38.6 1.08 70.4 2.7<br />
High sulphur fuel oil (IFO) tonne 0.980 1,020 42.9 42.0 1.01 81.5 3.4<br />
Low sulphur fuel oil (IFO) tonne 0.900 1,110 44.5 40.1 1.04 81.5 3.4<br />
Diesel Conversion Efficiency:<br />
Actual efficiencies are used where known. Otherwise:<br />
Average efficiency for small diesel engine (< 100kW output)<br />
Average efficiency of large modern diesel engine(> 1000 kW<br />
litres / kWh:<br />
0.46<br />
0.284<br />
Efficiency:<br />
22%<br />
36%<br />
output)<br />
Average efficiency of low speed, base load diesel (Pacific region) 0.30 - 0.33 28% - 32%<br />
Area: 1.0 km 2 = 100 hectares = 0.386 mile 2 1.0 acre = 0.41 hectares<br />
Volume 1 US gallon = 0.833 Imperial (UK) gallons = 3.785 litres 1.0 Imperial gallon = 4.546 litres<br />
Mass: 1.0 long tons = 1.016 tonnes<br />
Energy: 1 kWh = 3.6 MJ = 860 kcal = 3,412 Btu = 0.86 kgoe (kg of oil equivalent)<br />
1 toe = 11.83 MWh = 42.6 GJ = 10 million kcal = 39.68 million Btu<br />
1 MJ = 238.8 kcal = 947.8 Btu = 0.024 kgoe = 0.28 kWh<br />
GHGs 1 Gg (one gigagramme) = 1000 million grammes (10 9 grammes) = one million kg = 1,000 tonnes<br />
CO2 equiv CH4 has 21 times the GHG warming potential of the same amount of CO2; N2O 310 times<br />
Notes: a) Average yield of 2.93 air dry tonnes residues per tonne of copra produced (Average NCV 14.0 MJ/kg)<br />
b) Proportion: kernel 33%, shell 23%, husk 44% (by dry weight).<br />
c) Assumes conversion efficiency of 30% (i.e., equivalent of diesel at 30%).<br />
d) Assumes conversion efficiency of 9% (biomass - fuelled boiler).<br />
e) Point source emissions<br />
Sources:<br />
1) Petroleum values from Australian Institute of Petroleum (undated) except bagasse from AGO below<br />
2) CO2 emissions from AGO Factors and Methods Workbook version 3 (Australian Greenhouse Office; March 2003)<br />
3) Diesel conversion efficiencies are mission estimates.<br />
` 4) CO2 greenhouse equivalent for CH4 and N2O from CO2 Calculator (Natural Resources Canada,<br />
iv
EXECUTIVE SUMMARY<br />
1. Country Context<br />
Physical Description. <strong>Kiribati</strong> includes one raised coral island (Banaba) and 32 atolls<br />
in three island groups (Gilbert, Line and Phoenix) that are spread over an ocean area<br />
4,200 km east to west and 2,000 km north to south including a total land area of 811<br />
km 2 . Both the Equator and the 180 th meridian pass through <strong>Kiribati</strong>. The capital is on<br />
Tarawa in the Gilbert group. <strong>Kiribati</strong> exemplifies the development challenges facing a<br />
small, remote and resource-poor island state during a period of rapid global change.<br />
Social. The 2000 census counted 84,494 residents representing an annual growth rate<br />
of 1.7%. The urban area of Tarawa grew at an annual rate of 5.2% while rural<br />
population fell at 0.6% per year over the past decade. In 2000, the 36,717 person<br />
Tarawa population represented 43% of the total population of <strong>Kiribati</strong>. The dense and<br />
growing population of the urban areas represents a major problem for service delivery<br />
and environmental protection. To relieve that pressure, the Government of <strong>Kiribati</strong><br />
(GoK) has encouraged migration to Kiritimati for over 20 years. Emigration to the<br />
other Line Islands has also been encouraged though incentives have been dropped<br />
now that their population appears optimum. Now relocation to the Phoenix Islands is<br />
being encouraged. The rapid growth of the urban population on both Tarawa and<br />
Kiritimati also represents very rapid growth in the energy sector on those two islands.<br />
For the rest of <strong>Kiribati</strong>, the population is expected to remain fairly stable or even to<br />
decline. Any increase in outer island energy demand is expected to be more related to<br />
increased income than increased population.<br />
Free education is provided from pre-school through to form six. Post secondary<br />
learning is available at the USP centre on Tarawa and vocational training is available<br />
in several technical areas at the Tarawa Technical Institute (TTI). The well respected<br />
Marine Training Centre provides high quality training for work in the European<br />
merchant marine and the Japanese fishing fleet. Remittances from seamen are a major<br />
source of cash on outer islands.<br />
Environment. The climate is maritime equatorial with temperatures changing little<br />
over the years. Daytime averages are in the thirties and night time averages in the<br />
twenties. Rainfall varies from north to south with the Phoenix group in the south<br />
particularly dry with only around 800mm per year while the northernmost islands<br />
receive as much as 3000 mm/year. All of <strong>Kiribati</strong>, but especially the Line Islands, are<br />
affected by the El Niño/El Niña cycle (ENSO) and suffer cyclic droughts. Winds are<br />
moderate, seasonal and variable. Cyclones are not a problem in <strong>Kiribati</strong> with extended<br />
droughts the primary natural hazard. Rainwater is the main source of potable water<br />
with brackish atoll lens water often used for washing. South Tarawa provides piped<br />
water sourced from the atoll fresh water lens and appears to be near the limit that can<br />
be pumped from the lens without salt water encroachment. <strong>Kiribati</strong> is a signatory to<br />
most treaties and conventions relating to environmental protection and has a special<br />
interest in climate change prevention since even a modest rise in sea level endangers<br />
the low lying atoll islands.<br />
Historical and Political. <strong>Kiribati</strong> was probably first settled over 2000 years ago.<br />
<strong>Kiribati</strong> is at the cross-roads of the Pacific and Polynesian, Micronesian, Asian and<br />
European cultures have all contributed to the development of modern <strong>Kiribati</strong>.<br />
The first recorded European visit was in 1606 but there was little contact until the<br />
1700s when trade began. Catholic and Protestant missionaries arrived in the mid<br />
v
1800s. Unfortunately, the slaving ships of South America – the Blackbirders – also<br />
visited in the mid 1800s and carried away many able bodied men from some islands<br />
of <strong>Kiribati</strong>. In 1892, the Gilbert Islands became a protectorate of Great Britain and in<br />
1900 Banaba was annexed because of its major rock phosphate resource. The removal<br />
of the phosphate left the island without the resources needed to support the population<br />
and after World War II, most of the Banabans were moved to Rabi Island in Fiji. Also<br />
relocated were Phoenix island residents who were moved to the Solomon Islands due<br />
to water supply problems.<br />
In 1916, the Gilbert and Ellice Islands became a crown colony. At the same time the<br />
the Line Islands were brought into the colony. The Phoenix Islands were added in<br />
1937 completing the collection of islands that makes up present day <strong>Kiribati</strong>.<br />
<strong>Kiribati</strong> was taken over by the Japanese during World War II and Tarawa was the site<br />
of a fierce World War II battle. After the war, Kiritimati Island was the site of the<br />
British-American atmospheric hydrogen bomb tests in the 1950s and 60s. There were<br />
no surface tests as was the case in the Marshall Islands, so no contamination remains.<br />
Independence was gained on 12 July, 1979 with government organized in the<br />
Westminster format. The head of state is the president. A unicameral legislature has<br />
42 seats with 39 elected to four -year terms by popular vote. The attorney general is<br />
an ex-officio member, one representative is appointed to represent Banaba and one<br />
other member is appointed. Today traditional government remains a strong force,<br />
particularly on the outer islands.<br />
On outer islands, power is vested in an island council, typically elder men who<br />
represent the villages on the island.<br />
Economic Overview. Phosphate, once the leading source of income, was mined out<br />
in 1979 though some income from a phosphate reserve fund established in 1956 is<br />
still present. Outer islands remain mostly in a traditional subsistence and barter<br />
economy, only Tarawa and Kiritimati can be considered as full participants in the<br />
money economy. Although by conventional poverty definitions, rural residents are<br />
often considered impoverished, there is strong evidence that the average quality of life<br />
as well as length of life is often better on rural islands than in urban Tarawa. True<br />
poverty, where there are problems in meeting basic human needs, is more common in<br />
urban areas than rural areas of <strong>Kiribati</strong>.<br />
Drought is the primary variable factor in the subsistence economy and market prices<br />
for copra and the sale of fishing licenses to foreign fishing vessels are the variables in<br />
the money economy. As is typical of atolls, the agricultural base is narrow with<br />
coconuts, breadfruit, pandanus and giant taro the only significant land based food<br />
resources. The sea is the main resource and around 80% of households consider<br />
fishing as their main economic activity.<br />
All islands of the Gilberts have airports and are reached by scheduled flights of 20-30<br />
seat aircraft, typically once or twice a week. The nearest large markets are Honolulu<br />
and Brisbane, both around 4000 km from Tarawa. A major problem for the GoK is<br />
travel between Kiritimati and Tarawa. There is insufficient traffic to support direct<br />
flights and travel between the two urban centres of <strong>Kiribati</strong> is complicated and<br />
expensive with stopovers in Majuro and Honolulu typically required.<br />
Total GDP in 2002 was around $67m dollars after subsistence fishing is added in.<br />
The growth rate of the economy has been very variable, dependent as it is on external<br />
markets and weather with an average annual growth of 1.4% though as high as 12.6%<br />
vi
in one year (1998). Investment income is currently about a third of GDP. About 20%<br />
of the population participates in the formal wage economy that accounts for over 90%<br />
of GDP. Nearly 80% of paid employment is for the government or for government<br />
owned enterprises.<br />
The National Development Strategy (2004-2007) is intended to allow <strong>Kiribati</strong> to<br />
reach the Millennium Development Goals through economic growth, equitable<br />
distribution of development benefits, improving the efficiency of public enterprises,<br />
expanding of practical training and health services, sustainable use of resources and<br />
protecting and effectively using financial reserves at the national level and in villages.<br />
Both local and foreign private sector investment is encouraged. The Development<br />
Bank of <strong>Kiribati</strong> emphasizes loans for economic development while the Bank of<br />
<strong>Kiribati</strong> is a full service commercial bank.<br />
Institutional and Legal Arrangements for Energy. The Ministry of Works and<br />
Utilities is responsible for meeting the energy needs of the country in a sustainable<br />
manner. The Ministry is to provide and maintain a resource centre that promotes the<br />
development of renewable energy resources and encourages energy efficiency.<br />
The Energy Planning Unit (EPU) is responsible for energy policy development and<br />
coordination and providing advice and assistance in all energy activities.<br />
The Public Utilities Board (PUB) is responsible for the provision of water, electricity<br />
and sewage services for South Tarawa.<br />
The Solar Energy Company (SEC) is the provider of electrical services for rural areas<br />
through the sale or lease of solar photovoltaic systems. There has been approval in<br />
principle for the SEC to become the Rural Electrification Company with<br />
responsibilities to include conventional as well as renewable energy sources.<br />
The <strong>Kiribati</strong> Oil Company (KOIL) imports, stores and distributes petroleum products.<br />
A maximum wholesale price is set by government with quarterly adjustment.<br />
Maximum retail prices are also set by government, typically immediately after a<br />
wholesale price adjustment is made.<br />
The GoK has provided investment and operating subsidies for KOIL and PUB. The<br />
SEC has received major capital subsidies from external donors, primarily JICA and<br />
the EU, but operates without a subsidy.<br />
A National Energy Policy has not been approved. Energy related legislation includes:<br />
• The Public Utilities Act of 1977 revised in 1998<br />
• The Prices Ordinance of 1976 revised in 1981<br />
• The Environment Act of 1999<br />
2. Energy<br />
Energy Supply. Though biomass used for cooking and crop drying provides around<br />
25% of the gross national energy production, <strong>Kiribati</strong> is highly dependent on<br />
petroleum imports for electricity generation for urban areas, land transport, sea<br />
transport and air transport. Though solar power is a significant energy source for the<br />
outer islands, overall it produces less than 1% of the total energy used by <strong>Kiribati</strong>.<br />
In 2003 about 4.9 ML of petrol, 2 ML of kerosene and 9 ML of ADO was delivered to<br />
<strong>Kiribati</strong> customers. Since the rural islands depend on solar and biomass for energy,<br />
vii
the growth of petroleum imports is almost entirely due to increased population and<br />
services growth on Tarawa and, to a much smaller extent, on Kiritimati.<br />
Petroleum is supplied by Mobil and BP from Fiji. Supply to the outer islands is by<br />
200 litre drums and shipping problems sometimes cause shortages. Small quantities<br />
and long distances drive up the landed price making petroleum in <strong>Kiribati</strong> more<br />
expensive that most other PICs. LPG is not yet a major import fuel though its use is<br />
growing rapidly on Tarawa. LPG is provided both by KOIL and Kirigas, a private<br />
company that has about 40% of the market share.<br />
Fuel used for aviation and the PUB are exempt from tax. Kerosene also is duty free.<br />
Petrol and ADO are taxed at $0.07 and $0.06 per litre respectively.<br />
The power system on Tarawa is currently in the last stages of being upgraded under<br />
JICA funding. About 6.5MW of generation is installed with about 3.85 MW available<br />
and a new 1.25 MW addition will be made in 2004. The two main power plants are<br />
located in Betio and Bikenibeu. Tariffs are updated regularly to keep up with changes<br />
in fuel prices. In 2003, the tariffs were $0.37 per kWh for domestic customers and<br />
$0.47 for others.<br />
Energy Demand<br />
Energy use is dominated by Tarawa and Kiritimati. For the outer islands, the percapita<br />
energy use is very low. Electricity in rural areas comes from solar home<br />
systems except for government housing around the island council offices where a<br />
small generator may be operated a few hours a day. Petroleum use is mainly kerosene<br />
used for lighting or cooking and to operate a few motorcycles and outboard powered<br />
boats. Traditional sailing canoes are used extensively for subsistence fishing keeping<br />
petrol use low on outer islands.<br />
As in most of the PICs, it appears that traditional uses of biomass no longer provide<br />
most of the overall energy used by the country though it still dominates energy use on<br />
the outer islands. Coconut husks, shells and fuel wood are used for cooking and crop<br />
drying. Copra production usually produces more biomass waste than is used so there<br />
does not seem to be any problem of scarcity or deforestation though the premium<br />
firewood species, such as mangrove, have become scarce in some areas. Rough<br />
estimates put biomass use as about 4000 tonnes of oil equivalent per year, comparable<br />
to the fuel used for electricity production.<br />
Tarawa electricity demand in 2003 was 55% government, 30% domestic and 15%<br />
commercial. Since there is no significant tourist industry, commercial uses are mostly<br />
for stores and offices. JICA predicts a slowing of the 8% electricity growth rate to 3%<br />
over the next decade but the PIREP team considers this too low and estimates a 4.5%<br />
growth for that period with the rate of demand growth on Kiritimati higher than that<br />
on Tarawa. With 2003 generation on Tarawa 15.9 GWh, that means a use of around<br />
4.4 ML of ADO for electricity production. Production figures for Kiritimati were not<br />
available but generation is a fraction of that of Tarawa.<br />
In 2003, at least 500 outer island households used solar energy for lighting and<br />
operating radios and other small appliances. The SEC operated about 325 of them and<br />
the rest were installed privately. By the end of 2005 with the completion of the EU<br />
outer islands electrification project, the number will have reached more than 2000<br />
with most of them operated by the SEC. Typical installations include a 100 Wp panel<br />
and 100 Ah battery.<br />
viii
Future Growth in Energy Demand and GHG Emissions. Since almost all the GHG<br />
emissions occur on the urban islands, any reduction in GHG emissions will have to be<br />
through energy efficiency improvements or the use of grid connected renewable<br />
energy systems. Easily the largest potential for GHG reduction is the conversion from<br />
diesel fuel to biofuels based on coconut oil. The team estimates that as much as 85%<br />
of ADO used for electricity in 2013 could be offset by the use of biofuels and another<br />
15% by solar and wind. Since the use of electricity on a per-capita basis is quite low,<br />
it seems unlikely that energy efficiency measures would save more than 10% of<br />
electricity use (most of that by government) and 5% of transport use by 2013.<br />
3. Potential for Renewable Energy Technologies<br />
Solar Though the resource varies somewhat from north to south with the southern<br />
islands having a larger and more constant resource, the level of solar energy for all of<br />
<strong>Kiribati</strong> is very good with estimates for some islands indicating over 6 kwh/m 2 /day is<br />
available for water heating or electricity generation. Since all of <strong>Kiribati</strong> is close to<br />
the equator, annual variation is not great though there is likely to be some cyclic<br />
change due to the El Niño/El Niña climate cycle.<br />
Biomass. Biomass is sufficient to provide cooking and crop drying energy without<br />
fear of depletion on all islands except Tarawa. If the coconut resource is rehabilitated,<br />
a major replanting programme will be necessary to replace senile trees and a<br />
significant amount of biomass will be made available in the form of the senile trees<br />
that are cut down. However, using that resource for energy on the outer islands would<br />
require a major infrastructure investment and may not be the most economic use of<br />
the resource since converting the trees to finished wood products for construction or<br />
furniture manufacture has good economic potential.<br />
Biofuel. Unlike many PICs, copra remains a major cash generating product for the<br />
outer islands. A new coconut oil mill owned by a government corporation operates on<br />
Tarawa with a current oil production capacity of about 700 tonnes/month. The<br />
production projected for 2004 is 2700 tonnes of oil. Production is currently limited by<br />
copra production on the outer islands that has fallen in recent years as the export price<br />
of oil at about $530/tonne FOB Tarawa has not been high enough to encourage a high<br />
level of production or investment in replanting of senile trees. The $530 per tonne is<br />
about the same cost as diesel fuel in 2003 and with petroleum prices expected to raise<br />
in the future, the local value for the oil as a diesel replacement may be greater than its<br />
value as a food product. Its large scale use as fuel for PUB generators could provide<br />
the impetus for rehabilitation of the copra resource and major economic gain for rural<br />
islands as well as reducing <strong>Kiribati</strong>’s dependence on petroleum imports whose prices<br />
cannot be controlled.<br />
Biogas. There is some potential for biogas generation if community pigs can be kept<br />
penned in a small area and manure collected for biogas generation. However the<br />
potential for saving fuel is small and the social and financial investment needed to<br />
make it practical is high.<br />
Wind. Wind power has been used for water pumping in the past but solar pumping<br />
has replaced it as more reliable. The wind energy resource is poorly understood and<br />
resource surveys need to be carried out before there is any consideration of<br />
investment for wind power for power generation. Wind installations are particularly<br />
difficult for atoll islands due to their lack of significant elevation and the dominance<br />
of tall coconut trees over most land areas. Installation of wind machines in shallow<br />
ix
lagoons or on the reef well away from trees may be required if wind power is to be<br />
practical for <strong>Kiribati</strong>.<br />
Ocean Thermal Energy Conversion (OTEC). There is significant OTEC resource<br />
in <strong>Kiribati</strong> but there have yet to be any successful commercial trials of OTEC systems<br />
and it appears very unlikely that OTEC will be economically or technically feasible<br />
on <strong>Kiribati</strong> in the next decade.<br />
Wave. The wave resource is not great and as there are no commercially available<br />
wave energy conversion systems, wave energy is not considered a practical resource<br />
for <strong>Kiribati</strong> over the next decade.<br />
Tidal energy. Although there is a significant flow of tidal waters through lagoon<br />
channels during tidal flow periods, its intermittent nature and the small tidal range in<br />
<strong>Kiribati</strong> does not allow cost effective development of tidal energy.<br />
4. Experiences with Renewable Energy Technologies<br />
The traditional use of biomass for cooking and copra drying remains the largest use of<br />
renewable energy in <strong>Kiribati</strong>. Solar water heating and solar electric generation using<br />
photovoltaics is the only other renewable energy used thus far in <strong>Kiribati</strong> though<br />
biofuels offer great potential.<br />
Solar Photovoltaics. <strong>Kiribati</strong> was one of the first countries in the world to actively<br />
promote solar energy for electrification. The Solar Energy Company (SEC) was<br />
formed in 1984 by an NGO, the Foundation for the Peoples of the South Pacific<br />
(FSP), to sell solar equipment for household lighting and small appliance use. The<br />
ownership of the company was turned over to the government after its start up and<br />
sales to outer island households were made from Tarawa. The company was funded<br />
by a USAID grant and operated with limited success, selling less than 300 solar home<br />
systems in five years. In 1989, when the company faced bankruptcy, the structure of<br />
the company was changed from a sales company to a solar utility company whereby<br />
solar installations would be made and maintained by the company, with ownership<br />
retained by SEC and electricity services sold to users for a fee.<br />
In 1992, JICA completed a trial project of 56 households on North Tarawa managed<br />
under the solar utility institutional concept. The early success of the approach resulted<br />
in the EU adding about 250 more households to the SEC’s holdings on three islands<br />
in 1994. The continued success of the SEC to operate and maintain the systems,<br />
providing services to the rural households with no external operating subsidies,<br />
encouraged the EU to fund a large scale project that would expand the utility to 2000<br />
homes on all the islands of the Gilbert Island group. That expansion is expected to be<br />
completed in 2005. The SEC is already considering the next expansion phase to<br />
further increase coverage in the Gilbert Islands and possibly expand to the Line<br />
Islands. In addition to household electrification, solar PV powers street lighting,<br />
health centres, schools, community buildings (maneabas), communications systems<br />
and water pumps. Though most installations are on outer islands, solar street lighting<br />
has been used successfully on South Tarawa.<br />
The main problem facing the SEC is the dispersed nature of their responsibility,<br />
spread as it is over the 18 islands of the Gilbert group, and the problem of obtaining<br />
and maintaining adequate technical and administrative capacity on the outer islands<br />
for reliable system maintenance and fee collection.<br />
x
Solar Thermal. Some solar water heating has been installed on the hotels and guest<br />
houses of Tarawa and Kiritimati Islands but there has been little use in households or<br />
for other purposes. The market is limited by the cost of the units, their poor record of<br />
success (due largely to using high mineral content ground water that results in rapid<br />
buildup of scale in the water heaters) and the small demand by households for piped<br />
hot water.<br />
Wind Power. No wind power has been developed in <strong>Kiribati</strong>, but a wind resource<br />
assessment is recommended to determine if the resource is economically developable.<br />
Biomass, biogas and biofuels. Except for traditional biomass use for cooking and<br />
copra drying, there has been no development of biomass, biofuel or biogas for energy<br />
production.<br />
5. Barriers to Development and Commercialisation of RETs and Energy<br />
Efficiency Measures<br />
Barriers to Renewable Energy Development.<br />
The barriers to renewable energy development include:<br />
• the relative cost of renewable energy tends to be high, particularly the initial<br />
investment;<br />
• the real cost of electricity delivery by the PUB is not known making it<br />
difficult to determine the relative economics of using renewables for power<br />
generation on Tawara; there is almost total dependence on external funding for<br />
energy projects that results in long lead times and adds complexity to<br />
implementation;<br />
• duties and taxes are applied inconsistently for renewable energy systems;<br />
• no National Energy Policy has been developed to show a clear path for<br />
renewable energy development;<br />
• limited capacity is present for energy planning and project development at the<br />
EPU;<br />
• limited capacity is present for financial planning and analysis at the PUB, SEC<br />
and KOIL;<br />
• record keeping and data management needs improvement in the energy<br />
companies;<br />
• there is a lack of local training capacity in business management;<br />
• there is a lack of trained or experienced personnel for management or<br />
technical positions in energy companies, especially on outer islands;<br />
• there are difficult environmental conditions for energy equipment;<br />
• the population is widely dispersed on numerous atoll islands;<br />
• international shipping by air and by sea is not reliable or of good quality;<br />
• problems of access to outer islands makes rural development difficult and<br />
costly;<br />
• there is a small and fragmented energy market making development of private<br />
energy related businesses difficult; and<br />
xi
• there is a lack of public awareness regarding renewable energy and energy<br />
efficiency.<br />
6. Implementation and Capacity<br />
Reduction<br />
Development Needs for Barrier<br />
Capacity development and capacity support is needed for:<br />
• project development activities;<br />
• fiscal policy development to rationalize taxes and duties for energy related<br />
activities;<br />
• energy policy development;<br />
• management capacity development;<br />
• capacity development for technical training at the TTI;<br />
• development of record keeping, storage and retrieval capacity at PUB, KOIL<br />
and SEC;<br />
• assistance is needed by the EPU, SEC and PUB in the development of grid<br />
connected renewable energy systems;<br />
• development of standards and certification processes for RETs;<br />
• delivery of renewable energy information to decision makers;and<br />
• public information programmes.<br />
7. Implications of Large Scale Renewable Energy Development<br />
Solar energy and biofuels are known to have the potential for large scale renewable<br />
energy development. Wind power may also be cost effective in some locations but a<br />
resource assessment is necessary to determine that potential.<br />
The widespread use of solar for rural electrification can improve education,<br />
communications, health and public safety. For the mid-term, it appears that individual<br />
SHS represent the best approach to rural electrification in <strong>Kiribati</strong> as long as the SEC<br />
is able to provide the level of services to each household that specifically meets the<br />
needs of that customer. Since battery storage must be used, there is a requirement to<br />
recycle batteries to prevent possible environmental damage from the lead contained in<br />
spent batteries. The SEC is arranging for recycling of batteries and no adverse<br />
environmental impact on rural areas is anticipated.<br />
The greatest potential for GHG reduction by solar energy is with grid connected<br />
photovoltaics on Tarawa and Kiritimati Islands. There are large land areas available<br />
near the airport where residences and shops are not allowed due to the use of the land<br />
for water supply purposes. The development of solar photovoltaics in that area would<br />
not affect the quality of water or reduce water availability, so large arrays could be<br />
installed without adverse social or environmental impact. The use of a number of<br />
roof-top modular generators connected to the grid also creates no negative social or<br />
environmental impacts.<br />
Since there is presently production of coconut oil in <strong>Kiribati</strong> in substantial volume,<br />
increasing production requires mainly rehabilitation of older stands of trees,<br />
improvements in transport efficiencies and an increase in the price offered for copra.<br />
The potential economic benefit for rural communities is great and social benefits can<br />
xii
e expected to follow as a result. No significant adverse environmental effects are<br />
anticipated from increased oil production and a substantial decrease in GHG<br />
emissions would result.<br />
8. Implementation of the Capacity Development Opportunities<br />
The existing EU outer island electrification project is an opportunity for co-financing<br />
of capacity building efforts as is the JICA power development project on Tarawa. No<br />
other energy projects are in the pipeline at this time but further development of the<br />
power system on Kiritimati and expansion of the SEC operations are likely to occur in<br />
the future and will offer co-financing opportunities.<br />
xiii
TABLE OF CONTENTS<br />
EXECUTIVE SUMMARY ............................................................................. V<br />
1. COUNTRY CONTEXT...................................................................................1<br />
1.1 Physical ..........................................................................................................1<br />
1.2 Social .............................................................................................................1<br />
1.2.1 Education ................................................................................................................3<br />
1.3 Environmental.................................................................................................3<br />
1.3.1 Climate ...................................................................................................................3<br />
1.3.2 Environmental Treaties and obligations ......................................................................4<br />
1.4 Historical and Political ......................................................................................4<br />
1.5 Economic........................................................................................................6<br />
1.5.1 Millennium Development Goals..................................................................................9<br />
1.5.2 Investment and banking ...........................................................................................9<br />
1.6 Institutional Context for Energy ...................................................................... 10<br />
1.6.1 EPU ......................................................................................................................11<br />
1.6.2 PUB ......................................................................................................................11<br />
1.6.3 SEC.......................................................................................................................11<br />
1.6.4 KOIL .....................................................................................................................12<br />
1.6.5 Fuel price control ...................................................................................................12<br />
1.6.6 Energy investments and aid ....................................................................................12<br />
1.6.7 Energy policy .........................................................................................................13<br />
1.6.8 Energy Legislation ..................................................................................................13<br />
1.6.9 Inter-ministerial Energy Committees ........................................................................14<br />
2 ENERGY............................................................................................. 15<br />
2.1 Energy Supply............................................................................................... 15<br />
2.1.1 Petroleum..............................................................................................................15<br />
2.1.2 Fuel storage ..........................................................................................................17<br />
2.1.3 Duties on petroleum fuels .......................................................................................17<br />
2.1.4 Biomass ................................................................................................................18<br />
2.1.5 Electricity Supply....................................................................................................18<br />
2.2 Energy Demand ............................................................................................ 19<br />
2.2.1 Petroleum..............................................................................................................19<br />
2.2.2 Biomass ................................................................................................................19<br />
2.2.3 Electricity on Tarawa ..............................................................................................20<br />
2.2.4 Electrification away from South Tarawa....................................................................21<br />
2.3 Future Growth in Energy Demand................................................................... 21<br />
2.3.1 Petroleum..............................................................................................................21<br />
2.3.2 Electricity ..............................................................................................................22<br />
2.4 GHG Inventory .............................................................................................. 23<br />
3 RENEWABLE ENERGY................................................................................ 25<br />
3.1 Solar ............................................................................................................ 25<br />
3.1.1 Solar photovoltaics .................................................................................................25<br />
3.1.2 Solar thermal.........................................................................................................26<br />
3.2 Biomass........................................................................................................ 26<br />
3.2.1 Biomass ................................................................................................................26<br />
3.2.2 Biofuel ..................................................................................................................26<br />
3.2.3 Biogas...................................................................................................................28<br />
3.3 Wind ............................................................................................................ 28<br />
3.4 Ocean Energy ............................................................................................... 28<br />
3.4.1 OTEC ....................................................................................................................28<br />
3.4.2 Wave Energy .........................................................................................................29<br />
3.4.3 Tidal energy ..........................................................................................................30<br />
3.5 Geothermal................................................................................................... 30<br />
3.6 Hydro........................................................................................................... 30<br />
4 RENEWABLE ENERGY EXPERIENCE .................................................................. 31<br />
xiv
4.1 Solar Photovoltaic Experience ......................................................................... 31<br />
4.1.1 Solar Pumping .......................................................................................................31<br />
4.1.2 Solar Clinic Electrification ........................................................................................32<br />
4.1.3 School, government and maneaba electrification.......................................................32<br />
4.1.4 Telecom ................................................................................................................32<br />
4.1.5 Street Lighting .......................................................................................................33<br />
4.1.6 Private sales ..........................................................................................................33<br />
4.1.7 Solar Energy Company experience ...........................................................................33<br />
4.2 Lessons Learned ........................................................................................... 41<br />
4.3 Proposed Renewable Energy Projects.............................................................. 42<br />
4.3.1 Further electrification of the Gilberts ........................................................................42<br />
4.3.2 Wind resource assessment for Tarawa and Kiritimati .................................................42<br />
4.3.3 Electrification in Line and Phoenix............................................................................42<br />
4.3.4 Biofuel development...............................................................................................42<br />
4.3.5 Grid based solar.....................................................................................................43<br />
5 BARRIERS TO DEVELOPMENT AND COMMERCIALIZATION OF RENEWABLE ENERGY.................... 44<br />
5.1 Specific Barriers ............................................................................................ 44<br />
5.1.1 Fiscal and Financial Barriers ....................................................................................44<br />
5.1.2 Legislative, Regulatory and Policy Barriers ................................................................44<br />
5.1.3 Institutional Barriers ...............................................................................................44<br />
5.1.4 Technical Barriers...................................................................................................46<br />
5.1.5 Physical Barriers.....................................................................................................46<br />
5.1.6 Market Barriers ......................................................................................................46<br />
5.1.7 Informational and Public Awareness Barriers ............................................................47<br />
6 IMPLEMENTATION AND CAPACITY DEVELOPMENT NEEDS FOR BARRIER REDUCTION.................. 48<br />
6.1 Reducing Barriers Through Capacity Development............................................ 48<br />
6.1.1 Fiscal and Financial Barriers ....................................................................................48<br />
6.1.2 Legislative, Regulatory and Policy Barriers ................................................................48<br />
6.1.3 Institutional Barriers ...............................................................................................48<br />
6.1.4 Technical Barriers...................................................................................................49<br />
6.1.5 Physical Barriers.....................................................................................................49<br />
6.1.6 Informational and Public Awareness Barriers ............................................................49<br />
7 IMPLICATIONS OF LARGE SCALE RENEWABLE ENERGY DEVELOPMENT................................. 51<br />
7.1 Solar development......................................................................................... 51<br />
7.1.1 Rural electrification.................................................................................................51<br />
7.1.2 Urban electrification ...............................................................................................51<br />
7.2 Wind power for urban island power production ................................................ 51<br />
7.3 Biofuel production to offset diesel imports ....................................................... 52<br />
8 ENERGY EFFICIENCY OPPORTUNITIES................................................................ 53<br />
8.1 Petroleum Use Efficiency................................................................................ 53<br />
8.2 Electricity Efficiency ....................................................................................... 53<br />
9 CAPACITY DEVELOPMENT CO-FINANCING OPPORTUNITIES .......................................... 54<br />
10 ANNEXES............................................................................................ 56<br />
Annex A: People Consulted by the PIREP Mission to <strong>Kiribati</strong> ........................................ 56<br />
Annex B: References for <strong>Kiribati</strong> PIREP Report............................................................ 58<br />
xv
1.1 Physical<br />
1. COUNTRY C ONTEXT<br />
The Republic of <strong>Kiribati</strong> has 85,000 Banaba people living on 811 square kilometres<br />
(km 2 ) of land including one raised coral island (Banaba) and 32 widely scattered<br />
atolls in three island groups (Gilbert, Line, and Phoenix) spread over a large ocean<br />
area measuring 4200 km from east to west and 2000 km from north to south. <strong>Kiribati</strong><br />
exemplifies the development challenges facing a small, remote and resource-poor<br />
island state during a period of rapid global change. The environment is fragile and –<br />
especially in rapidly-growing urban South Tarawa – deteriorating. There is<br />
considerable difficulty in providing adequate basic services to the people, especially<br />
the outer island rural majority. Nonetheless, the I-<strong>Kiribati</strong> – the people of <strong>Kiribati</strong> –<br />
have the advantages of a strong and resilient culture, a highly egalitarian society<br />
(gender issues aside), strong democratic principles, extensive sea resources, and a<br />
record of prudent fiscal management.<br />
Table 1-1 - Physical Features of <strong>Kiribati</strong><br />
Island<br />
group<br />
Land area Landforms Soil type<br />
Gilberts<br />
Phoenix<br />
Line<br />
Source: GoK<br />
Tarawa<br />
31.1km 2 ;<br />
Total 285.5<br />
Line and<br />
Phoenix<br />
total 525<br />
km 2<br />
(mostly in<br />
Kiritimati<br />
Island)<br />
Low-lying coral atolls<br />
surrounded by extensive reefs<br />
except for Banaba, a raised coral<br />
island<br />
Low-lying coral atolls<br />
surrounded by extensive reefs<br />
1<br />
Banaba has residual rock-phosphate from<br />
extensive mining over the past century. All<br />
other islands have limited topsoil with limited<br />
fertility.<br />
1.2 Social<br />
In November 2000, the date of the last national census, <strong>Kiribati</strong> had a population of<br />
84,494, an annual average growth rate (AAGR) for 1995-2000 of 1.7%, with an urban<br />
growth of 5.2% per year and a rural decline of 0.6%. The sole urban agglomeration –<br />
South Tarawa – reached 36,717 or 43.5% of the total national population compared to<br />
36.5% only five years earlier. If this trend continues, South Tarawa would reach<br />
50,000 people by 2006 that will require major upgrading of water and sanitation<br />
systems. Demographic trends underlie many of the development problems facing<br />
<strong>Kiribati</strong>: a moderately high rate of national population growth; an ever-increasing<br />
concentration of the population on South Tarawa; and the large, and apparently<br />
growing, gap in the life expectancy of <strong>Kiribati</strong>’s male and female population.<br />
Population changes by island from 1995 – 2000 are shown in Table 1-2.<br />
The population is growing fastest on South Tarawa, both because the younger agestructure<br />
of its population contributes to relatively more births, and also because inmigration<br />
from other islands has continued unabated for several decades. Population<br />
growth in the outer Gilbert Islands group since 1995 has been about a third of the<br />
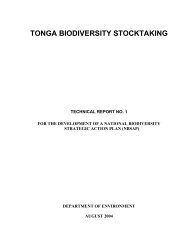
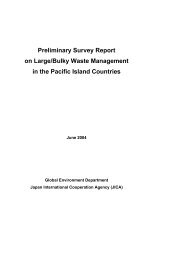
Tarawa rate. Figure 1-1 shows clearly (black column) the rapid growth of South<br />
Tarawa since 1963, the modest growth of the Line and Phoenix Islands due mainly to
government’s relocation programmes, and the recent decline in population in the rest<br />
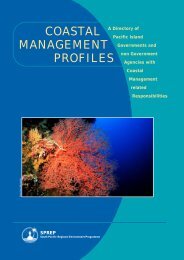
of <strong>Kiribati</strong>. The increased concentration of population (Figure 1-2) and economic<br />
activity on South Tarawa is having various negative effects on people’s lives on both<br />
South Tarawa and that of people on the rural islands.<br />
Table 1-2 - Population Size, Growth, Distribution and Density by Island (1995 and 2000)<br />
Island Population AAGR * Land<br />
area<br />
1995 2000 1990-<br />
1995<br />
According to the National Development Strategy 2004-2007 (NDS 2004-07), the<br />
population is believed to have grown by a further 6000 from 2000-2003, of which<br />
two-thirds of the growth is estimated to be in South Tarawa. The Government of<br />
<strong>Kiribati</strong> (GoK) has not formally projected future population growth or its distribution,<br />
however, NDS 2004-07 notes that demographers from the Secretariat of the Pacific<br />
Communities (SPC), using UN data showing high fertility rates and increased life<br />
expectancy, suggest a total population of 140,000-145,000 by 2025, of which around<br />
70,000 could be in Tarawa, 20,000 in Kiritimati, and 50,000-55,000 spread among the<br />
other islands. This projection assumes an overall AAGR of 2.0-2.2% (compared to<br />
1.7% from 1995-2000), Tarawa atoll growth of 2.8%/year (down considerably from<br />
the recent 5%), and Kiritimati growth of 7.4%/year (up dramatically from 1.2%). The<br />
2<br />
1995-<br />
2000<br />
Density<br />
km 2 Persons<br />
Per km 2<br />
North Tarawa 4,004 4,477 1.9 2.2 15.3 312<br />
South Tarawa 28,350 36,717 2.2 5.2 15.8 2,324<br />
TARAWA TOTAL 32,354 41,194 2.2 5.0 31.1 1,334<br />
Banaba 339 276 3.5 -4.1 6.3 44<br />
Makin 1,830 1691 0.8 -1.6 7.9 216<br />
Butaritari 3,909 3,464 0.7 -2.4 13.5 257<br />
Marakei 2,724 2,544 -1 -1.4 14.1 180<br />
Abaiang 6,020 5,794 2.8 -0.8 17.5 331<br />
Maiana 2,184 2,048 0 -1.3 16.7 123<br />
Abemama 3,442 3,142 1.3 -1.8 27.4 114<br />
Kuria 971 961 -0.4 -0.2 15.5 62<br />
Aranuka 1,015 966 0.3 -1.0 11.6 83<br />
Nonouti 3,042 3,176 1.6 0.9 19.9 159<br />
North Tabiteuea 3,383 3,365 1.1 -0.1 25.8 130<br />
South Tabiteuea 1,404 1,217 1.1 -2.9 11.9 102<br />
Beru 2,784 2,732 -0.9 -0.4 17.7 155<br />
Nikunau 2,009 1,733 0.1 -3.0 19.1 91<br />
Onotoa 1,918 1,668 -1.8 -2.8 15.6 107<br />
Tamana 1,181 962 -3.2 -4.1 4.7 200<br />
Arorae 1,248 1,225 -2.9 -0.4 9.5 129<br />
GILBERTS TOTAL 71,757 78,158 1.2 1.7 285.5 275<br />
Teeraina 978 1,087 0.9 2.1 9.6 113<br />
Tabuaeran 1,615 1,757 4.2 1.7 33.7 57<br />
Kiritimati (Christmas Isl.) 3,225 3,431 4.8 1.2 388.4 9<br />
Kanton 83 61 12.2 -6.2 9.2 7<br />
Uninhabited 0 0 0 0 84.2<br />
LINE and PHOENIX TOTAL 5,901 6,336 4.0 1.4 525 12<br />
KIRIBATI TOTAL 77,658 84,494 1.4 1.7 810.5 105<br />
Source: Report on the 2000 Census of Population (November 2001; * AAGR = average annual growth rate
emaining islands, essentially rural <strong>Kiribati</strong>, are expected to grow at an AAGR of 0.9-<br />
1.3 percent.<br />
The GoK has encouraged migration<br />
to Kiritimati – with over ten times the<br />
land area of South and North Tarawa<br />
combined – for over twenty years. In<br />
the 1980s, emigration to the other<br />
islands of the Line group, Teeraina<br />
and Tabuaeran, was also encouraged<br />
with resettlement incentives but now<br />
that the populations have reached a<br />
level the government feels to be the<br />
optimum, those incentives have been<br />
dropped. Today, with the help of<br />
ADB funding, emigration to the Phoenix<br />
Islands is being promoted. Shipping to<br />
Kiritimati has recently improved, new<br />
airport facilities have been constructed and<br />
Kiritimati’s population has already<br />
increased from about 3500 to 5000 from<br />
2000 to late 2002. If the longer-term<br />
projections are reasonably accurate,<br />
Kiritimati will double in population every<br />
ten years, suggesting a huge increase in its<br />
demand for energy. Tarawa, even at the<br />
projected decreased growth rate, would<br />
nearly double in population from 2000-<br />
2025, also suggesting a significant increase<br />
in its energy demand. The other islands,<br />
which are expected to remain nearly static in<br />
population, should continue to have<br />
relatively modest demands even if the quality of energy services increases<br />
significantly.<br />
1.2.1 Education<br />
Free education is available to children from pre-school through form six. Postsecondary<br />
education is available through a distance learning branch of USP and<br />
vocational-technical training in some fields is available through the Tarawa Technical<br />
Institute (TTI). Of particular value to the economy is the Marine Training Centre<br />
(MTC) where excellent training is provided for work in the European merchant<br />
marine and Japanese fishing fleet and remittances from seamen on foreign vessels<br />
forms a major source of cash for outer island families.<br />
1.3 Environmental<br />
1.3.1 Climate<br />
Figure 1-1 - <strong>Kiribati</strong> Population By Location, 1963-2000<br />
The Equator passes through <strong>Kiribati</strong> with Tamana and Arorae and the entire Phoenix<br />
group south of the equator while the rest of the Gilberts and all the Line Islands are to<br />
the north. All islands therefore have a maritime tropical environment. The climate<br />
3<br />
Number of people<br />
50000<br />
45000<br />
40000<br />
35000<br />
30000<br />
25000<br />
20000<br />
15000<br />
10000<br />
5000<br />
0<br />
1963 1968 1973 1978 1985 1990 1995 2000<br />
South Tarawa<br />
Year<br />
Rest of <strong>Kiribati</strong> Line & Phoenix<br />
Source: Report on 2000 Census<br />
Figure 1-2 - Population Density 1995 & 2000<br />
2500<br />
2000<br />
1500<br />
1000<br />
500<br />
0<br />
South<br />
Tarawa<br />
Other<br />
Tarawa<br />
Gilbert<br />
Group<br />
1995 2000<br />
Source: Report on 2000 Census<br />
Line &<br />
Phoenix
varies somewhat from north to south with more rainfall to the north on average with<br />
the Phoenix group averaging only around 800 mm/year while as much as 3000<br />
mm/year may fall in the northern most islands. The entire country, but especially<br />
Kiritimati Island, finds its rainfall climate to be affected strongly by the El Niño/El<br />
Niña cycle (ENSO) as shown by the cyclic nature of droughts that correlate with the<br />
ENSO. Winds are variable and seasonal with October to March the “Aumeang” or<br />
northerly and easterly wind season, a wetter season, and April to September the<br />
“Aumaiaki” or southerly and easterly wind season. Typhoons are not a risk in <strong>Kiribati</strong><br />
but extended droughts do occur so maintaining a fresh water supply is a continuing<br />
problem for residents. Rainwater is the primary source of potable water on most<br />
islands with often brackish atoll lens water often used for washing. South Tarawa has<br />
developed its public water supply based on ground water and appears to have reached<br />
the limit of pumping without serious salt water encroachment into the fresh water lens<br />
making water supply a high priority for the future. Temperatures changes little from<br />
month to month with daytime averages in the low 30’s and falling into the 20’s at<br />
night.<br />
1.3.2 Environmental Treaties and obligations<br />
<strong>Kiribati</strong> is party to various treaties and conventions related to environmental<br />
protection, including the United Nations Framework Convention on Climate Change<br />
(UNFCCC), the Kyoto Protocol, the Convention to Combat Desertification, and the<br />
Convention on Biological Diversity. An initial national communication to the UN<br />
FCCC, indicating greenhouse gas emissions, and vulnerability and adaptation to<br />
climate change, was submitted in 2000. Table 1.3 summarises the status and date of<br />
signing of some key environmental conventions.<br />
Table 1-3 - Status of Ratification of Environmental Treaties and Conventions by <strong>Kiribati</strong><br />
Status in<br />
<strong>Kiribati</strong><br />
Signed<br />
Ratified<br />
Entered into force<br />
Conservation<br />
of nature<br />
(Apia<br />
Convention)<br />
√<br />
n/a<br />
n/a<br />
Hazardous wastes<br />
(Waigani<br />
Convention)<br />
16 Sep 95<br />
28 Jun 01<br />
21 Oct 01<br />
4<br />
Nuclear free<br />
Pacific<br />
(Rarotonga<br />
Treaty)<br />
06 Aug 85<br />
28 Oct 86<br />
11 Dec 86<br />
GHG reductions<br />
(Kyoto<br />
Protocol)<br />
Acceded<br />
17 Sep 00<br />
Note: The above treaties and conventions are briefly described in volume 1, the PIREP Regional Overview report<br />
Ozone depleting<br />
substances<br />
(Montreal<br />
Protocol, et. al.)<br />
Acceded to Vienna<br />
Convention,<br />
07 Jan 93<br />
1.4 Historical and Political<br />
Probably first settled over 2000 years ago, the genetic heritage of the I-<strong>Kiribati</strong><br />
includes both Micronesian and Polynesian ancestry though probably the early settlers<br />
were of Micronesian stock. Samoa visitations occurred centuries ago and in the 14 th<br />
century Fiji and Tonga both invaded some of the islands of <strong>Kiribati</strong> adding Polynesian<br />
and Melanesian genes to the pool. In the 19 th and 20 th centuries, European and Asian,<br />
particularly Chinese, emigrants also have made their mark on the culture and gene<br />
pool. The language has various dialects reflecting the proximity of islands to other<br />
language groups as well as general language drifts occurring due to the relative<br />
isolation of the island populations. The advent of the radio and national schooling has<br />
tended to standardise the language and the younger generation tends to be more<br />
uniform in language than their elders.<br />
The earliest recorded visit by Europeans was in 1606 when a Spanish explorer<br />
happened on to Butaritari. Few Europeans were seen by <strong>Kiribati</strong> residents until the<br />
late 1700s when Pacific exploration and trade began in earnest. The Gilbert Islands
were named in the 1820s (by a Russian hydrographer, not, as is widely believed, by<br />
the British). Whalers were the main visitors in the mid-1800s along with Catholic and<br />
Protestant missionaries. Unfortunately slaving ships, the “Blackbirders” also visited<br />
though they did not depopulate the islands as severely as occurred in parts of Tokelau<br />
and Tuvalu.<br />
In 1892, the British declared the Gilbert Islands as a protectorate and in 1900 also<br />
annexed Banaba with its major rock-phosphate resource. The removal of the<br />
phosphate left the island essentially without resources needed to support the populace<br />
and, after World War II, most of the Banaba citizens were moved to Rabi Island off<br />
the coast of Vanua Levu in Fiji where they and their descendents remain. The<br />
population left on Banaba still consider themselves as separate from <strong>Kiribati</strong> and have<br />
in the past proposed independence. But with less than 400 residents and minimal<br />
resources, that is not an option likely to be taken. Adding complexity to the issue is<br />
the fact that most land ownership on Banaba is with families residing in Rabi and<br />
there are two local governments, one on Rabi (the Rabi Council of Leaders)<br />
representing mainly issues regarding the absentee land owners and one on Banaba<br />
itself, the Banaba Island Council that handles local social matters. Also relocated were<br />
Phoenix Islanders who, in the face of droughts and serious problems with their water<br />
supply, were moved to the Solomon Islands where there remains a sizeable I-<strong>Kiribati</strong><br />
enclave on Guadalcanal.<br />
In 1916, the Gilbert and Ellice Islands officially became a Crown Colony with the<br />
addition of the Line Islands. The Phoenix Islands were added in 1937 to form what is<br />
present day <strong>Kiribati</strong>.<br />
World War Two found <strong>Kiribati</strong> to be strategically located and Japanese and<br />
American forces met in fierce battle at Betio where many relics of the war still<br />
remain. Kiritimati Island was the site of the British-American atmospheric hydrogen<br />
bomb tests in the late 1950s and early 1960s but there were no surface detonations so<br />
radioactive fallout was not a problem and, unlike in the Marshall Islands, nuclear<br />
testing has had no lasting effect on the islands.<br />
The move to independence began in 1963 with the formation of legislative and<br />
executive councils under the supervision of a British governor- general. The<br />
legislative council later evolved into the Maneaba ni Maungatabu (Parliament) of<br />
today. In 1975, the Ellice Islands seceded to form the separate Polynesian territory of<br />
Tuvalu. The Gilbert, Line and Phoenix islands became the independent republic of<br />
<strong>Kiribati</strong> on 12 July 1979. Ieremia Tabai, a veteran of <strong>Kiribati</strong> politics, won the first<br />
three post-independence presidential elections, held in 1982, 1983 and 1987. <strong>Kiribati</strong><br />
remains a member of the British Commonwealth of Nations.<br />
Local, traditional government remains a strong force, particularly on the outer islands.<br />
Power is vested in an Island Council, typically composed of older men, who meet in<br />
the community hall, the maneaba, and make the decisions needed to keep island<br />
society running smoothly.<br />
The national government has its focus on Tarawa where virtually all national<br />
government is concentrated. The President and Head of State is (2004) Anote Tong,<br />
elected by popular vote from candidates selected by parliament, to a four-year term in<br />
July 2003 when he defeated his elder brother, Harry Tong. A court challenge followed<br />
which claimed violations of laws relating to campaign finance. However, in October<br />
2003, a neutral judge was brought in from Australia who ultimately ruled in President<br />
5
Tong's favour. There is a 12-member cabinet appointed by the president from among<br />
the members of parliament. The Maneaba Ni Maungatabu has 42 seats, 39 elected by<br />
popular vote, one ex-officio member (the Attorney General), one appointed to<br />
represent the island of Banaba, and one other. Members serve four-year terms. The<br />
judicial system consists of a Court of Appeal, a High Court, and 26 Magistrates'<br />
courts with all judges appointed by the president.<br />
Democratic values in <strong>Kiribati</strong> are strong with free elections every four years by<br />
universal adult suffrage. The government combines Westminster principles and<br />
customary values, with considerable influence held by the elder males. Policy<br />
formulation and decision-making are relatively open, involving widespread<br />
consultation. The overall quality of public administration has improved in recent years<br />
but the government itself identifies weaknesses in: 1) the budgeting and budget<br />
control system including data collection and analysis; 2) sectoral planning and<br />
monitoring; and 3) focus by ministries on their core functions.<br />
1.5 Economic<br />
Phosphate, mined on Banaba, was once the leading source of income. The national<br />
economy suffered severely when phosphate mining ceased in 1979 although <strong>Kiribati</strong><br />
continues to receive interest income from a phosphate reserve fund established in<br />
1956. Today, only South Tarawa and Kiritimati Islands can be considered full<br />
participants in the monetised economy. Outer islands remain largely in a subsistence<br />
based economy with individual, family and group ownership of land at its base. Even the<br />
North Tarawa population with its ready access to markets and facilities on South Tarawa<br />
remains a largely subsistence based economy. Although by conventional poverty<br />
definitions, rural residents are generally considered impoverished, there is strong<br />
evidence that the average quality of life – and indeed the length of life – is often better in<br />
rural areas. True poverty, where there is difficulty in meeting basic human needs, is more<br />
easily found on Tarawa than on the outer islands.<br />
<strong>Kiribati</strong> is a small, isolated and geographically widespread atoll nation, categorised by the<br />
United Nations as least-developed due to low incomes, weak human resources, and a high<br />
degree of economic vulnerability. As with most PIC economies, small size and<br />
dependence on a few sectors allow large fluctuations from year to year. Changes in copra<br />
price and the sale of fishing licenses to foreign fishing operations are factors that have<br />
considerable effect on the money economy. Drought is the primary factor in the<br />
subsistence economy. The Asian Development Bank ranks <strong>Kiribati</strong> as its most<br />
economically vulnerable Pacific island member.<br />
The agricultural base is very narrow with coconuts, breadfruit, pandanus and giant<br />
taro the only significant land based food resources. The arid climate and poor soil<br />
offer little potential for further agricultural development. Ocean resources are the<br />
mainstay of the economy, about 80% of households making a living or surviving<br />
through fishing.<br />
The public sector dominates all spheres of economic activity. Fishing licensing fees<br />
are the major source of foreign exchange and government revenue, while import<br />
duties and remittances from I-<strong>Kiribati</strong> employed in foreign shipping fleets provide<br />
significant additional government revenue and foreign exchange, respectively.<br />
Transport within <strong>Kiribati</strong> is limited and is primarily by boat though all islands of the<br />
Gilberts have airports and scheduled flights by 20-30 seat aircraft. The nearest large<br />
markets are in Honolulu and Brisbane, around 4000 kilometres from Tarawa. A major<br />
6
problem for government is communications between the two “urban” enclaves of<br />
Tarawa and Kiritimati Islands. Although direct flights have been tried several times in<br />
the past, they have invariably operated at a huge loss and always there has been the<br />
reversion to inconvenient air access via Majuro and then Hawaii. Direct flights to<br />
Kiritimati Island from Hawaii have been cost effective due to the significant tourism<br />
attractions of Kiritimati, particularly the excellent open ocean sport fishing for<br />
bonefish and larger game fish.<br />
Table 1-4 - Real GDP by Industry from 1991-2002 (A$ thousands; 1991 prices)<br />
1991 1992 1993 1994 1995 1996 1997 1998 1999 2000 2001 2002<br />
Agriculture 1193 997 1201 1520 192 727 176 684 2011 1183 1529 1191<br />
Copra Cutters 2551 2882 3020 3451 3110 2684 1487 3234 3386 1685 2054 1665<br />
Copra Society - 1398 - 1926 - 1865 - 1976 - 2978 - 2004 - 1354 - 2590 - 1405 - 532 - 557 - 507<br />
Other 40 41 45 46 60 46 43 40 30 30 33 33<br />
Fishing 1971 1862 1638 1605 1903 1920 1478 1680 1517 1526 1288 1259<br />
Seaweed 347 148 71 250 226 403 314 252 398 497 397 408<br />
Manufacturing 365 200 354 412 605 545 545 688 613 649 770 747<br />
Electricity 737 748 776 834 839 819 909 1053 1180 1328 1388 1419<br />
Construction 1988 969 845 1030 882 855 993 3171 3593 3641 4676 4138<br />
Wholesale/Retail 5605 6316 5623 5938 6823 5733 5850 8237 7043 8484 7722 7894<br />
Hotels/Bars 1050 1326 1445 1256 1278 1477 1642 1727 1440 1418 1410 1498<br />
Transport<br />
Public 2963 3260 3327 4431 3590 3267 3838 4495 4522 4672 4809 4845<br />
Private 971 831 1113 1108 1244 1277 1302 1317 1277 1294 1196 1224<br />
Communication 1348 1419 1490 1561 1632 1703 1774 1845 1916 1987 2057 2128<br />
Finance 2640 2604 3833 4084 3854 3912 4395 6303 6119 6079 6393 6724<br />
Owner occupied 1153 923 844 1181 1117 1313 1492 1279 1259 1527 1567 1589<br />
Govt. Services<br />
Government 10378 10943 11001 12158 13560 15119 15110 15618 18669 18794 19055 19843<br />
PNPI 1079 1257 1255 1490 1184 1224 1266 1250 1268 1286 1304 1318<br />
Other 384 372 454 477 406 518 529 540 543 575 527 516<br />
Less imputed<br />
bank services<br />
- 2001 - 2385 - 3490 - 3614 - 3500 - 3359 - 3943 - 5451 - 5335 - 5412 - 5557 - 5817<br />
Total 31991 31789 31779 35721 35835 37453 37659 44688 48032 49527 50530 50923<br />
Plus indirect taxes 7122 7272 8237 7741 10192 10414 11261 11130 13461 12882 13075 13290<br />
Less subsidies - 669 - 683 - 774 - 727 - 957 - 978 - 1058 - 1045 - 1264 - 1210 - 1228 - 1248<br />
Monetary GDP, MP 38444 38378 39242 42736 45069 46888 47862 54773 60229 61199 62377 62964<br />
Subsistence Fishing 4759 4281 4065 4205 4294 4364 4365 4019 4120 4160 4166 4192<br />
Total GDP, MP 43,203 42,658 43,307 46,941 49,363 51,252 52,227 58,791 64,349 65,358 66,543 67,156<br />
Growth rate -1.3 1.5 8.4 5.2 3.8 1.9 12.6 9.5 1.6 1.8 0.9<br />
Net factor income 36232 28172 20650 19239 30385 23918 43254 56579 47941 54071 66740 59915<br />
GNP 78295 76809 73437 77906 85259 76882 96906 112534 129757 117149 117149 117149<br />
Mid year population 73362 74404 75460 76532 77658 79056 80479 81927 83402 84955 86400 87869<br />
GDP / capita A$ 589 573 574 613 636 648 649 718 772 769 770 764<br />
GNP / capita A$ 1067 1032 973 1018 1098 973 1204 1374 1556 1379 1356 1333<br />
Source: Based on data provided by Statistics Office, MFED, 20 February 2004; Note: MP = market prices<br />
7
Since independence, economic growth has been relatively modest, and development<br />
has been uneven between South Tarawa and other islands, but the economy has been<br />
prudently managed. As shown in Figure 1.4, real GDP growth has averaged 1.4% per<br />
year since 1999 and is projected by the International Monetary Fund (IMF) to be 1%<br />
for the next several years; GDP per capita has thus been declining as population<br />
growth rates have exceeded GDP growth rates. A distinguishing feature of the<br />
economy is an external reserve fund, the Revenue Equalisation Reserve Fund (RERF)<br />
for keeping foreign reserves in overseas accounts prudently managed by international<br />
brokerage firms. Its value has steadily grown to the equivalent of seven years’ imports<br />
or nine times the value of GDP. Investment income is currently about a third of GDP.<br />
Because of the fund, Gross National Product (GNP) has been about 80% higher than<br />
GDP since 1995. Table 1-1 summarises some key economic statistics from 1991 –<br />
2002.<br />
Table 1-5 - Some Economic Indicators (1991 – 2002)<br />
1991 1992 1993 1994 1995 1996 1997 1998 1999 2000 2001 2002 6<br />
Price Index 1 83.6 86.9 92.2 97.1 100.6 100 100 101.9 105.6 107.5 114.3 118.4<br />
US$ / A$ 0.78 0.73 0.68 0.73 0.74 0.78 0.74 0.63 0.64 0.58 0.51 0.54<br />
Balance of payments 2 - 1.9 - 10.4 - 9.8 5.7 - 1.9 - 4.0 17.0 27.4 0.6 1.8 n/a n/a<br />
Total exports ($m) 3.7 6.5 4.5 7.1 10.3 6.8 8.4 9.3 14.1 10.7 n/a n/a<br />
Visitors to Tarawa 2446 3189 3385 2991 2919 3410 3763 3941 2906 2996 n/a n/a<br />
Fees from EEZ access (US$m) 3 31.4 30.6 46.4 n/a<br />
Value of reserve fund (A$m) 4 263 296 353 318 368 371 459 570 602 658 636 n/a<br />
Subsidy to PUB (A$ ‘000) 5 120 120 120 210 120 120 260 850 800<br />
Source: <strong>Kiribati</strong> Monetization in an Atoll Society: Managing Economic and Social Change (ADB, Dec. 2002) n/a = not available<br />
Notes: 1) Retail price changes (1996 = 100) 2) BOP in A$ millions 3) Access to <strong>Kiribati</strong> fish resource 4) Current price value of<br />
RERF<br />
5) For 2003 and 2004, subsidy estimated as $0.6m & $0.4m respectively 6) 2002 data through June only (except PUB subsidy)<br />
Only 20% of the labour force participates in the formal wage economy, which<br />
accounts for over 90% of GDP. Nearly 80% of paid employment is for the<br />
government or government owned enterprises with 64% of all cash jobs based in<br />
South Tarawa. South Tarawa is far more monetised than all other islands and has far<br />
better access to health, education transport, communications and other amenities and<br />
services.<br />
The non-formal traditional economy evens out some of these differences by<br />
redistributing monetary and other<br />
wealth along kinship lines although<br />
Table 1-6 - Real GDP in A$ millions (1991 prices)<br />
cash is increasingly important. 80<br />
Throughout <strong>Kiribati</strong>, the traditional<br />
economy remains important for food<br />
and general livelihood security. This is<br />
70<br />
60<br />
likely to continue for some years.<br />
50<br />
In the 1990s the labour force grew at 40<br />
4.6% per year, more than twice as fast 30<br />
as overall population growth. With the<br />
majority of the population aged twenty<br />
1991 1993 1995 1997 1999 2001 2003<br />
or below there is high youth Source: 1991-2002 MFED; 2003-2004 IMF projections<br />
unemployment and few new jobs.<br />
Practical policies are needed to address improvements in the livelihoods of the<br />
growing numbers of young I-<strong>Kiribati</strong> who will remain in the informal sector.<br />
8
1.5.1 Millennium Development Goals<br />
In September 2000, <strong>Kiribati</strong> was among 147 countries which adopted the Millennium<br />
Development Goals (MDGs), a set of development targets with quantifiable<br />
indicators, to assess development progress. In 2003, the ADB reported on the progress<br />
of Pacific Island Countries (PICs) toward meeting MDGs. For <strong>Kiribati</strong>, the ADB<br />
cautions that data (which are often unreliable) suggest that approximately 50% of the<br />
population fell below the national poverty line in 1996. Since then education<br />
indicators have improved, including gender equality in primary and secondary<br />
enrolment, although access to primary education remains a problem especially in the<br />
outer islands. The outer islands are also disadvantaged in terms of access to health<br />
services, other services and communications. The rise in population in South Tarawa<br />
is straining water and sanitation services. Health indicators are improving but child<br />
mortality remains high.<br />
The national development strategy (NDS 2004-2007) aims to address these<br />
challenges, and reach the MDGs, by emphasising six ‘Key Policy Areas’: 1)<br />
economic growth underpinned by increased investment and maintaining past policies<br />
of sound public financial management; 2) equitable distribution of the benefits of<br />
development, including upgrading outer island facilities and services; 3)<br />
implementing a performance monitoring system to improve efficiency of public<br />
enterprises (which still dominate the economy); 4) an expansion of realistic and<br />
practical training and health services; 5) sustainable use of physical resources; and 6)<br />
protecting and effectively using financial reserves at the national level and in villages.<br />
As shown in Table 1-7,<br />
<strong>Kiribati</strong> is signatory to the<br />
three Pacific regional<br />
trade and economic trade<br />
agreements, the most<br />
important of which are the<br />
Pacific Islands Trade Agreement (PICTA) and the Pacific Agreement on Closer<br />
Economic Relations (PACER; between PICTA signatories and Australia and New<br />
Zealand). The GoK has also signed the Cotonou Agreement, providing membership in<br />
the African Caribbean Pacific (ACP) group of countries, and thus access to further<br />
development assistance from the European Union.<br />
1.5.2 Investment and banking<br />
Table 1-7 - <strong>Kiribati</strong> and Regional Economic Treaties<br />
Status SPARTECA PACER PICTA<br />
Signed<br />
14 July1980 18 Aug 2001 18 Aug 2001<br />
Ratified<br />
10 July 1981 04 June 2003 04 June 2003<br />
Entered into force 09 Aug 1981 03 Oct 2002 13 April 2003<br />
Source: Communication from Pacific Islands Forum Secretariat (January 2004)<br />
The GoK has long encouraged private sector investment and diversification of the<br />
economy. Foreign investment is generally encouraged and no discrimination is shown<br />
between foreign and local investors. Investors who wish to establish an enterprise<br />
must make application to the Foreign Investment Commission (FIC) that is chaired by<br />
the Secretary for Commerce, Industry and Tourism. Granting of FIC licences is on a<br />
case by case basis under the following guidelines: 1) the potential employment of I-<br />
<strong>Kiribati</strong> (the indigenous population); 2) net export contribution; 3) the balance<br />
between local resource exploitation and the size of the foreign investment; 4) the<br />
potential for transferring to I-<strong>Kiribati</strong> foreign managerial and technical skills required<br />
in the enterprise; 5) the extent of competition with local enterprises; and 6) the impact<br />
on social and natural environments.<br />
The Development Bank of <strong>Kiribati</strong> (DBK) provides business loans to local citizens.<br />
There are flexible guidelines regarding guarantees, equity, security, the experience<br />
9
and qualifications of potential borrowers, and other factors but a flat interest rate of<br />
12% is charged. The sole commercial bank is the Bank of <strong>Kiribati</strong> (BoK), a joint<br />
venture with the Australia New Zealand Banking Corporation (ANZ), and is75%<br />
owned by ANZ. BoK provides secured loans at 8.5% interest and unsecured loans at<br />
10%. For small businesses, the BoK prefers co-borrowers; for loans to government<br />
owned enterprises, a government guarantee is required.<br />
Only two DBK loans (and no BoK loans) have been provided for the energy sector,<br />
both for the government-owned Solar Energy Company (SEC) for $20,000 in 1994 to<br />
purchase equipment and components for the subsequent manufacture of solar<br />
photovoltaics equipment and $16,000 in 1999 to assist with operational expenses.<br />
Both loans have been repaid.<br />
1.6 Institutional Context for Energy<br />
According to the government’s 2004 National Budget, the Ministry of Works and<br />
Utilities (MW&U; formerly the Ministry of Works and Energy or MWE) is<br />
responsible for an “energy outcome” whose goal is “meeting the energy needs of the<br />
community in a sustainable manner.” In addition, “the Ministry is to provide and<br />
maintain a resource centre that promotes the development of renewable energy<br />
resources and encourages energy efficiency.” MW&U has the following energy<br />
sector responsibilities, as stated in the ministry’s 1999-2001 Strategic Plan:<br />
• the Energy Planning Unit (EPU), responsible for coordinating the<br />
implementation of energy policies and providing necessary advice and<br />
assistance on all energy activities and energy-related matters;<br />
• the Public Utilities Board (PUB), a statutory authority responsible for<br />
provision of power, water supply and sewerage services for South Tarawa and<br />
the provision, operation and maintenance of all assets associated with service<br />
delivery;<br />
• the Solar Energy Company (SEC), an incorporated company majority owned<br />
by the ministry involved in renewable energy, particularly sale or lease of<br />
solar electric systems and relevant components;<br />
• the <strong>Kiribati</strong> Oil Company (KOIL), an incorporated company majority owned<br />
by the ministry involved in distribution of petroleum products.<br />
Figure 1-3 -Institutional Arrangements for Energy in <strong>Kiribati</strong><br />
Ministry of Commerce,<br />
Ministry of Works and Utilities<br />
Industry and Tourism<br />
Solar Energy<br />
Company<br />
(solar PV)<br />
Energy<br />
Planning Unit<br />
(policy and<br />
planning)<br />
Public<br />
Utilities Board *<br />
(electric power)<br />
10<br />
Fuel pricing<br />
* For Kiritmati, electric power is the responsibility of the Ministry of Line and Phoenix Islands.<br />
Ministry of Finance and<br />
Economic Development<br />
Aid coordination<br />
and capital investment
1.6.1 EPU<br />
The EPU has accepted somewhat broader responsibilities than those listed above,<br />
including responsibility for energy policy and planning, implementing a range of<br />
activities such as energy audits and energy use surveys, and monitoring the operations<br />
of PUB, SEC and KOIL. The EPU is headed by an Energy Planner who reports to the<br />
Permanent Secretary for Works and Utilities, and supervises an Assistant Energy<br />
Planner (a position currently vacant), an Energy Projects Engineer, an Assistant<br />
Project Engineer and three support staff. In recent years, the EPU’s operating budget<br />
has ranged from about $80,000-95,000 with personnel costs accounting for roughly<br />
half of the total.<br />
1.6.2 PUB<br />
The PUB has a board of 4-8 commissioners – currently seven – who are selected by a<br />
panel of three Ministers (chaired by the Works and Utilities Minister and also<br />
including the Ministers for Transport, Communications and Tourism; and Finance).<br />
PUB sets its own tariffs, although Cabinet can reject proposed changes. The PUB is<br />
responsible for electricity, water and sewage. There is a significant, although<br />
unquantified, cross-subsidy from electricity operations to water and sewerage that<br />
represents a long-standing financial drain on the PUB. That has recently led to<br />
consideration of separating electric power from water and sewerage services. The<br />
current chair of PUB is the MW&U’s Acting Chief Engineer. Although PUB remains<br />
strongly attached to the MW&U and its policies, it has become somewhat more<br />
autonomous since 1999, in part due to pressure from the ADB for increased<br />
accountability and more commercialised operations.<br />
1.6.3 SEC<br />
The SEC was established in 1984. Its board of five directors, also currently chaired by<br />
the Acting Chief Engineer of MW&U, is appointed by the Minister for MW&U. SEC<br />
has over 20 staff and is expected to expand during 2004 (as a result of a five fold<br />
increase in customers due to a large EU solar energy contribution) to a structure as<br />
shown in Figure 1.5. Despite a long history of MW&U/MWE interference, and<br />
sometimes indifferent management, SEC has been by far the most successful and<br />
longest surviving Pacific solar services company outside of the French Territories.<br />
Although the SEC has received no subsidies or grants from the GoK for some years,<br />
for 2004 it is seeking a grant or loan of $120,000 to ease cash-flow problems during<br />
the late implementation of the large EU project.<br />
The SEC Board and the ministry have also approved in principle a reorganisation,<br />
under which the SEC would be renamed the Rural Electrification Company (REC)<br />
with responsibilities broadened to include conventional as well as renewable energy<br />
development for the rural areas. Eventually it is expected to assume responsibility for<br />
diesel-based rural electrification, mostly at Island Council offices and a few larger<br />
government facilities, away from Tarawa within the Gilberts group of islands. To date<br />
there has been no actual shift it its activities reflecting this change, however.<br />
Expansion of operations to the Line group is contemplated but all capacity is currently<br />
directed toward development of solar based rural electrification in the Gilberts. By the<br />
end of 2005, approximately 2000 households, maneabas, schools and clinics will be<br />
electrified by solar under the management of the SEC. Estimates are that this<br />
represents about half the market for these services so additional funding for further<br />
11
development is expected to be sought even before the current EU project is<br />
completed. There are concerns that the SEC can successfully shift from a customer<br />
base of 350 homes on nearby islands to nearly 2000 installations spread throughout<br />
the Gilberts group. The EU programme specifically is engaged in capacity building<br />
and management advisory services to help prevent problems from arising due to this<br />
dramatic increase in operations.<br />
1.6.4 KOIL<br />
The KOIL Board of Directors is appointed by the Minister of MW&U. The current<br />
chairman is a former Permanent Secretary of Works and Energy and the current CEO<br />
is a former head of the Energy Planning Unit. On Tarawa, KOIL distributes petroleum<br />
fuels, which are supplied by Mobil Oil and stored in Mobil-owned bulk tanks. Supply<br />
to other islands in the Gilberts group is by 200 litre drums. On Kiritimati (Christmas<br />
island), KOIL owns the bulk storage facilities and is therefore not tied to Mobil as its<br />
sole supplier. BP is the supplier for aviation fuel products and contracts directly with<br />
aviation operators.<br />
Figure 1-4 - KOIL Storage on Betio, Tarawa<br />
Herb Wade<br />
1.6.5 Fuel price control<br />
KOIL distributes fuel at a government-controlled maximum wholesale price, which<br />
applies to petrol (benzine), kerosene and distillate. Prices are normally adjusted<br />
quarterly by KOIL, with the approval (although not actually required under law) of<br />
the Ministry of Commerce, Industry and Tourism (MCI&T). MCI&T also establishes<br />
maximum retail prices for petrol and kerosene, usually immediately after a wholesale<br />
price change. Tarawa prices also apply to all islands in the Gilberts group, with 75%<br />
of local transport costs to the islands met through government subsidies. The price in<br />
Kiritimati is reportedly 2-3¢/litre higher than Tarawa due to the much longer route for<br />
direct shipment from the Fiji supplier. Consideration has been given to supplying the<br />
Line Islands from relatively nearby Hawaii though there is no indication that this is<br />
likely to occur in the near future.<br />
1.6.6 Energy investments and aid<br />
The Ministry of Finance and Economic Development (MFED) is the Secretariat to the<br />
Development Coordinating Committee; it must approve any development projects<br />
which exceed $50,000 dollars. Although this is not specifically an energy sector<br />
responsibility, it means that MFED has considerable influence on energy investments.<br />
MFED is also a member of a PIREP coordinating committee and is expected to be the<br />
<strong>Kiribati</strong> focal point for the Pacific Islands Energy Policies and Strategic Action<br />
Planning project (PIEPSAP), a Danish-funded, UNDP-managed SOPAC operated<br />
project running for three years starting in late 2004.<br />
12
The Asian Development Bank has assessed 32 government-owned or majority-owned<br />
enterprises including PUB, KOIL and SEC which are 100% GoK owned. PUB and<br />
SEC are among those that ADB describes as obliged to undertake activities that are<br />
not commercially viable or have government-imposed restraints on pricing though<br />
thus far the SEC has not been called on to either change prices or engage in noncommercially<br />
viable activities. Financial accounts tend to be outdated and unreliable<br />
but the ADB has estimated the performance of the government-owned enterprises,<br />
summarised in Table 1-8. From 1994 through 2004, the ADB estimates that the GoK<br />
will have provided over $3.7 million in subsidies to the PUB (Table 1-5).<br />
Table 1-8 - Estimated Financial Performance of State-Owned Energy Enterprises<br />
Return<br />
Assets Equity ROR on<br />
Enterprise<br />
Year<br />
Equity<br />
13<br />
GoK Subsidy and<br />
Investment ($m)<br />
($m) ($m) (%) (%)<br />
2001 2002 est<br />
KOIL 6.6 5.1 17 22 1998 0.3 0.0<br />
PUB 7.6 6.0 0 0 1995 1.0 8.5<br />
SEC * 0.3 0.2 - 16 - 27 2000 0.0 0.0<br />
All 32 enterprises 240.5 130.6 8 41 2001 3.5 0.0<br />
Source: <strong>Kiribati</strong> Monetization in an Atoll Society: Managing Economic and Social Change (ADB, Dec. 2002)<br />
Notes: ROR = rate of return on total assets. Return on equity is after tax on total assets. * Excludes subsequent 4m<br />
euro grant<br />
1.6.7 Energy policy<br />
Various national energy policies have been developed and endorsed by the GoT<br />
(1983) or prepared in draft but largely ignored (1995). There is presently an Energy<br />
Policy Issues and Guidelines document (2002), which has not been endorsed by<br />
Cabinet and has no formal status. It contains broad goals and objectives, and<br />
strategies to meet them, but is an unprioritized mixture of proposed, current and<br />
outdated material. Although SEC may evolve into a broader rural electrification<br />
company, there is no a national rural electrification policy even in draft form.<br />
1.6.8 Energy Legislation<br />
There are several Acts of the <strong>Kiribati</strong> Parliament that deal directly with energy issues.<br />
These are:<br />
• The Public Utilities Act (CAP 83 of 1977; revised 1998) provides for “the<br />
exclusive right [by PUB] within any electricity supply area to generate,<br />
transform, transmit, distribute, supply and sell electricity and to electricity<br />
perform services incidental thereto.” The Minister may declare Minister may<br />
“declare any island or part of an island to be an electricity supply area.” The<br />
Act specifies that PUB is “free of all customs duty, import levy or any other<br />
tax” including income taxes.’<br />
• The Prices Ordinance (CAP 75 of 1976; revised 1981) provides for the<br />
Minister to make regulations regulating the retail prices of prescribed<br />
commodities. Currently the only petroleum fuels under retail price control are<br />
benzine and kerosene.<br />
• The Environment Act (Act 9 of 1999) “provides for the protection,<br />
improvement and conservation of the environment of the Republic of <strong>Kiribati</strong>”<br />
and came into effect from 21 March 2000. It is supplemented by Environment
Regulations 2001 (Environment Act; Section 53). The Environment Act is<br />
meant to reduce pollution (including any liquid, solid or gaseous substance or<br />
energy) …which may tend to be injurious to the environment or human health;<br />
too protect and conserve natural resources; and to comply with regional and<br />
international environmental conventions and obligations. The Act lists<br />
“prescribed developments” which require an initial environmental report<br />
(IER), an environmental impact assessment (EIA) and an Environmental<br />
Impact Statement (EIS) for any major project. There are mechanisms for<br />
public access to the reports and for public objections and appeals. Although<br />
there is little mention of energy, prescribed developments include oil<br />
refineries, petroleum product storage tanks, and (surprisingly as <strong>Kiribati</strong> has<br />
no hydroelectric resource) hydroelectric power.<br />
1.6.9 Inter-ministerial Energy Committees<br />
A PIREP coordinating committee, with membership from a number of ministries and<br />
chaired by the EPU, was established in 2003. By late February 2004 it had met twice<br />
and a third meeting was planned. There is also a <strong>Kiribati</strong> Energy Coordinating<br />
Committee chaired by the EPU and also comprising the CEOs or managers of PUB,<br />
SEC, KOIL. The committee is supposed to coordinate the activities and policies of the<br />
state-owned energy companies but is reportedly inactive.<br />
14
2.1 Energy Supply<br />
2 ENERGY<br />
<strong>Kiribati</strong> is highly dependent on imported refined petroleum fuels for electricity<br />
generation, for transport by land, sea and air and for cooking and lighting. It is likely<br />
that biomass provides around 25% of gross national energy production. It is used for<br />
household cooking and copra drying in rural areas. Solar energy is growing rapidly<br />
but accounts for well under 1% of the total. There is no hydropower resource.<br />
Petroleum accounts for about 75% of the total gross energy supply.<br />
2.1.1 Petroleum<br />
The most recent overall<br />
national energy sector<br />
assessment for <strong>Kiribati</strong> is<br />
the joint World Bank,<br />
UNDP, Forum and ADB’s<br />
Pacific Regional Energy<br />
Assessment (PREA, 1992)<br />
which predicted that<br />
petroleum fuel sales would<br />
grow at an average rate of<br />
4.5% per annum over the<br />
next decade, with distillate<br />
for electricity generation<br />
showing the most rapid<br />
growth at 5.5% annually.<br />
Actual growth for inland<br />
products has been slightly less at 3.9% per year (Table 2-1) but with a far different<br />
composition of the 10-year growth than predicted by the PREA analysis. However,<br />
Figure 2-1 shows that since 1997 the growth of imports of kerosene has been small,<br />
gasoline imports grew comparatively slowly while ADO growth was much greater,<br />
making the last five years of overall growth more in line with the PREA predicted<br />
rates.<br />
Table 2-1 - Inland <strong>Kiribati</strong> Petroleum Sales in 1990 and 2003<br />
Product<br />
1990 2003<br />
KL sold<br />
(Actual)<br />
Figure 2-1 -Petroleum Imports 1996-2003 (litres)<br />
Litres<br />
14,000,000<br />
12,000,000<br />
10,000,000<br />
8,000,000<br />
6,000,000<br />
4,000,000<br />
2,000,000<br />
-<br />
Source: KOIL (2004)<br />
1996 1997 1998 1999 2000 2001 2002 2003<br />
Year<br />
KL sold<br />
(PREA forecast)<br />
15<br />
KL sold<br />
(actual)<br />
1990 – 2003<br />
AAGR (% per year)<br />
Predicted<br />
(PREA)<br />
Actual<br />
Gasoline 2,358 3,463 4,917 3.0 % 5.8 %<br />
Kerosene 1,168 1,329 1,997 1.0 % 4.2 %<br />
Distillate (ADO) 6,227 12,490 9,105 5.5 % 3.0 %<br />
Total inland 9,753 17,282 16,019 4.5 % 3.9 %<br />
Sources: 1990 sales and 2003 forecast sales calculated from PREA data (Vol. 5, <strong>Kiribati</strong>; Aug. 1992). Actual sales from<br />
KOIL (Feb. 2004).<br />
Notes: 1) Gasoline is also called motor spirit, mogas and petrol.<br />
2) Ignores aviation fuel (which PREA expected to be static) as data were not obtained from BP<br />
The changes in petroleum use are largely due to migration from rural areas to Tarawa<br />
causing rapid transport and electricity use increases. As long as outer island<br />
electrification continues to be through renewable sources, the growth of the Tarawa<br />
population is likely to be the main driving force for increasing petroleum imports.<br />
ADO<br />
ULP<br />
DPK
Should, however, outer island electrification shift to a diesel focus, a very rapid<br />
increase in ADO imports can be expected.<br />
For Kiritimati Island, the PREA discounted <strong>Kiribati</strong>’s expectations of economic and<br />
population growth through migration, predicting a static demand for petroleum fuels.<br />
As shown in Table 2-2, growth has actually been dramatic, at 22% annually. Even<br />
ignoring aviation gasoline, fuel demand in Kiritimati has grown by 5% per year from<br />
1990–2003 – illustrating the difficulty of accurately forecasting future energy use for<br />
small islands, where economic opportunities can expand (or contract) rapidly.<br />
Table 2-2 – Kiritimati (Christmas Island) Petroleum Sales in 1990 and 2003<br />
Product<br />
1990 2003<br />
KL sold<br />
(Actual)<br />
KL sold<br />
(PREA forecast)<br />
16<br />
KL sold<br />
(actual)<br />
1990 – 2003<br />
AAGR (% per year)<br />
Predicted<br />
(PREA)<br />
Actual<br />
Gasoline 300 300 485 0.0 % 3.8 %<br />
Kerosene 150 150 652 0.0 % 12.0 %<br />
Distillate (ADO) 900 900 1,392 0.0 % 3.4 %<br />
Avgas 0 0 15,600 – –<br />
Total 1,350 1,350 18,129 0.0 % 22.1 %<br />
Sources: PREA Vol. 5, <strong>Kiribati</strong>, Aug. 1992. World Bank. The 1990 sales and 2003 forecast sales were calculated from<br />
PREA data. Actual sales are from KOIL (Feb. 2004).<br />
Notes: 1) Gasoline is also called motor spirit, mogas and petrol.<br />
2) Ignores aviation fuel (which PREA expected to be static) as data were not obtained from BP<br />
Figure 2-2 - Petroleum Fuels as percentage of Total Imports: 1982 - 2002<br />
From the early to mid<br />
1980s, there was<br />
concern in <strong>Kiribati</strong> 20<br />
regarding the high cost<br />
of petroleum fuels and<br />
the percentage of total<br />
15<br />
imports accounted for<br />
by petroleum. From<br />
10<br />
1982-1984, petroleum<br />
fuels accounted for<br />
5<br />
nearly 15% of all<br />
imports. Figure 2-2<br />
shows that petroleum<br />
0<br />
fuel imports as a<br />
percentage of total Source: MFED Statistics Office<br />
imports by value are considerably lower than those of the early 1980s.<br />
'82<br />
'84<br />
'86<br />
'88<br />
'90<br />
'92<br />
'94<br />
'96<br />
'98<br />
'00<br />
'02
Petroleum fuels are supplied to<br />
<strong>Kiribati</strong> by Mobil and BP.<br />
Except for Kiritimati (and<br />
sometimes other islands of the<br />
Line group), fuels are shipped to<br />
the outer islands in 200 litre<br />
drums and there are sometimes<br />
shortages due to irregular<br />
shipping. Kiritimati is 3500 km<br />
from Tarawa and is supplied<br />
directly from Fiji, over 5000 km<br />
distant. As the PREA noted over<br />
a decade ago, small quantities,<br />
long transportation routes, and<br />
transhipment result in landed<br />
costs of petroleum products in <strong>Kiribati</strong> above those of several neighbouring Pacific<br />
Island Countries (PICs). Recent wholesale prices of gasoline and ADO (excluding<br />
taxes and duties) are shown in Figure 2-3. Prices in Tarawa remain higher than<br />
average for the PICs. Prices in Kiritimati (not shown) are reportedly 2-3¢ per litre<br />
higher than Tarawa, due to the higher cost of shipment from Fiji.<br />
<strong>Kiribati</strong> is a relatively low per capita user of liquid petroleum gas (LPG) since almost<br />
all use is on Tarawa and even there kerosene is still the primary cooking fuel. LPG is<br />
distributed by KOIL (imported in bulk by an Australian company, Cowen and<br />
Russell) and by Tarawa Motors (marketed as Kirigas) with an estimated 40% of<br />
market share.<br />
Product Mobil BP Total<br />
2.1.2 Fuel storage<br />
On South Tarawa, Mobil has nearly 2.4<br />
million litres (ML) of storage facilities<br />
as shown in Table 2-3. BP has nearly<br />
1.0 ML. KOIL owns 2.6 ML of storage<br />
on Kiritimati sufficient for about four<br />
months of demand so the island is only<br />
Avgas 296 296<br />
Petrol 640 640<br />
Jet A1 135 591 726<br />
Kerosene 390 390<br />
Distillate 1,220 1,220<br />
Total 2,385 591 2,976<br />
Sources: Mobil from KOIL (provided in tonnes and<br />
supplied three or four times per year converted using data of Annex 2; BP from PREA)<br />
while deliveries are about monthly for Tarawa.<br />
2.1.3 Duties on petroleum fuels<br />
Under the Customs Schedule of 1993, all aircraft operating<br />
within <strong>Kiribati</strong> or international flights to or from <strong>Kiribati</strong><br />
are exempt from all customs duties and taxes. Since then,<br />
Cabinet has also exempted from duty all fuel used by PUB.<br />
Neither kerosene nor LPG, both used for cooking, attract<br />
duty. The only fuels currently subject to duty are benzine<br />
(petrol) and distillate, shown in Table 2-4.<br />
Figure 2-3 - PIC Wholesale Petroleum Fuel Prices<br />
(excluding import duties and taxes; August 2003)<br />
Source: Pacific Fuel Price Monitor, Edition 5 (PIFS; 12 Nov. 2003)<br />
17<br />
Table 2-3 - Tarawa Petroleum Storage (ML)<br />
Table 2-4 - Fuel Import Duty<br />
Fuel Early<br />
2003<br />
From<br />
Oct 2003<br />
Benzine 12 ¢/l 7 ¢/l<br />
Distillate 4 ¢/l 6 ¢/l<br />
Source: Price Control Office (Feb<br />
2004)
2.1.4 Biomass<br />
For all islands excepting Tarawa and Kiritimati, biomass is the primary fuel for<br />
cooking and copra drying. Most of the biomass used is in the form of coconut husks<br />
and shells though fuel wood is also commonly used (and on Banaba, is the primary<br />
source) though not in large enough quantities to present a danger to the resource base<br />
anywhere in <strong>Kiribati</strong> except on densely populated South Tarawa.<br />
Though there have been no comprehensive biomass fuel use surveys for all of<br />
<strong>Kiribati</strong>, small scale surveys indicate that there is no shortage of fuel and no danger of<br />
serious depletion of biomass resources for the foreseeable future except on much of<br />
South Tarawa where there has long been inadequate biomass fuel resources for the<br />
dense population.<br />
2.1.5 Electricity Supply<br />
The PUB is presently in the last stages of a large power development project funded<br />
by Japan. A new power plant, upgrading of existing power plants as well as expansion<br />
and upgrading of the distribution system are included in the project.<br />
All HV and LV distribution is underground except for a few old overhead lines being<br />
phased out. There is about 54 km of 11kV distribution, partially in a ring main<br />
configuration, constrained by the long narrow shape of the Tarawa atoll. With most of<br />
the load either in the Betio/Bairiki area or in the area between Bikenibeu and Bonriki<br />
Table 2-5 - Generation installed (Nov 2003)<br />
Station<br />
Unit<br />
Number<br />
Date of<br />
Mfg<br />
Manufacturer<br />
Running<br />
hours<br />
Voltage<br />
Capacity<br />
Rating Available<br />
1 1969 Blackstone 465,805 415 600 Off Line<br />
Bikenibeu<br />
2<br />
3<br />
1969<br />
2002<br />
Blackstone<br />
Daihatsu<br />
516.958<br />
8861<br />
415<br />
11kV<br />
600<br />
1,400<br />
450<br />
1,400<br />
4 2002 Daihatsu 8820 11kV 1,400 1,400<br />
6 1976<br />
English<br />
Electric<br />
30052 11kV 750 600<br />
Betio<br />
7 1976<br />
English<br />
Electric<br />
N/A 11kV 750 Off Line<br />
8 1988 Wartsila N/A 11kV 1,000 Of Line<br />
Total 6,500 3,850<br />
Source - JICA Design Study 2003 with data from PUB (as of end of November 2003)<br />
Notes: 1)At Betio, generators 1-5 and number 8 have now been retired and removed<br />
2) PUB is repairing Bikenibeu Number 1<br />
3) There is around 1.5MW of back up power systems at various government and commercial sites<br />
the two main power plants have been located in Betio and Bikenibeu. Unfortunately<br />
the relatively small cable between the two load areas is insufficient to allow full<br />
power interconnection between the power stations though that cable is scheduled for<br />
upgrading under the JICA project. A loss of power at the Betio power station usually<br />
results in a loss of power to Betio customers even though the system is interconnected<br />
with the Bikenibeu station. Since the Betio power station is much older and generally<br />
less reliable than the Bikenibeu station, the government and commercial facilities at<br />
Bairiki see poorer power reliability than those further east that can benefit from the<br />
more reliable Bikenibeu power station. The installation of a new 1.25 MW generator<br />
at the Betio station in 2004 should improve system reliability and ultimately the<br />
interconnection cable is to be increased in size to allow full capacity power transfer<br />
between stations.<br />
18
Electricity Pricing<br />
The connection fee is $30 plus from $2-$5 per meter over 30 meters from the<br />
connection point. The user must prepare the trench for the cable and provide all<br />
preparation for the connection.<br />
Tariffs were increased in September 2000 and May 2001 to keep up with changes in<br />
ADO prices. As of 2003, the tariffs were $0.37 per kWh for domestic customers and<br />
$0.47 per kWh for government and commercial customers, up about 10% over the<br />
2000 prices.<br />
2.2 Energy Demand<br />
2.2.1 Petroleum<br />
There are no readily accessible data to indicate the demand for petroleum products<br />
among various economic classifications such as government, commerce and industry,<br />
domestic households or transport. Jet fuel and aviation gasoline is obviously used for<br />
air transport and petrol for ground transport and outboard engine fuel.<br />
For all islands except Tarawa and Kiritimati, there are few uses of petroleum products<br />
other than by the island council for transport and electricity generation at the council<br />
offices. JICA has installed diesel powered freezers on some islands but most are not<br />
working. Outboard motor ownership is not high as most outer island fishing is done<br />
with traditional sailing canoes. There is virtually no ownership of private transport on<br />
outer islands other than small motorcycles. A few petrol or diesel portable generators<br />
are used by churches and at community meeting houses (maneabas). Kerosene is,<br />
however, the dominant lighting fuel and an increasing number of households are<br />
using kerosene for cooking.<br />
Household surveys indicate that of the outer island households that use kerosene for<br />
lighting, the median use is about one litre each week. Since pressure lamps use much<br />
more fuel than wick lanterns and lanterns use more than bottle wick lights, the amount<br />
used depends both on the number of lights in use and on whether they are bottle wick<br />
types, enclosed wick lantern type or pressure lamps. Cooking increases usage to an<br />
average of about two-thirds of a litre per day that varies according to family size and<br />
how much cooking is by kerosene and how much by biomass. Though the census did<br />
not include questions regarding the fuel used for cooking, small scale surveys indicate<br />
that at least 10-15% of outer island households use kerosene as their primary cooking<br />
fuel, up to about 30% use kerosene for part of their cooking and the rest uses biomass<br />
exclusively. LPG remains expensive for outer islanders and is little used though its<br />
use is expanding. For other fuels, demand by sector must be estimated, sometimes<br />
crudely. Direct use of fuel for business or commercial use is not separated in the data<br />
provided but is expected to be quite small in relation to other uses. Distillate used for<br />
electricity generation is estimated from the power sector data presented later in this<br />
section and it is assumed that distillate imported but not used for electricity generation<br />
is used for transport – though it is not possible to differentiate between land and<br />
marine transport use.<br />
2.2.2 Biomass<br />
In terms of overall energy use for <strong>Kiribati</strong>, biomass based energy production probably<br />
no longer exceeds that of petroleum. Its use is partly for cooking and partly for copra<br />
drying though the total amount used for either is not well documented. It is clear that<br />
19
the majority of biomass used is in the form of coconut husks and shells, usually<br />
burned together as residue from copra production. Demand for biomass is generally<br />
smaller than the supply resulting from copra production and much of the copra<br />
production waste is dumped, sometimes causing health problems as it can provide<br />
open rain water pools allowing the increase of mosquito populations.<br />
Biomass use for cooking on Banaba was surveyed by the EPU (2001) and it was<br />
found that most households using biomass as their primary fuel used a bag (about .5<br />
m 3 ) of biomass in five days. Unfortunately the weight of a bag was not recorded so<br />
estimating the calorific content is difficult. Based on similar surveys in other atoll<br />
countries and the size of the bag, about 5 kg of air dried biomass per day appears to be<br />
a reasonable estimate. That results in a daily energy production of about 70MJ per<br />
household per day for those households cooking exclusively with wood, probably<br />
equivalent to about 80% of all outer island homes in terms of fuel use. With rural<br />
households numbering around 6300, that means a total daily energy production of<br />
around 353GJ from 25.2 tonnes of biomass burned for cooking each day. An<br />
additional 100 GJ (7.1 tonnes per day) is estimated to be used for copra drying. In<br />
terms of oil equivalent, that represents about 10.7 tonnes of oil equivalent (toe) per<br />
day or around 3890 toe per year for <strong>Kiribati</strong>.<br />
2.2.3 Electricity on Tarawa<br />
In 2002, 15% of electricity demand was commercial, 30% domestic and 55%<br />
government. The demand is polarised with major demand centres at each end of South<br />
Tarawa. With demand largely by government, Betio and Bairiki with its concentration<br />
of government facilities and dense population has the largest concentration of<br />
electricity demand and is about four times that of the other load centre in the<br />
Bikenibeu to Bonriki area.<br />
JICA estimates only a 3% growth in Tarawa electricity demand (even though it has<br />
grown at an 8% rate since 1998) citing their expectation that migration to Tarawa is<br />
saturated, there are no large demand projects on the horizon and economic growth is<br />
modest. The team considers this as a low figure and suggests 4-5% growth as more<br />
likely for at least 10 years. For PIREP GHG calculations the team uses 4.5% as the<br />
AAGR for electrical growth from 2003-2013 on Tarawa.<br />
Table 2-6 - Electricity statistics 1998-2003<br />
1998 1999 2000 2002 2002 2003<br />
Generated (MWh) 11,440 12,814 14,482 15,134 13,979 15.9<br />
Peak (kW 2,060 2,200 2,695 2,857 2,550 3,093<br />
Capacity (kW) 2,750 3,250 3,200 3,150 4,350 3,900<br />
Domestic customers 3,500 3,500 3,500 3,500 3,500 3,650<br />
Government & Industrial 150 160 140 160 170 190<br />
Commercial 510 510 500 610 600 680<br />
Fuel (‘000 litres) 3,436 3,311 3,946 3,831 3,914 4,400<br />
Efficiency (kWh/litre) 3.33 3.87 3.67 3.95 3.57 3.60<br />
Source: EPU (2004)<br />
Based on available estimates, about 15.9 GWh was generated in 2003. Using an<br />
estimated fuel efficiency for generation of 3.6 kW/litre, that represents a use of<br />
around 4.4 ML of ADO.<br />
20
2.2.4 Electrification away from South Tarawa<br />
In 1992, Asian Development Bank consultants urged the PUB to accept a loan for an<br />
extension of power from Buota (near the airport) to Nabeina, a location about onethird<br />
way down the length of North Tarawa. The 9 km extension was promoted by<br />
ADB based on the New Zealand consultant’s assumption that population growth in<br />
that area would be large, particularly after completion of an Australian funded bridge<br />
connecting two major islets of North Tarawa together. That population growth has not<br />
occurred and at the time of the team visit, the PUB listed only 28 customers for the<br />
last six kilometres of the extension. The total average monthly energy use for all those<br />
customers is around 1200 kWh/month (46 kWh/month/meter), with all 28 customers<br />
totalling less energy use than that of one household in Niue.<br />
Although most of the outer islands have a small (2 to 5 kW) portable petrol or diesel<br />
genset supplying power for the island council office and a few government employee<br />
houses near to the office, outside Tarawa only Kiritimati Islands has a grid that serves<br />
the community at large. It is operated by the Public Works Department (PWD), not<br />
the PUB. A major hospital facility is being developed on Tabiteuea North that will<br />
have its own generation system but there are no plans to deliver power beyond the<br />
boundaries of the hospital complex.<br />
2.3 Future Growth in Energy Demand<br />
2.3.1 Petroleum<br />
Small economies such as that of <strong>Kiribati</strong>, especially those heavily reliant on a narrow<br />
range of exports and services, tend to have highly variable economic growth and<br />
energy use can change quickly and radically due to infrastructure development<br />
projects being undertaken. Therefore any prediction of energy growth is no more than<br />
an educated guess and should only be taken as an indication of what seems likely<br />
under a specific development scenario.<br />
In <strong>Kiribati</strong>, the primary use of petroleum is for electricity generation and inter-island<br />
shipping (all ADO uses). Transport on Tarawa is the primary use of petroleum. Both<br />
electricity generation and petroleum growth is therefore closely linked with Tarawa<br />
and to a lesser extent Kiritimati population growth and the growth of the money<br />
economy of the two atolls. In terms of growth percentages, the Kiritimati economy is<br />
expected to continue to grow rapidly as the island is far from fully developed. Tarawa<br />
economic growth is likely to be lower but in real terms much larger than Kiritimati, at<br />
least in the near term. In the long term, tourism development coupled with large scale<br />
migration made possible by its large land area, could permit Kiritimati to pass Tarawa<br />
in the size of its local economy and therefore in energy use.<br />
In its preparation for the South Tarawa power system upgrading project, JICA<br />
consultants forecast a 3% load increase for PUB based on the assumption that the high<br />
rate of migration to Tarawa will stop and economic development will be at a low rate<br />
for the future preventing the expansion of the appliance base in households and<br />
keeping government energy demand in check. The PIREP team does not agree with<br />
these assumptions and has used a rate of 4.5% for PUB load growth and associated<br />
ADO use growth for electricity generation.<br />
21
2.3.2 Electricity<br />
Electricity demand growth on Tarawa is estimated at 4.5% per year. This growth is<br />
partly expected to take place because of continued emigration to Tarawa and partly<br />
through increasing demand for household services due to increased household<br />
incomes as monetisation of the economy continues. There is a large potential for<br />
domestic demand growth since individual household use is typically less than 100<br />
kWh per month and an increased use of just refrigerators and freezers could easily<br />
double the average domestic electricity consumption.<br />
Electricity demand on Kiritimati is expected to grow much faster than on Tarawa<br />
largely through grid extensions adding customers and further development of<br />
electricity infrastructure. An increase in tourism could rapidly increase electricity<br />
demand due to development of hotels, resorts and other tourist facilities. Planning for<br />
energy development on Kiritimati should be immediately undertaken so the overall<br />
economic development of Kiritimati can proceed rapidly and smoothly.<br />
Outer island electricity needs are presently being met through the use of solar energy.<br />
Small grids with 2-10 connections exist around island council offices and stores or<br />
homes with small generators but represent a very small percentage of outer island<br />
electrification. However, as demand for electricity services grows, the SEC will need<br />
to be flexible enough to expand services based on individual household needs rather<br />
than sticking with the traditional “one size fits all” solar installation design. If the<br />
SEC cannot provide the services people desire and can pay for, the services will be<br />
developed through the purchase of inefficient petrol or diesel generators. With the<br />
acceptance by the SEC of all forms of electrification on the outer islands, the<br />
possibility of biofuel development for small grid electrification and the integration of<br />
solar into small multiple-dwelling grids could be developed and still retain the<br />
renewable energy focus of the SEC.<br />
Figure 2-4 - Maximum Demand and Fuel Use for Generation Trends 1987-2000<br />
Power (kW)<br />
3,500<br />
3,000<br />
2,500<br />
2,000<br />
1,500<br />
1,000<br />
500<br />
0<br />
1,200<br />
Source – EPU (2003)<br />
1,105<br />
1,280<br />
1340.0<br />
Maximum demand & Fuel used trends<br />
1361.0<br />
1550.0<br />
1454.0<br />
22<br />
1658.0 1621.0<br />
1714.5 1675.2<br />
1987 1988 1989 1990 1991 1992 1993 1994 1995 1996 1997 1998 1999 2000<br />
Year<br />
Max Demand (kW) Fuel used (kl)<br />
1973.1<br />
2060.0<br />
4,500<br />
4,000<br />
2,861.00<br />
3,500<br />
3,000<br />
2,500<br />
2,000<br />
1,500<br />
1,000<br />
500<br />
0<br />
Fuel used (kl)
2.4 GHG Inventory<br />
Assuming no significant new renewable energy development over the next decade,<br />
Table 2-7 indicates the forecast change in GHG emissions from 2003 to 2013. This<br />
forecast assumes that rural electrification will continue to be only through solar<br />
energy making the growth of fossil fuel use mostly a function of transport and<br />
electricity generation on Tarawa and Kiritimati Islands.<br />
Table 2.7 -Greenhouse gas production due to petroleum imports for 2003 and projections for 2013<br />
2003 2013<br />
Fuel KL T TOE<br />
23<br />
GHG<br />
(tonnes)<br />
Motor Spirit Gilberts 4,917 3,589 3,912 12,293 12.3 24.7% 3.5% 6,936 18.2 25.2%<br />
Motor Spirit Kiritimati 652 476 519 1,630 1.6 3.3% 5.0% 1,062 2.4 3.3%<br />
GHG<br />
(Gg)<br />
% of<br />
GHG<br />
Avgas (Kiritimati) 15.6 11 12 36 0.0% 15.6<br />
Kerosene Gilberts 1997 1,572 1,714 5,591 5.6 11.3% 3.0% 2,684 7.5 10.4%<br />
Kerosene Kiritimati 652.0 513.4 559.6 1,825.6 1.8 3.7% 4.0% 965 2.5 3.4%<br />
ADO Gilberts (transport) 4,705 3,954 4,270 12,704 12.7 25.6% 3.0% 6,323 17.1 23.6%<br />
ADO Gilberts (electricity) 4,400 3,697 3,993 11,880 11.9 23.9% 4.5% 6,833 18.4 25.5%<br />
ADO (Kiritimati) * 1,392 1,170 1,263 3,758 3.8 7.6% 5.5% 2,378 6.1 8.5%<br />
Total 18,731 14,972 16,231 49,682 49.7 100.0% 3.8% 27,197 72.2 100.0%<br />
Sources: KOIL, EPU, PUB * Estimated to be half electricity and half transport<br />
Large scale renewable energy implementation that is within the realm of possibility,<br />
provided necessary barrier reductions take place and the government aggressively<br />
supports investment in renewable energy development, can be expected to lower the<br />
rate of growth of GHG production through the addition of solar energy, biofuels and<br />
possibly wind energy to replace fossil fuel use on Tarawa and Kiritimati Islands over<br />
the next decade.<br />
As noted elsewhere, solar energy and wind energy (if found to be practical in <strong>Kiribati</strong>)<br />
can at most together be expected to provide about 15% of the 2013 level of electricity<br />
generation.<br />
With investment in replanting, development of biofuel processing facilities and<br />
conversion of power plant engines, the remaining 85% of fuel for electricity<br />
generation can be converted to biofuels if sufficient biofuel capacity is developed on<br />
Tarawa and Kiritimati Islands to handle projected electricity load increases to 2013.<br />
Conversion of the electricity generation system to biofuels will be less costly and<br />
more straightforward than conversion of transport to biofuels and is expected to take<br />
place first. Biofuels are not likely to impact significantly on marine or land transport<br />
over the next decade since it is very unlikely that sufficient biofuel production<br />
capacity can be developed over that period to provide for both electricity and<br />
transport use.<br />
Energy efficiency measures for electricity use could save 10% of the volume of fuel<br />
used for electricity generation in 2013, that is 10% of 8022 KL = 802 KL. This is less<br />
than some other PICs as per capita household use is already low and new JICA<br />
generation and distribution investments mean supply losses will be low. However, if<br />
100% of all ADO for electricity is displaced by biofuels, solar and wind, then the<br />
savings to <strong>Kiribati</strong> would be in fuel only, with no additional GHG savings. Energy<br />
AAG<br />
R<br />
KL<br />
GHG<br />
(Gg)<br />
% of<br />
GHG
efficiency measures for transport could save 5% of the 2013 ground transport fuel use<br />
or 0.05 x 15,510 KL = 776 KL, all of which would reduce GHGs. It is assumed there<br />
would be no efficiency savings in marine or air transport.<br />
Therefore with sufficient reduction of applicable barriers, the expanded use of solar<br />
PV and biofuels could offset approximately 34% of the projected 2013 GHG<br />
emissions. Energy efficiency efforts could reduce emissions by an additional 3% of<br />
the 2013 fuel use. Table 2-8 summarises the likely maximum potential GHG<br />
reductions from renewable energy and energy efficiency by 2013.<br />
Resource or<br />
technology<br />
Table 2.8 - Indicative Maximum Fuel Savings & GHG Reductions, 2013<br />
Potential<br />
fuel savings<br />
Potential CO2<br />
savings<br />
(Gg / year)<br />
24<br />
% of total<br />
savings<br />
Comments<br />
Biofuel 7829 KL 20.8 78 % 85% of ADO used for electricity<br />
Solar and wind 1382 KL 3.7 14 % 15% of ADO used for electricity<br />
Energy efficiency<br />
Electricity<br />
Transport<br />
802 KL<br />
776 KL<br />
0<br />
2.0<br />
0 %<br />
8 %<br />
Total 26.5 100 %<br />
Source: mission estimates<br />
10% of ADO for electricity<br />
5% of ground transport fuel
3.1 Solar<br />
3.1.1 Solar photovoltaics<br />
3 RENEWABLE E NERGY<br />
The solar resource on Tarawa was measured for many years at the meteorological<br />
station in Betio. Data for six years is summarised in Table 3-1. Also, JICA installed<br />
an automated weather station on North Tarawa that included horizontal and diffuse<br />
solar energy measuring devices. There is reason to believe that good quality solar<br />
radiation data is also available for Kiritimati atoll but it was not available from<br />
Tarawa sources.<br />
Table 3-1 - Solar Radiation Measurements – Horizontal Surface 1981-1986<br />
Jan Feb Mar Apr May Jun Jul Aug Sep Oct Nov Dec Year<br />
1981 5.15 5.43 4.96 5.00 5.67 5.57 6.20 6.81 6.96 6.74 8.44 5.55 6.04<br />
1982 6.43 5.84 6.80 5.38 5.80 0.00 4.34 5.01 7.21 5.55 5.86 5.90 5.34<br />
1983 5.55 5.90 6.08 6.01 4.32 0.00 5.05 5.61 6.05 6.01 5.70 5.42 5.14<br />
1984 5.63 5.57 6.08 5.75 5.40 4.91 4.77 5.35 5.86 5.82 5.50 5.54 5.51<br />
1985 5.40 5.86 5.61 5.72 5.44 5.37 5.74 5.79 5.75 5.82 5.64 4.74 5.57<br />
1986 5.40 6.00 6.30 6.06 5.50 5.27 6.78 5.48 5.17 6.41 4.50 4.28 5.60<br />
Avg. 5.59 5.77 5.97 5.65 5.35 5.27 5.48 5.67 6.17 6.06 5.94 5.24 5.53<br />
Source – <strong>Kiribati</strong> Meteorological Service (1992)<br />
Since atoll islands do not significantly modify the surrounding oceanic climate, the<br />
NASA satellite data can be expected to also be useful, particularly in providing data<br />
for the outer islands. The Tarawa data from NASA is summarised in Table 3-2. The<br />
data labelled “Tilted” is the value computed as what would be the solar radiation on a<br />
surface tilted at the optimum angle for energy reception. This value is indicative only<br />
since this is a computed value, not an actual measurement.<br />
Table 3-2 - Solar Radiation values for Tarawa<br />
Jan Feb Mar Apr May Jun Jul Aug Sep Oct Nov Dec Year<br />
Horiz. 4.84 5.29 5.41 5.45 5.15 5.03 5.24 5.61 5.83 5.84 5.21 4.83 5.31<br />
Tilted 5.49 5.68 5.42 5.44 5.38 5.57 5.54 5.72 5.67 6.17 5.85 5.54 5.61<br />
Source – NASA - http://eosweb.larc.nasa.gov<br />
The solar resource tends to be lower in the north and increase toward the south. In the<br />
northernmost island of the Gilberts, Makin, the NASA data shows the following:<br />
Table 3-3 - Solar Radiation values for Makin<br />
Jan Feb Mar Apr May Jun Jul Aug Sep Oct Nov Dec Year<br />
Horiz. 4.83 5.34 5.43 5.48 5.11 4.98 5.14 5.52 5.56 5.54 4.98 4.73 5.22<br />
Tilted 5.52 5.77 5.46 5.45 5.28 5.25 5.42 5.59 5.41 5.85 5.61 5.48 5.51<br />
Source – NASA - http://eosweb.larc.nasa.gov<br />
And for the southernmost island of the Gilberts, Arorae, the data is almost 15% higher<br />
than for Makin:<br />
Table 3-4 - Solar Radiation values for Arorae<br />
Jan Feb Mar Apr May Jun Jul Aug Sep Oct Nov Dec Year<br />
Horiz. 5.65 5.93 6.21 5.87 5.91 5.78 5.82 6.65 6.83 6.74 6.25 5.57 6.05<br />
Tilted 6.04 6.11 6.10 6.09 6.49 6.54 6.50 6.65 6.58 6.85 6.64 6.02 6.39<br />
Source – NASA - http://eosweb.larc.nasa.gov<br />
25
Kiritimati Island also has a very good solar radiation environment:<br />
Table 3-5 - Solar Radiation values for Kiritimati Island<br />
Jan Feb Mar Apr May Jun Jul Aug Sep Oct Nov Dec Year<br />
Horiz. 5.16 5.73 5.46 5.54 5.38 5.32 5.62 6.04 6.14 5.96 5.51 5.22 5.59<br />
Tilted 5.85 6.20 5.47 5.53 5.62 5.70 5.98 6.18 5.96 6.29 6.21 6.04 5.92<br />
Source – NASA - http://eosweb.larc.nasa.gov<br />
Since solar designs need to be based on the lowest level of solar energy over the year<br />
to ensure reliable power the year around, the fact that <strong>Kiribati</strong> has only a small<br />
variation from month to month allows an efficient solar design with little power<br />
wasted in the higher insolation months and a low probability of power outage during<br />
the lower insolation months.<br />
There is a large potential for household electrification by solar photovoltaics on the<br />
outer islands. A lesser but still important use is for the pumping of ground water for<br />
village water supply. Over the past 20 years most of the outer islands have received at<br />
least one solar pump for village water supply.<br />
3.1.2 Solar thermal<br />
A few solar water heaters have been installed in <strong>Kiribati</strong> on Tarawa but have not<br />
worked well. This is because the piped water supply is from wells with high mineral<br />
(calcium carbonate) content. When the water is heated in the solar collector, the<br />
mineral is deposited on the inside of the solar collector tubing rapidly reducing the<br />
efficiency of the units and ultimately causing the unit to become clogged with scale. If<br />
solar water heaters are to be used in <strong>Kiribati</strong> it is important that ground water not be<br />
used for the water supply to the heaters, only rain water. If rain water is used, they can<br />
be expected to have a long life and perform well in the high insolation environment of<br />
<strong>Kiribati</strong>.<br />
3.2 Biomass<br />
3.2.1 Biomass<br />
Part of the waste from copra production is used for cooking and copra drying but<br />
much is left in waste piles. Also senile coconut trees can be harvested for fuel when a<br />
replanting is underway. So in theory, at least, there appears to be sufficient waste to<br />
fuel a small steam power or gasification system for electricity generation. A steam<br />
power installation at a coconut plantation in Fiji uses copra cutting waste and wood<br />
from cut coconut trees to provide electrical power for the plantation and a small<br />
village. Steam heat from the boiler is also used for drying copra. However, the<br />
technology is not simple and boiler operation requires constant professional attention<br />
if operation is to be reliable and safe. A 1980s trial in a Fijian village situation using a<br />
smaller scale of the technology failed. Recently there have been commercial trials of a<br />
self-contained coconut shell gasifier/engine generator unit that also in theory could<br />
provide electrical power from copra cutting waste but the unit has not been tested for<br />
the difficult <strong>Kiribati</strong> outer island environment.<br />
3.2.2 Biofuel<br />
Most of the land area in <strong>Kiribati</strong> is classed as coconut forests and the coconut is by far<br />
the largest tree resource. The 26,000 ha of coconut trees in <strong>Kiribati</strong> appears to be<br />
sufficient to produce enough biofuel to replace all imported diesel fuel and the new<br />
coconut mill has a production capacity of about 700 tonnes per month, an amount<br />
26
sufficient to offset most if not all of the diesel fuel used for electricity generation.<br />
Actual production for 2004 is estimated to be around 2700 tonnes of oil, enough to<br />
offset over half the diesel fuel used for power generation on South Tarawa. The<br />
problem is working out a process whereby the biofuel is comparable in cost to diesel<br />
fuel. Currently the market price is about $650 per tonne CIF the receiving port. With<br />
$120 per tonne the cost of shipping, the effective Tarawa FOB price is about $520 per<br />
tonne for raw oil. Therefore after processing into biofuel, the cost would only be<br />
marginally higher than diesel fuel at mid-2004 prices and with petroleum prices likely<br />
to go higher in the future, the economics of biofuel look reasonably good for <strong>Kiribati</strong>.<br />
The labour costs on the outer islands are relatively low but the tree resource has not<br />
been generally well maintained in recent years so productivity is not optimum.<br />
Favourable conditions also exist for production of coconut oil on the outer islands as a<br />
fuel in direct competition with diesel fuel though considerable investment would be<br />
necessary. With the current very small demand for diesel fuel on the outer islands,<br />
that is not likely to be an option for the near-term.<br />
Table 3-6 - <strong>Kiribati</strong> Copra Production by Island 1990-2003<br />
Gilbert Islands<br />
27<br />
Metric Tonnes<br />
1990 1991 1992 1993 1994 1995 1996 1997 1998 1999 2000 2001 2002 2003<br />
Makin 253 255 328 153 247 396 271 321 277 234 92 287 220 247<br />
Butaritari 174 303 197 202 187 330 124 146 237 257 52 248 80 79<br />
Marakei 284 543 355 434 387 496 351 229 374 373 148 470 341 250<br />
Abaiang 78 493 609 288 341 507 218 87 458 311 7 256 287 146<br />
Tarawa 25 241 254 168 88 189 104 9 180 103 N/A 70 88 141<br />
Maiana 187 563 514 441 654 738 557 240 568 510 82 378 327 319<br />
Kuria 250 480 670 663 603 662 504 267 477 564 135 278 241 296<br />
Aranuka 159 298 409 491 361 405 297 175 406 393 97 200 181 266<br />
Abemama 618 970 1423 954 1613 1324 1141 636 1195 1391 218 854 760 792<br />
Nonouti 376 688 1067 922 1082 909 775 302 1178 1129 82 319 417 441<br />
Tabiteuea 621 916 1383 1540 1473 1200 1177 418 1489 1716 424 568 448 856<br />
Onotoa 151 343 369 516 491 363 405 146 544 551 113 161 128 265<br />
Beru 324 394 459 580 687 616 530 291 570 712 187 347 244 375<br />
Nikunau 414 722 572 764 728 790 724 375 855 902 205 593 414 441<br />
Tamana 123 325 301 383 372 268 221 105 456 258 98 104 134 250<br />
Arorae 29 307 278 354 636 183 288 52 543 480 42 72 188 215<br />
Gilberts Total 4066 7841 9188 8853 9950 9376 7687 3799 9807 9884 1982 5205 4498 5379<br />
Line Islands<br />
Kiritimati 618 161 322 885 1790 865 574 562 439 688 1447 886 373 299<br />
Tabuaeran 318 104 170 202 156 72 121 76 70 150 125 100 64 89<br />
Teeraina 601 555 331 343 320 491 939 728 897 1038 772 980 811 425<br />
Orona 47 49 13<br />
Lines Total 1537 820 823 1430 2266 1428 1634 1366 1406 1876 2344 2013 1297 826<br />
TOTAL 5603 8661 10011 10283 12216 10804 9321 5165 11213 11760 4326 7218 5795 6205<br />
Source: EPU (2004)<br />
With the stated priority of government being outer island development, the<br />
substitution of coconut oil for diesel fuel appears to be not only a way to reduce the<br />
import of fossil fuels but also a means to increase, possibly dramatically, the
economic conditions on outer islands. Therefore, it is recommended that there be a<br />
careful examination of the options and conditions for the development of coconut oil<br />
as a replacement for diesel fuel. This will need to consider 1) the logistics of coconut<br />
oil production and the relative cost of small oil extraction on each of the outer islands<br />
vs. large scale extraction on Tarawa; 2) the advantages and disadvantages of various<br />
types of biofuel (pure oil, chemically modified oil, oil blended with diesel fuel, etc.)<br />
in the <strong>Kiribati</strong> context; 3) the efficient use of all resources including biomass waste<br />
from larger scale copra production; and 4) the non-financial advantages to <strong>Kiribati</strong> in<br />
the form of security from foreign oil supply problems and price fluctuations, lowered<br />
foreign exchange requirements and greater transfer of money to the outer islands.<br />
The 2003 opening of the coconut oil mill on Tarawa with its approximately 700<br />
tonnes per month oil production capacity indicates a continuing commitment by<br />
government to copra production and an incentive for the outer islands to improve their<br />
copra production capacity. The plant could, if operated at capacity, provide almost all<br />
of the fuel requirements for diesel engines in <strong>Kiribati</strong>.<br />
3.2.3 Biogas<br />
On most of the islands of <strong>Kiribati</strong>, pigs remain free ranging. There is some potential<br />
for biogas generation if community pigs could be kept penned in a small area that is<br />
associated with a biogas digester to both produce gas and reduce the waste disposal<br />
problem. However, to be useful for energy it would be necessary to include<br />
equipment for gas compression and storage with either piping to nearby houses or<br />
additional compression into pressure cylinders of the same type as is used for<br />
liquefied petroleum gas.<br />
3.3 Wind<br />
Wind power has been used for water pumping but those systems have all fallen into<br />
disrepair and are no longer used. Solar powered pumping has been accepted as the<br />
standard pumping technology by the PWD for outer island water supply.<br />
There are unconfirmed reports from the EPU that the National Oceanographic and<br />
Atmospheric Administration (NOAA) of the USA have extensive data (logged every<br />
30 minutes for some years) on wind speeds at Kiritimati Island. These reportedly<br />
suggest an average wind speed of 6.0 metres per second, relatively consistent<br />
throughout the year. However the data could not be located in Tarawa.<br />
The Tarawa wind data indicates a variable and seasonal wind resource with an annual<br />
average velocity too low for economic energy production. However the<br />
meteorological station on Betio does not have as its mandate the determination of the<br />
energy content of the wind and it is likely that a carefully designed wind resource<br />
survey would find significantly higher energies than are indicated by the<br />
meteorological service measurements. But until such resource surveys are carried out,<br />
it is not reasonable to propose wind power for Tarawa.<br />
3.4 Ocean Energy<br />
3.4.1 OTEC<br />
Though there have not been specific surveys of the OTEC resource in <strong>Kiribati</strong>, the<br />
resource is definitely available and probably large. In particular, the atolls with a<br />
shallow lagoon have a water temperature several degrees higher than the surface<br />
28
temperature of the open ocean. If the warm water intake were from the lagoon and the<br />
cold water from deep in the open ocean, improved thermal efficiency for the<br />
conversion process could be obtained. However the technology is not even close to<br />
commercial application for <strong>Kiribati</strong> and is not considered as a practical approach for<br />
power production at this time.<br />
Hawaii based OTEC expert, Dr. Luis Vega, notes that "Technical and economic<br />
studies as well as experimental work have been conducted by numerous private and<br />
public entities in France, Japan and the USA. It was concluded that, for example, in<br />
Hawaii electricity production with OTEC technology is cost effective for 50 MW or<br />
larger plants. This conclusion is independent of the type of OTEC power cycle (i.e.<br />
Open, Closed, Kalina or Uehara) utilized. Moreover, it was concluded that<br />
commercialisation ought to be preceded by the design, installation and operation of a<br />
pre-commercial plant sized at about 2 to 5 MW…The situation in some Pacific Island<br />
Nations is such that smaller OTEC plants (e.g., 1 to 10 MW) configured to produce<br />
desalinated water in addition to electricity could be cost effective. However, because<br />
the technology is presently not commercialised, proposed installations in independent<br />
island states must be implemented without any financial responsibility assumed by<br />
their governments. 1 ”<br />
3.4.2 Wave Energy<br />
Although there is known to<br />
be a moderate wave energy<br />
resource in <strong>Kiribati</strong> as based<br />
on several years of wave<br />
energy measurements funded<br />
by the Norwegian Agency for<br />
International Development<br />
(NORAD) and carried out by<br />
OCEANOR during 1987 to<br />
1995 for SOPAC 2 , there is no<br />
commercially available, cost<br />
effective energy conversion<br />
equipment available for<br />
installation. A number of<br />
companies and laboratories<br />
are experimenting with<br />
different technologies to<br />
convert wave energy to<br />
electrical energy but none are<br />
past the trial stage. One<br />
advantage that <strong>Kiribati</strong> has<br />
for wave energy is an absence<br />
Figure 3-1 - Satellite measurements of wave energy for <strong>Kiribati</strong><br />
Scanned from Barstow, Stephen & Falnes, Johannes, 1996 Ocean Wave<br />
Energy in the South Pacific: The Resource and its Utilisation (prepared for<br />
SOPAC & the Government of Norway). The numerical data are Geosat satellite<br />
altimeter calculations. Both show estimated annual average wave power in<br />
kW/m of wavefront.<br />
of the typhoons and major oceanic storms that can cause damage to or destroy wave<br />
energy systems.<br />
1<br />
Vega, Luis "Ocean Thermal Energy Conversion Primer" Marine Technology Society Journal, Vol. 36, No. 4, pp 25-35,<br />
Winter 2002/2003<br />
2 Barstow, S.F. and Haug, O., The Wave Climate of Tuvalu, SOPAC Tech. Report no. 203 1994<br />
29
Due to the large surface area of the Pacific that includes <strong>Kiribati</strong> islands, the<br />
wave resource can be expected to vary considerably from boundary to<br />
boundary of the country. Therefore when wave energy conversion equipment<br />
becomes commercially available a more thorough wave resource inventory for<br />
all islands will need to be carried out to set priorities for investment in wave<br />
energy conversion for electrification.<br />
3.4.3 Tidal energy<br />
Although there is a significant flow of tidal waters through lagoon channels during<br />
tide change periods, its intermittent nature and the small tidal range in <strong>Kiribati</strong> does<br />
not allow cost effective development of tidal energy.<br />
3.5 Geothermal<br />
There is no known geothermal potential in <strong>Kiribati</strong>.<br />
3.6 Hydro<br />
There is no hydro potential in <strong>Kiribati</strong>.<br />
30
4 RENEWABLE E NERGY E XPERIENCE<br />
Except for mechanical power from multi-bladed windmills for water pumping, there<br />
has been virtually no experience with renewable energy for electricity generation<br />
other than solar photovoltaics. Solar water heating also has been used on a few homes<br />
and visitor facilities but there is no expectation of significant market demand for the<br />
technology for the foreseeable future.<br />
Biomass remains an almost universal source of thermal energy for copra drying and<br />
cooking at a low technology level that needs no documentation of the experience. The<br />
source is largely coconut fronds, husks and shells though some firewood is used,<br />
especially for cooking. There does not appear to be any problem with collection of<br />
sufficient biomass for these traditional purposes. Environmental effects of the use of<br />
this resource do not seem large though there have been reports of reduction in the<br />
mangrove forest areas near villages due to firewood collection.<br />
4.1 Solar Photovoltaic Experience<br />
Although solar photovoltaics have been used to provide remote power for<br />
communications equipment and water pumping since the late 1970s, until the<br />
formation of the Solar Energy Company (SEC) in 1984, the total installed capacity in<br />
<strong>Kiribati</strong> was less than 1 kWp.<br />
From 1984 to 1992, most of the solar PV<br />
installations used equipment sold by the Table 4-1 - North Tarawa School Solar Pump<br />
SEC though funding sources varied from<br />
private sales to multilateral donor<br />
projects. Except for PWD installed water<br />
pumps, most installation was also done<br />
by the company.<br />
4.1.1 Solar Pumping<br />
About 1993, ten Southern Cross positive<br />
displacement pumps were installed for<br />
village water supply under SPC funding<br />
in the Gilbert Islands. All those pumps<br />
failed within a few years and are being<br />
replaced as funds become available by<br />
less complex centrifugal pumps. Early<br />
failures were mainly attributed to failures<br />
of the associated electronic package that<br />
provided the high starting current needed<br />
by the pump. The manufacturer refused<br />
Herb Wade<br />
to provide circuit diagrams and other<br />
repair information, requiring that the units be sent back to Australia for service, an<br />
expensive and time consuming process that seriously reduced the average time of<br />
pump operation. The electronic package had as its purpose the delivery of a short<br />
pulse of high power for starting the pump to rotate. Once started, the pump would run<br />
as long as the sun was shining brightly on the panels.<br />
After the electronics failed, the pump would not start automatically, but if started by<br />
hand it would continue to rotate, so some villages posted a person at the pump all day<br />
31
to manually start the pump early in the morning and after passage of a cloud. Panels<br />
were also added to some systems to increase the current available for starting.<br />
Unfortunately, as the pumps aged, they became harder and harder to start and<br />
ultimately would not run even if manually started.<br />
In 1995, UNDP funded village water supply pumps for Miana (2), Aranuka (1),<br />
Nonouti (2), Tabiteuea South (2), Beru (1) and Arorae (1). The systems included a<br />
Mono brand positive displacement pump, a storage tank and 550 Wp of panel<br />
capacity per pump. All the pumps failed within five years. Based on the uniformly<br />
poor performance of the positive displacement pumps, the PWD is replacing them<br />
with Dankoff brand centrifugal pumps that have a low starting current and no<br />
requirement for an electronic interface. Those installations have thus far performed<br />
well.<br />
As rehabilitation takes place, other water system design changes, such as increasing<br />
the delivery pipe size, are also being incorporated based on analysis of the problems<br />
found in the earlier failed projects.<br />
4.1.1 Solar Clinic Electrification<br />
In 1994, Canada Aid funded 18 clinic installations for the Gilbert Islands. Each<br />
installation consisted of two separate systems. One just for the solar vaccine<br />
refrigerator (24V Sun Frost refrigerator and 282 Wp of panel capacity except on<br />
Makin and Butaritari where the more cloudy climate required 376Wp of panel) and a<br />
second system (12V 110Wp) for lights and communications radio. The installations<br />
were made by the SEC and the SEC provides maintenance under contract to the<br />
Department of Health. The most significant problem has been the mechanical<br />
thermostat used on the refrigerators that fails after a few years due to corrosion.<br />
One reason for success appears to be the highly efficient Sun Frost refrigerator that<br />
has a small storage capacity, entirely sufficient for the small island vaccine storage<br />
needs but not large enough for staff to be tempted to use the refrigerator for food<br />
storage that might overload the PV system.<br />
4.1.2 School, government and maneaba electrification<br />
Several church sponsored and some public primary schools have been electrified by<br />
solar PV. Although most use the PV for lighting and water pumping, a Catholic<br />
school on North Tarawa has installed sufficient solar capacity with inverters to<br />
operate AC type freezers as well as office machines and lights. A church school on<br />
Abemama has used PV for water pumping and lighting since the early 1980s.<br />
Nearly 15kWp of solar capacity, almost all for lighting, has been installed for<br />
government offices, maneaba lighting, school electrification and business use. The<br />
systems are typically maintained by SEC technicians for a fixed monthly fee.<br />
4.1.3 Telecom<br />
The TSKL has installed and maintains at least one PV powered public phone on most<br />
of the islands within VHF radio range of Tarawa. The units allow direct dialling to all<br />
islands having a dial-up capability through Tarawa. The quality of installation and<br />
maintenance of the systems on the outer islands has been only fair and system<br />
reliability has been an issue. With SEC agents now available on all islands of the<br />
Gilberts, TSKL should consider contracting with the SEC for maintenance and<br />
installation support.<br />
32
Approximately 5 kWp of solar panels are estimated to be installed on outer islands for<br />
telephone operation and another 5kWp installed at the TSKL earth station in<br />
Kiritimati. Plans are in place for multiple earth stations serving groups of islands<br />
interconnected by microwave or VHF links. All will all be solar powered and will<br />
greatly increase the solar capacity installed by TSKL.<br />
4.1.4 Street Lighting<br />
Four street lights on North Tarawa and 40 on South Tarawa (for the Betio-Bairiki<br />
causeway) were installed in 1999 and have performed well. The Pecan brand units<br />
utilise a sealed battery that is installed in an underground box to provide a cool, dry<br />
environment for long battery life. Power to operate the single high efficiency 20W<br />
tube light is provided by 80 Wp of panel capacity.<br />
4.1.5 Private sales<br />
By 1990, the SEC as a sales Figure 4-1 - Marakei telecom installation (note the surface dirt)<br />
organisation had sold<br />
approximately 275 PV<br />
systems to outer island<br />
customers representing<br />
around 14 kWp of solar<br />
capacity.<br />
After 1990, although<br />
reorganised as a solar<br />
utility, the SEC also sold<br />
PV systems to more than<br />
300 households on the<br />
outer islands totalling about<br />
20kWp of panel capacity. Herb Wade<br />
By the late 1990s, there were enough private installations and installations at schools<br />
and clinics for contract maintenance to allow the SEC to train and station maintenance<br />
agents on all islands of the Gilberts except Banaba.<br />
There has been no specific programme by the SEC to extend the solar utility to the<br />
Line and Phoenix Islands because of the problems of logistics and the small market.<br />
However, there are both government and private solar PV installations already in<br />
place and future electrification of households in the Line and Phoenix group under the<br />
SEC is planned. However, the rapid development of tourism in the Line Islands<br />
makes it of some urgency to commence development of rural electrification by the<br />
SEC.<br />
4.1.6 Solar Energy Company experience<br />
Solar System Sales Organisation 1984-1990<br />
The SEC was established as a private enterprise by the Foundation for the Peoples of<br />
the South Pacific <strong>Kiribati</strong> (FSPK), a U.S. based NGO. The FSPK received USAID<br />
funding for the start up costs and the Solar Energy Company was organized as a<br />
private, limited corporation. The initial majority shareholders were private, being the<br />
FSPK and the Bank of <strong>Kiribati</strong>. Some shares also held by the Ministry of Works and<br />
Energy. The original charter of the SEC was to act as a retail outlet for solar PV<br />
systems and to provide technical assistance where needed for their installation and<br />
33
maintenance. The company was organized to provide installation and maintenance<br />
services on demand by customers. Space was rented in Betio and two staff hired, a<br />
manager and a clerk.<br />
From 1984 - 1989 the SEC sold solar panels, batteries, controls and associated DC<br />
appliances to outer island customers, mostly for cash though some credit was<br />
provided under special conditions. Many of the sales, if not most, were to households<br />
that had a family member as a seaman on a foreign, usually German, ship. Around<br />
275 PV systems were sold to outer island customers, usually with a single panel in the<br />
38WP to 55Wp range. The quality of products sold was good and comprehensive<br />
local language installation, operation and maintenance instructions were developed<br />
and provided with systems. Although the SEC was willing to provide installations<br />
near the actual cost, the expense of travel to outer islands and the time involved in<br />
waiting for transport made that option viable only for some larger, private school<br />
installations on nearby islands.<br />
The initial sales were good with a rapid rise<br />
Figure 4-2 - Private solar installation<br />
in sales the second year of operations and in<br />
that year the company made a substantial<br />
profit.<br />
In 1986, the FSPK, believing that the<br />
company no longer needed its support,<br />
relinquished all its shares in the SEC to the<br />
Ministry of Works and Energy (MWE),<br />
making the MWE the 99% owner of the<br />
corporation with the Bank of <strong>Kiribati</strong><br />
retaining the remaining 1% ownership.<br />
Unfortunately 1985-1986 was the peak of<br />
Herb Wade<br />
the business and sales fell continuously for<br />
three more years. Even with an additional input of US$25,000 from USAID for more<br />
stock to sell, the SEC was effectively bankrupt by 1989 even though almost all the<br />
investment in stock had come from USAID or FSC and only operating expenses<br />
needed to be paid for by sales. Since the potential market for solar PV measured in the<br />
5000-8000 household range, it was clear that the problem was not market saturation.<br />
Reorganisation as an energy service company<br />
At the request of the MWE through the SEC Board of Directors, assistance was<br />
requested from the Forum Secretariat Energy Division and the South Pacific Institute<br />
for Renewable Energy (S.P.I.R.E in French Polynesia) to determine the causes of the<br />
problem that faced the company and to recommend the actions to take. The FSED<br />
agreed to fund an outer island survey to better understand the market requirements<br />
and the S.P.I.R.E. fielded a consultant to assist in the development of an action plan.<br />
Table 4.2 shows where PV systems were found by the survey and their application.<br />
The S.P.I.R.E. consultant recommended reorganisation into a “solar utility” structure<br />
that would emulate the approach used by a conventional electric utility:<br />
• all technical equipment would be installed, owned and maintained by the SEC,<br />
ownership would never be shifted to users, local committees or island<br />
councils.<br />
34
• energy recipients would have no responsibility other than paying a fee for the<br />
energy provided; and<br />
• non-payment of fees would result in disconnection of service.<br />
The FSED survey confirmed that the problem with the sales approach had been<br />
greatly reduced customer confidence in solar PV because of the general lack of<br />
reliability shown by the systems that had been purchased. The reasons were not,<br />
however, related to solar technology in general but rather to improper installations, an<br />
almost complete lack of maintenance and the replacement of failed solar batteries<br />
with car batteries that lasted only a short time. The survey found 275 PV systems on<br />
outer islands but only around 10% of the systems were still operation and providing<br />
the intended services.<br />
Table 4-2 - Solar installations in the Gilbert Islands as enumerated by the 1990 FSED Survey<br />
Island<br />
Number of<br />
PV<br />
systems<br />
Lights<br />
Lights<br />
+<br />
Radio<br />
+ Tape<br />
35<br />
Lighting<br />
+ CB<br />
Radio<br />
Lighting<br />
+ Pump<br />
Fridge<br />
Makin 8 6 1 1<br />
Comm.<br />
Radio<br />
Pump Other<br />
Butaritari 12 7 3 2<br />
Marakei 22 15 1 1 1 2 2<br />
Abaiang 22 13 1 4 4<br />
No. Tarawa 11 6 2 1 2<br />
Maiana 33 16 6 4 1 2 4<br />
Abemama 51 41 3 1 1 2 3<br />
Kuria 15 7 3 1 3 1<br />
Aranuka 11 4 2 1 1 3<br />
Nonouti 12 6 4 1 1<br />
Tabiteuea North 14 6 2 1 3 2<br />
Tabiteuea South 8 7 1<br />
Beru 7 2 3 1 1<br />
Nikunau 14 4 1 2 7<br />
Onotoa 13 11 2<br />
Tamana 10 6 1 2 1<br />
Arorae 12 7 1 1 1 1 1<br />
TOTALS 275 164 7 28 2 14 29 11 20<br />
Source: A Study of Utilization of Photovoltaics for Rural Electrification in the Republic of <strong>Kiribati</strong>, Final Report, Main Report (JICA<br />
1994)<br />
The overall finding was that the end result of the sales approach for solar electrification was<br />
unreliable systems, a high rate of expensive battery failures and general customer dissatisfaction.<br />
This translated into general distrust of PV as an electrical supply source and that lack of market<br />
confidence reduced sales to the point where the sales company could not stay in business. JICA<br />
pilot project (1990-1993)<br />
During the same time period as the shift from a sales to a “solar utility” company was<br />
being contemplated, JICA agreed to fund a pilot PV based rural electrification project.<br />
Initially the project was intended to provide lighting for community facilities only but<br />
with the strong support of the MWE, the SEC convinced JICA to instead fund a pilot<br />
trial of the solar utility concept. The pilot project was designed by the JICA team and<br />
consisted of 56 home installations and a maneaba lighting installation on North<br />
Tarawa. Persons desiring the systems paid a connection fee of $20 and agreed to pay a<br />
monthly fee of $9 dollars. The fee was set based on the amount that would have to be<br />
charged
for maintenance and repair if 500 systems were installed.<br />
Of the $9 about one third was intended for deposit in a<br />
battery replacement fund, about one third would go for the<br />
field. technician costs and the remaining third to the SEC<br />
for its administrative and supervision costs. It was<br />
recognised that the SEC would lose money at this level of<br />
fee and JICA provided additional funding to subsidise the<br />
SEC for the first years of operation with the expectation<br />
that at least 500 systems would be installed within five<br />
years if the pilot project was successful.<br />
A pre-installation survey to determine probable acceptance<br />
of systems indicated about 120 households wanted<br />
systems. Since only around 55 systems would be available,<br />
a lottery was devised to provide for a fair distribution of<br />
units. When it came time to actually pay the deposit for the<br />
systems, less than 40 paid. In order to be able to install all<br />
the available systems, the Island Council agreed to pay the<br />
installation fee for the remaining systems and install them<br />
on council employee homes with occupants paying the<br />
monthly fee. The installations were centred on the Island<br />
Council village of Abaokoro and were installed on homes<br />
from Kainaba north to Taborio.<br />
The home installations included:<br />
2-55Wp panels from various Japanese manufacturers;<br />
1-16A shunt type controller (LR-114-12) made by STECA (Germany)*;<br />
1-110Ah C100 Furukawa open cell Battery (12CTE-110)*;<br />
1-11W PL lights (from New Zealand);<br />
2-7W PL light (from New Zealand); and<br />
1-LED night light (locally made)<br />
*two systems were installed with sealed 120Ah C 100 batteries and Furukawa 30A MD200-PVI<br />
controllers for trial.<br />
The maneapa installation at Kainaba included;<br />
12-60Wp panels (Kyocera);<br />
2-16A shunt type controller (LR-114-24) made by STECA (Germany)*;<br />
4-110Ah C100 Furukawa open cell Battery (12CTE-110); and<br />
4-20W 24V tube lights (from Japan).<br />
*circuit board specially coated with a silicone rubber film to protect against moisture and salt entry<br />
The maneapa system was installed as two separate systems of 360Wp @24 volts. This<br />
allowed the use of the same specification of batteries and controllers as the household<br />
systems and provided for light even if there was a component failure in one system.<br />
36<br />
Table 4-3 – Estimated PV<br />
installed since 1990 (kWp)<br />
Type of<br />
installation<br />
Estimated<br />
Installed<br />
Capacity<br />
(kWp)<br />
SHS under the<br />
utility concept<br />
35<br />
SHS privately<br />
installed<br />
Public and<br />
14<br />
commercial<br />
lighting<br />
systems<br />
15<br />
TSKL 10<br />
PWD Water<br />
supply<br />
9<br />
Street lights 3<br />
Health Centres 7<br />
Total<br />
Estimated<br />
93<br />
Solar Capacity<br />
(Wp)<br />
Source: SEC and MW&U
Figure 4-3 - Maneapa panel installation (Kainaba)<br />
Source: JICA (1992)<br />
Household systems were installed on a steel, hot-dipped heavily galvanised pole. The<br />
maneapa system was installed in two sections near the ground with PVC pipes filled<br />
with concrete acting as the supports for the hot-dipped galvanised frame. Two<br />
household systems included data loggers that recorded voltage and current parameters<br />
and also the time of turning each light on and off.<br />
Three persons were selected, based on Figure 4-4 - Household panel Installation<br />
interviews, by the SEC as trainees to be field<br />
technicians. They and members of the Tarawa<br />
SEC technical staff were trained by the JICA<br />
team in the installation and maintenance of the<br />
systems. The persons receiving training<br />
installed the systems with the assistance and<br />
supervision of the JICA team. The North<br />
Tarawa trainee judged to be the best of the<br />
three was hired as the North Tarawa field<br />
technician with the responsibility of visiting<br />
each installation on a monthly basis, doing<br />
preventive maintenance (especially checking<br />
battery electrolyte levels) and collecting user<br />
fees.<br />
The battery manufacturer recommend that the<br />
open cell batteries be charged up to 15.3V for<br />
best service and the charge controllers were<br />
set to shut off the charge at that voltage. It was<br />
soon obvious that although this high charge<br />
limit resulted in a high level of charge for the<br />
battery it also resulted in a high rate of water<br />
loss and required the technician to check at<br />
least twice a month to be sure that the<br />
electrolyte level was not too low. To Source: JICA (1992)<br />
determine what charge cut-off voltage would<br />
be acceptable, several controllers were adjusted to a series of lower set points and<br />
37
water loss measured. A set point of 14.4V was determined to provide the best level of<br />
charge completion with an acceptable monthly water loss.<br />
Although there were no significant technical problems, the field technician had<br />
serious problems accounting for the money that he collected. As a young man, he was<br />
unable culturally to say no to his older relatives asking for “loans” and as a result he<br />
was soon more than $400 short in his payments to the SEC. The SEC changed its<br />
policy from hiring on the basis of trainability for high technical competence (typically<br />
young persons) to one based on probable ability to collect and account for fees –<br />
typically older persons with some social seniority. Since the technical demands on the<br />
field technician are not great, this approach has worked satisfactorily with fewer<br />
problems relating to accountability of collected money but without compromising<br />
maintenance.<br />
EU Lomé II PV Follow-Up Project (1992-1995)<br />
In 1994, to close out the long running Lomé II Pacific Renewable Energy Programme,<br />
five countries, including <strong>Kiribati</strong>, were selected to receive solar PV projects. Since the<br />
JICA pilot ran very well with a high percentage of fee collection and excellent<br />
technical performance, the <strong>Kiribati</strong> project was designed to expand the initial JICA<br />
pilot project to reach more distant islands while using the same institutional structure<br />
and the same size of system. The EU project was considered as a pilot trial for outer<br />
island electrification using PV while the JICA project was considered as an<br />
institutional and technical pilot for the “solar utility” concept. The project was<br />
designed and managed by S.P.I.R.E. and operated from 1992 - 1994.<br />
Capacity building was a major component of the project and week long training<br />
courses in PV technology, PV system design, specification and tendering, and project<br />
development were provided by S.P.I.R.E. over the term of the project and local staff<br />
were intimately involved in the design of their project and its implementation.<br />
For <strong>Kiribati</strong>, the project allowed the further electrification of North Tarawa by making<br />
an additional 100 PV systems available to households. With this increase in the<br />
number of systems and the much expanded size of the electrified area, a second<br />
technician was hired for North Tarawa. The basic rule of thumb used by the SEC is<br />
that one technician can typically handle no more than 125 households and in some<br />
cases where the distance between villages is great, that number may have to be<br />
reduced.<br />
The islands of Nonouti and Marakei were selected to each receive 75 PV systems.<br />
Components for all five countries were tendered at the same time and <strong>Kiribati</strong> elected<br />
to tender for the production of controllers using the well tested and reliable Pacific<br />
Controller design developed by S.P.I.R.E. in the 1980s. The SEC was awarded the<br />
contract for all controllers under the five country EU project and, though it was the<br />
first time any electronic manufacturing had been attempted in <strong>Kiribati</strong>, the controllers<br />
were delivered and accepted by all five countries.<br />
For the <strong>Kiribati</strong> project the components selected under the tender were:<br />
2 – 55W p solar panels (Siemens);<br />
1 – 20A SEC manufactured charge/discharge controller;<br />
1 – 100 Ah @ C10 open cell, tubular positive plate battery (Oldham);<br />
1 – 11W PL 12V light (New Zealand); and<br />
2 – 7 W PL 12V lights (New Zealand).<br />
38
In this case, the good results from the earlier North Tarawa installations helped with<br />
customer acceptance and the 100 systems that were allocated for North Tarawa were<br />
all taken quickly. Scepticism remained on Nonouti and Marakei and several site visits<br />
were necessary to get all available systems<br />
accepted by households.<br />
Most installations had panels installed on<br />
treated wooden poles with treated wooden<br />
mounting racks for the panels. In a few<br />
cases where the best solar access was at the<br />
house, a roof mount was used. Since <strong>Kiribati</strong><br />
residences typically consist of several small<br />
structures instead of a single multi-room<br />
building, underground connection between<br />
structures was commonly used.<br />
Three technician trainees were selected from<br />
each of the three islands and brought to<br />
Tarawa for training in installation and<br />
maintenance. The systems were installed<br />
using SEC technical staff and contracted<br />
Figure 4-5 - Battery testing training (Lomé II)<br />
supervisors from Tarawa with trainees from Herb Wade<br />
all three islands participating. After<br />
installations were completed, a final inspection was made by the EU consultant and<br />
the few problems that were found were corrected by the crews and the systems placed<br />
in service.<br />
Even with over 300 installed systems, the SEC could not break even on just user fees.<br />
Various estimates for break-even numbers were made with 1000-2000 systems<br />
considered necessary for profitability of the SEC on user fees alone. Although<br />
subsidies were offered, the SEC management rejected the offers in favour of<br />
increasing their profitability through implementation of additional donor, private or<br />
government projects. The SEC actively promoted the sale of private installations and<br />
donor projects for public infrastructure including clinics, schools and<br />
telecommunications installations. The success of the existing project prompted<br />
acceptance of many project proposals. Canadian aid provided funding for large outer<br />
island clinic installations, UNDP funded a series of solar pumping projects and<br />
installations were ordered by private institutions, mostly schools and churches. Also,<br />
the SEC continued manufacturing the S.P.I.R.E. controller for sale internationally<br />
with orders from Tonga, Fiji and Bhutan. These sales, which in most cases included<br />
installation contracts as well, provided the additional funds necessary to maintain a<br />
positive cash flow for the SEC while awaiting an expansion project to take the total<br />
user base beyond 1000 systems. Additional income came from contracts with the<br />
Department of Education and Department Health for maintenance of their PV systems<br />
on outer islands. By 2000, all the islands of the Gilberts group (except Banaba) had an<br />
SEC agent/technician on island available to do PV repairs under contract to private or<br />
public customers with payment to the technicians made on the basis of the systems to<br />
be maintained.<br />
39
The EU Solar Rural Electrification Project (1999~2006)<br />
Between 1994-1999, JICA and the EU both sent inspection teams to determine the<br />
relative success of their projects. Both recommended that additional systems be<br />
installed to increase the user base and work toward completion of <strong>Kiribati</strong>’s rural<br />
electrification. A proposal was sent to JICA in 1996 but the GoK placed harbour<br />
development as a higher priority than solar. In 1998, the EU inspection team<br />
encouraged the submission of a request for additional systems and in 1999 the request<br />
was granted and the process begun for a major expansion project. A budget of €4<br />
million was provided and tenders sent out for the management firm. A management<br />
contractor was selected in 2000 but due to a technicality, the number one rated<br />
contractor was disqualified along with the other top three tendering companies. In<br />
2001 the contract was offered and signed by the fourth ranked company that had<br />
tendered.<br />
Work on development of the project actually started in <strong>Kiribati</strong> in 2001, over a year<br />
later than originally estimated. Since the SEC was anticipating being fully occupied<br />
with the expansion project in 2000 and 2001, the company had not developed side<br />
projects for cash generation and found themselves in a difficult situation regarding<br />
cash flow. The Government of <strong>Kiribati</strong> was approached for PV project funding and<br />
agreed to fund solar street lights for the Betio-Bairiki Causeway. However even with<br />
that project, it was necessary for the SEC to draw down the battery replacement fund<br />
and cut back on Tarawa labour expenses to maintain operations while awaiting the<br />
cash flows from the EU project. By 2003, some of the original JICA batteries were<br />
beginning to fail but funds Figure 4-6 – Organisational Structure of the SEC in 2004<br />
were not available for their<br />
proper replacement. From<br />
late 2002 through 2003,<br />
the quality of service to<br />
many customers<br />
deteriorated and fee<br />
collections fell making the<br />
cash flow situation worse.<br />
Low cost car type batteries<br />
were purchased to at least<br />
temporarily restore service Source: SEC (2004)<br />
to many customers and a<br />
loan/grant was requested from the <strong>Kiribati</strong> government to keep the company solvent.<br />
The component tenders were sent out in 2002 and purchases made in 2003. The<br />
components selected for the new EU project are identical to those that used in the<br />
1994 PV Follow-Up project that had provided nearly 10 years of high reliability<br />
service.<br />
By late 2003 services provided to the EU project began to bring in cash and by May,<br />
2004, when installations began on North Tarawa the cash flow crisis appeared to be<br />
over.<br />
Approximately 1500 household systems and around 140 maneapa systems will be<br />
installed under the project. The intent is to complete full electrification of North<br />
Tarawa, Nonouti and Marakei, providing systems to all households who want them.<br />
40
The remaining systems will be distributed to all the remaining islands of the Gilberts<br />
group that can assure a minimum of 75 paid installations. Political pressure may<br />
require the installation of a smaller number on some of the small islands, particularly<br />
Banaba where there are less than 75 households on the island.<br />
A major problem facing the SEC is the fact that inflation has increased the company<br />
operating costs but the SEC failed to follow the recommendation of both the JICA<br />
team and the EU PV Follow up team to annually review the fees and raise them as<br />
necessary to compensate for cost increases. From a marketing point of view, it would<br />
make placing the new 1500 systems difficult if there were an immediate increase in<br />
user fees so at least at the time of installation it was considered important not to<br />
increase fees above the existing $9 per month. One option would be to request an<br />
operating subsidy from the government (as is the case with PUB and many other<br />
government corporations) but the stated policy of the SEC is to operate without<br />
subsidy in order to avoid the government interference and operating efficiency<br />
problems faced by other government owned corporations, like the PUB, that depend<br />
on subsidies. The approach being taken is to start the new systems at the existing $9<br />
per month rate (plus added fees for extra services, e.g. $1 per month for the addition<br />
of a high efficiency DC/DC converter to operate a home radio) and over the next 10<br />
years gradually ramp up the fees to ensure sufficient cash income to meet the cost of<br />
future battery replacements as well as day to day operating expenses.<br />
The remaining installations should be completed in 2005 with all 2000 rural PV<br />
systems then operational. The challenge will be for the SEC to smoothly expand its<br />
capacity from management of 320 systems on three islands to 2000 systems spread<br />
over all the Gilberts group.<br />
For the future, the goal is to further expand with at least another 2000 installations by<br />
2010. This will require external funding and a project proposal will be submitted in<br />
2004 so that funding can hopefully be made available by at least 2007.<br />
4.2 Lessons Learned<br />
Technical<br />
• 100 Wp is the minimum acceptable panel capacity for rural <strong>Kiribati</strong>.<br />
• Good quality batteries can provide continuous service for 10 years and more if<br />
reliable charge controls and adequate panel capacity are included in the system<br />
design.<br />
• Rainwater can used for battery water replacement if carefully collected and<br />
stored.<br />
• Positive displacement pumps are not a good choice for ground water pumping<br />
in an atoll.<br />
• The S.P.I.R.E. Pacific controller design can be successfully manufactured in<br />
<strong>Kiribati</strong> and can provide substantially higher reliability and longer battery life<br />
than off-the-shelf commercial controllers.<br />
Institutional<br />
• A majority of rural households in <strong>Kiribati</strong> can and will pay A$10 for basic<br />
lighting and radio services.<br />
41
• Fee collection rate depends on quality of service provided and on willingness<br />
to disconnect for failure to pay fees.<br />
• Field technicians need to be sufficiently mature to have the respect of the<br />
community and to be able to fully understand their responsibility for funds<br />
management.<br />
• One field technician can successfully manage 100-120 household systems for<br />
maintenance and fee collection.<br />
Commercial<br />
• Development of reliable energy service company operations increases the<br />
opportunity for the sale of PV systems and for service of private installations.<br />
• Management of personnel is the most difficult part of energy service company<br />
operations.<br />
• Good quality accounting and records management are essential to successful<br />
energy service company operations.<br />
4.3 Proposed Renewable Energy Projects<br />
4.3.1 Further electrification of the Gilberts<br />
With the completion of the EU project, approximately 25% of outer island households<br />
in the Gilberts will be electrified. Based on past experience, approximately 50% of<br />
rural households can be expected to accept solar electrification from the SEC.<br />
Therefore, a new project to develop an additional 2000 SHS for the Gilberts should be<br />
initiated immediately so that actual installation can begin to take place within five<br />
years.<br />
4.3.2 Wind resource assessment for Tarawa and Kiritimati<br />
The two urban islands of <strong>Kiribati</strong> can take advantage of wind power as a supplement<br />
to the grid if the resource is sufficient. A wind resource assessment should be begun<br />
immediately with measurement sites chosen as those most likely to be suitable for<br />
installation of a wind farm for connection to the grid. Lagoon and reef sites should be<br />
included for consideration as possible locations.<br />
4.3.3 Electrification in Line and Phoenix<br />
By far the fastest growing are of <strong>Kiribati</strong> is the Line group of Islands. If renewable<br />
energy is to be a major source of electricity for the development of the Line Islands, it<br />
is important that there be planning and development of the necessary renewable<br />
energy projects now since the time scale required for implementation of renewable<br />
energy electrification is invariably longer than that for conventional sources and the<br />
longer the delay in preparing renewable energy projects for the Line Islands, the<br />
further along will be the development of conventional energy sources.<br />
4.3.4 Biofuel development<br />
A detailed feasibility study of the economic, technical and logistic aspects of medium<br />
to large scale development of coconut oil for fuel appears warranted. If the study<br />
indicates that biofuel as a diesel replacement appears to be physically, technically and<br />
economically reasonable for <strong>Kiribati</strong> use, then there should follow a pilot project on<br />
42
one or two islands for the use of coconut oil to locally manufacture fuel for small<br />
diesel generators and vehicle engines.<br />
4.3.5 Grid based solar<br />
Both Tarawa and Kiritimati have a large enough peak load to be able to take<br />
advantage of solar supplementation of the grid. A small scale trial of around 12 kWp<br />
of solar arranged in 3 to 4 kWp modules is recommended as a pilot project. It is not<br />
recommended that PUB or PWD install and maintain the PV systems. The project<br />
could be installed and managed by the SEC with generated power sold to the grid<br />
from the solar installations to repay the cost of operation and maintenance.<br />
43
5 BARRIERS TO D EVELOPMENT AND C OMMERCIALIZATION OF R ENEWABLE E NERGY<br />
5.1 Specific Barriers<br />
5.1.1 Fiscal and Financial Barriers<br />
At the top of the list of barriers must be those relating to the relative cost of renewable<br />
energy, both in terms of its actual financial cost and the cost of shifting from familiar<br />
and convenient fossil fuels to unfamiliar technologies. Fiscal policies include import<br />
duties that unfairly tax renewable energy systems, taxes applied to renewable energy<br />
systems that are biased against renewable energy and inadequate government budgets<br />
for renewable energy development.<br />
Taxes and import duties for renewable energy in <strong>Kiribati</strong> is an issue since virtually all<br />
renewable energy development of any capacity will be developed by the SEC and<br />
other commercial enterprises. The SEC has the lead role for PV and other private<br />
sector activities are expected to include solar water heating and possibly biofuels,<br />
though government is most likely to be the primary investor in biofuel production.<br />
The real cost of electricity delivery by PUB is not known. In addition to the<br />
problem of poor record keeping, the PUB operates water, sewer and electrical services<br />
and their costs are not adequately separated to enable the understanding of the real<br />
cost of any of the services. This makes development of alternatives to existing<br />
generation difficult because it is not clear what costs are being offset.<br />
Dependence on external funding for projects. That limits opportunities for funding,<br />
adds complexities to project development and also imposes limits on the types and<br />
sources of renewable energy technologies that can be used to those considered<br />
acceptable by the donor agencies.<br />
Duties and Taxes are applied inconsistently. Duties and taxes affect KOIL, PUB<br />
and the SEC differently and their application tends to show a bias against the SEC<br />
lowering their ability to compete with the other forms of energy supply.<br />
5.1.2 Legislative, Regulatory and Policy Barriers<br />
For there to be a consistent focus for energy development, a national energy policy is<br />
essential. Though there have been several draft policies, none were accepted by<br />
government as they tended to be externally developed and did not represent the<br />
priorities of government or the public.<br />
There is no National Energy Policy accepted at all levels of Government. Without<br />
a clear policy and energy strategy, the EPU will of necessity continue to focus on<br />
immediate problems and opportunities rather than on long range planning and<br />
achievement of policy goals. With an accepted national energy policy, shifts in energy<br />
policy when governments change should be much less than is currently the case and<br />
the SEC, PUB and KOIL can be more confident that their long range plans can be<br />
followed.<br />
5.1.3 Institutional Barriers<br />
Throughout the Pacific, one of the main points of failure in renewable energy projects<br />
has been institutions that are inadequate to provide sustainable operations. Each form<br />
of renewable energy has specific technical and institutional structures that must be in<br />
place for receiving payment for energy services, maintenance of equipment and<br />
44
installation of new components. In <strong>Kiribati</strong> the only existing institution able to fulfil<br />
those requirements is SEC. For biofuel production and distribution, an institutional<br />
structure will have to be developed, though the existing coconut oil mill may be a<br />
good starting point.<br />
Limited capacity for energy planning and project development at the EPU. With<br />
only three positions (and one currently vacant) it is not possible to have the broad<br />
range of skills needed to cover the national energy planning and energy project<br />
development needs. The problem is made worse by the need for overseas training of<br />
staff that takes personnel away from the office for months and sometime years leaving<br />
the EPU even more short handed. Turnover is relatively high meaning that the<br />
average experience level tends to be low.<br />
Limited capacity for financial planning and analysis at the PUB, SEC and KOIL.<br />
A continuing problem for the management of the <strong>Kiribati</strong> energy companies is a lack<br />
of capacity for long term financial planning and analysis. Large investments must be<br />
made and that requires that detailed planning take place years before the actual need<br />
for the investment. The energy companies have not yet been able to do adequate<br />
forward planning for cash and investment requirements for more than six months to a<br />
year in the future. At least a three to five year forecasting and analysis capability is<br />
needed. Although the SEC has expressed concern regarding their difficulty in<br />
obtaining loans for working capital, the problem does not appear to be a lack of<br />
available finance in <strong>Kiribati</strong> but rather the problem of management not realising that<br />
there will be a need for working capital influx far enough in advance to plan for the<br />
need instead of it becoming a last minute emergency problem.<br />
Poor record keeping and data management in the energy companies. Though the<br />
EPU has one of the best kept national databases in the region, the data provide by the<br />
energy companies to the EPU has been late and of poor quality. The ADB attempted<br />
to shift the PUB to computerised accounts in 1992 but the system introduced was<br />
complex, unique to the PUB and could not be maintained in <strong>Kiribati</strong>. As a result the<br />
PUB has reverted to customer accounts maintained largely on cards and in account<br />
books. This causes a serious delay between transactions and the time that<br />
management can be made aware of them. The PUB has not provided auditable<br />
accounts to government auditors in years and is not really in control of its own<br />
finances. Data on operations at the PUB is somewhat better than the financial<br />
accounts but clearly some of the numbers entered in the generation and sales records<br />
are spurious and lack sufficient accuracy and content for management to be able to<br />
clearly understand the nature of system technical and non-technical losses in order to<br />
take action for their reduction. For KOIL, it took three months to get basic petroleum<br />
import data. There are no power system records for Kiritimati that could be made<br />
available on Tarawa. The SEC is much better than the PUB regarding its accounts –<br />
but they have been tracking only 350 customers instead of 5000 and it remains to be<br />
seen whether or not they will have problems maintaining proper accounts after their<br />
1500 new customers come on line in 2005.<br />
Lack of local training capacity in business management. The technical service<br />
business is fairly new to <strong>Kiribati</strong> and the management problems quite different from<br />
the trade related businesses that have long experience in the country. The need for up<br />
to date and detailed customer records, spare parts control and service logistics is not<br />
being met very well by <strong>Kiribati</strong> service businesses. Thus there is a need for training<br />
and advisory support. Although USP maintains a facility on Tarawa and provides<br />
45
asic business courses, they are primarily intended for students seeking a certificates<br />
or degrees and are not oriented toward the practical problems of managing a business<br />
in <strong>Kiribati</strong>.<br />
Lack of availability of trained or experienced personnel either for management<br />
or for technical positions. This lack means that significant time and money must be<br />
made available for formal and on-the-job training. Also it must be accepted that a year<br />
or more may pass before the new employee is really able to perform the required<br />
tasks.<br />
5.1.4 Technical Barriers<br />
Although the technologies that are expected to be used in <strong>Kiribati</strong> are mature and in<br />
wide use around the world, the difficult environmental conditions of <strong>Kiribati</strong> cause<br />
problems with many of the mainstream components in use around the world and this<br />
represents a significant technical barrier to introduction of renewable energy<br />
technology.<br />
Difficult environmental conditions for energy equipment. Energy equipment,<br />
particularly high-technology electronics used for control systems, has not survived as<br />
long as expected in the salt-laden, high temperature and humidity environment of<br />
<strong>Kiribati</strong>. Over the years, equipment has been located or specifically designed that<br />
works well for SHS but for grid connected or hybrid installations, there is no field<br />
experience.<br />
5.1.5 Physical Barriers<br />
Physical barriers are not directly amenable to barrier reduction. They must be figured<br />
into any renewable energy system design and effort made to reduce their harmful<br />
effect.<br />
Widely dispersed population on numerous atoll islands. <strong>Kiribati</strong> has the most<br />
difficult access conditions of the Pacific with 32 islands totalling only 811 km 2 spread<br />
over an area 4200 km from east to west and 2000 km from north to south.<br />
5.1.6 Market Barriers<br />
Market barriers are those that reduce opportunity for private enterprise to participate<br />
in developing renewable energy. The primary market barrier of small size is basic and<br />
not amenable to externally delivered barrier reduction programmes.<br />
Poor quality air and surface international shipping. Attempts to develop overseas<br />
markets for solar controllers has met with serious problems obtaining reliable air<br />
shipment of raw materials into and finished products out of <strong>Kiribati</strong>. Even premium<br />
air shippers like DHL and UPS have been found to be unreliable for shipment to and<br />
from <strong>Kiribati</strong>. Surface shipment is slow with a number of freight forwarding points<br />
between <strong>Kiribati</strong> and most markets slowing down shipments and increasing the risk of<br />
damage or loss. The quality of service in <strong>Kiribati</strong> is also poor. A full container of<br />
batteries was “lost” on the Tarawa wharf for six months with probable damage to the<br />
contents due to the high temperatures inside the container.<br />
Problems of access to outer islands. Within the Gilberts, though all islands (except<br />
Banaba) have scheduled air services, air freight capacity is minimal and air passenger<br />
service is limited to only about 20 persons per flight. By ship it is difficult to arrange<br />
46
personnel visits of less than two weeks. This makes installation, spare parts delivery<br />
and supervision visits very expensive. For access to the Line and Phoenix islands, the<br />
problems are much greater than for the Gilberts.<br />
Small size and fragmentation of the energy market makes development of<br />
generation and energy efficiency businesses unlikely. Effectively, Tarawa and<br />
Kiritimati represent the only opportunities for energy efficiency businesses.<br />
Generation of electricity on outer islands is unlikely to be profitable for private<br />
business and the opportunity for cogeneration or IPP development is very limited on<br />
Tarawa and Kiritimati.<br />
5.1.7 Informational and Public Awareness Barriers<br />
For renewable energy technology to be accepted, it is important that people at all<br />
levels understand its benefits and its problems and become familiar with the idea of<br />
replacing fossil fuels with renewable technologies. Various public awareness<br />
programmes have been established in the region but <strong>Kiribati</strong> has none presently in<br />
place.<br />
Lack of public awareness regarding renewable energy. Although the. success of<br />
the SEC with PV electrification has resulted in public acceptance of home<br />
electrification by solar energy, there is little awareness of the role that solar PV can<br />
play by supplementing grid power or the possibilities that exist for biofuels.<br />
47
6 IMPLEMENTATION AND C APACITY D EVELOPMENT N EEDS FOR B ARRIER R EDUCTION<br />
6.1 Reducing Barriers Through Capacity Development<br />
6.1.1 Fiscal and Financial Barriers<br />
Project development support. There is some problem accessing project finance due<br />
to problems with the development of project documentation acceptable by financing<br />
institutions. As part of regional capacity building efforts, specific programmes in<br />
project development, project document preparation, economic analysis and interfacing<br />
with international finance agencies should be developed and delivered to <strong>Kiribati</strong>.<br />
These need to focus not only on the SEC, PUB and EPU but also on any other agency,<br />
public or private, that has a need to access international finance for renewable energy<br />
projects. The EPU, SEC and PUB all could benefit from increased capacity for<br />
economic analysis, logical frame work analysis and budgeting for project<br />
development.<br />
Fiscal policy development. Taxes, import duties and government purchasing policies<br />
have an impact on the cost of renewable energy relative to fossil fuels. Government<br />
officials responsible for these policies should be made aware of the effect these<br />
policies have on the development of renewable energy and energy efficiency<br />
measures. This can be done through a regional capacity building programme that<br />
provides informational materials and training for the appropriate officials.<br />
6.1.2 Legislative, Regulatory and Policy Barriers<br />
Energy policy development. Over the past decade there have been several attempts<br />
to assist PICs to develop energy policies. A problem that has been common to those<br />
attempts is that the policy concepts have been developed externally and though those<br />
policies have sometimes been formally accepted by countries, their application has<br />
been minimal because the governments that must implement the policies had little real<br />
input to the policy making process. For written policy to be effective it must be<br />
implemented and for implementation to take place, implementers must have a stake in<br />
the success of the policy. The PIEPSAP project is addressing this issue starting in late<br />
2004 and is expected to thoroughly involve the government in the policy development<br />
process so that the resulting policy will be one that is acceptable by the present<br />
government and can be expected to continue to be acceptable by future governments.<br />
6.1.3 Institutional Barriers<br />
Management capacity development. Most of the problems facing the energy sector<br />
in <strong>Kiribati</strong> relate to poor management of available resources and a lack of<br />
management capacity to accurately forecast needs and take action in a timely and<br />
appropriate manner. Short course training needs to be made available in <strong>Kiribati</strong> to<br />
upgrade the skills of existing managers of energy programmes. This is to be addressed<br />
under the ESCAP developed regional training plan.<br />
The capacity of TTI to train electrical trades people needs to be improved. TTI<br />
facilities and staff need to be upgraded to meet the training needs of both PUB and<br />
SEC and course modules on SHS and grid based solar electrification included. Staff<br />
training and facility upgrading are both needed. Since this is also needed in several<br />
other PICs, a regional programme seems appropriate.<br />
48
Development of record keeping, storage and retrieval capacity at PUB and SEC.<br />
The PUB, and to a lesser extent, the SEC need to further develop their data gathering,<br />
data recording, data analysis, data storage and data retrieval capacities if long range<br />
planning, financial analysis, technical improvement and capital development is to be<br />
carried out on other than an emergency basis. Without access to updated and accurate<br />
data, it is not possible to properly plan for the future or to understand the cause of<br />
problems today. Given the generally poor energy records found in the PICs by the<br />
PIREP team, this is a candidate for a regional capacity building programme.<br />
Assistance is needed by the EPU, SEC and PUB in the development of grid<br />
connected renewable energy systems. There is no experience in <strong>Kiribati</strong> with Pips<br />
or cogeneration. If renewables are to provide input to the urban power sector, the local<br />
capacity must be developed through external assistance and small scale trials<br />
developed specifically for the gaining of practical experience with the technologies to<br />
be used. The EPU will need to develop legislation, standards, regulations, etc. relating<br />
to the connection to the grid of renewable energy systems. The SEC will need to<br />
understand the technology necessary for the successful connection of solar PV<br />
systems to the grid and the PUB will need to develop procedures, installation<br />
standards and operational regulations to ensure maintenance of power quality and<br />
safety for maintenance personnel. PPA is planning an introductory training for<br />
utilities for grid connected renewable energy but will not accept non-members to the<br />
course. In any case the course planned is basic and introductory and a more in depth<br />
technical programme is needed on a regional basis.<br />
6.1.4 Technical Barriers<br />
Development of standards and certifications for RETs. Although there are<br />
international standards already developed and being developed for RETs, they are<br />
generic and must be fitted to the local situation. Because equipment must be<br />
manufactured to survive under the harsh conditions of <strong>Kiribati</strong>, those requirements<br />
need to be embodied at least as purchasing guidelines or, better, as actual standards<br />
for the purchasing of RET equipment. Unlike the training programme, a standards and<br />
certification development programme needs to be done only at several year intervals.<br />
As this is a multi-country issue, with similar problems facing Tuvalu, Tokelau, RMI<br />
and FSM, a regional programme is appropriate.<br />
6.1.5 Physical Barriers<br />
Although nothing can be done to bring the outer islands physically closer, much of the<br />
management impact of this barrier can be removed through the development of good<br />
quality data communications between outer island SEC employees and the main<br />
office on South Tarawa.<br />
6.1.6 Informational and Public Awareness Barriers<br />
Delivery of renewable energy information to decision makers. Through in country<br />
programmes, sessions at international assemblies of decision makers, PPA annual<br />
meetings, SOPAC meetings, Forum meetings and other venues, information needs to<br />
be provided decision makers regarding the appropriate technologies for <strong>Kiribati</strong> and<br />
problem areas that need to be avoided. EPU staff and cabinet advisory staff should<br />
receive specific information packages and, where possible, actual training on the<br />
manner that RETs can aid national development and on the best approaches to energy<br />
strategies using energy efficiency and renewable energy methods. This is a need<br />
49
common to most of the smaller PICs and can be developed into a regional<br />
programme.<br />
Public information programmes. Although solar energy for home electrification is<br />
well known, there is little public knowledge about biofuel, biogas, wind power or<br />
hybrid systems for <strong>Kiribati</strong>. As this is a need for most of the PICs, the necessary<br />
public information materials can be developed regionally and delivered to countries<br />
along with short term training and advice in their proper delivery.<br />
50
7 IMPLICATIONS OF LARGE SCALE RENEWABLE ENERGY DEVELOPMENT<br />
Only two technologies, solar and biofuel, are known to have the potential for large<br />
scale renewable energy implementation in <strong>Kiribati</strong>. Wind power may be found to also<br />
be a cost effective component for electricity generation in some places but until<br />
several years of resource assessment can be carried out, the practicality of its<br />
development is unknown.<br />
7.1 Solar development<br />
7.1.1 Rural electrification<br />
The widespread use of solar for rural electrification can improve education,<br />
communications, health and public safety. For the mid-term, it appears that individual<br />
SHS represent the best approach to rural electrification in <strong>Kiribati</strong> as long as the SEC<br />
is able to provide the level of services to each household that specifically meets the<br />
needs of that customer. The use of individual SHS eliminates the very costly buried<br />
cable reticulation needed for grid based power delivery and the land tenure issues that<br />
are associated with developing reticulation right-of-ways. Further, it eliminates the<br />
problem of all households losing power simultaneously due to technical faults. The<br />
primary environmental problem associated with SHS use is battery recycling. By<br />
using high quality, 10 year batteries the need and cost for recycling is greatly reduced.<br />
Arrangements made with the Foundation for the People of the South Pacific, <strong>Kiribati</strong><br />
(FSPK) to handle the logistics of battery recycling for a small fee should minimise<br />
this problem.<br />
In addition to the social development aspects, the large scale use of SHS on outer<br />
islands has economic benefits through the employment of maintenance technicians<br />
and support staff resident on the rural islands as well as through the reduction in<br />
imported kerosene for lighting and diesel fuel for generation.<br />
7.1.2 Urban electrification<br />
Solar photovoltaics, probably in 4-10 kWp self-contained generation modules<br />
distributed through out the urban grid system, can provide up to about 25% of the<br />
instantaneous, daytime electricity demand for Tarawa and Kiritimati without the use<br />
of very expensive energy storage systems. However, since the PV only provides<br />
energy during the day and that varies not only over the day but with the changing<br />
weather, it is not likely that the total energy input would much exceed 5% of the total<br />
energy delivered by the grid unless battery banks or hydrogen production and storage<br />
is included. Though it may be cost effective to include the solar supplement to the<br />
diesel power without storage, it is currently not cost effective to include solar with<br />
storage and that will continue until the cost of fuel rises or the cost of the storage falls.<br />
The inclusion of large scale solar for grid based power would have little or no affect<br />
on social or economic activities and should present little or no environmental<br />
problems if storage is not used.<br />
7.2 Wind power for urban island power production<br />
Should the wind resource prove to be adequate for the production of electrical energy<br />
at a cost that is acceptable, up to as much as 20% of the instantaneous electricity<br />
demand of an urban island could be delivered to the Tarawa or Kiritimati grid without<br />
resorting to storage or complex power management systems. Due to the inconsistency<br />
51
of the resource, the total energy delivery to the grid probably could not be greater than<br />
about 10% of the total grid delivered energy. To achieve that level of penetration on<br />
Tarawa is expected to require around 0.8 MW of installed capacity, a substantial wind<br />
farm. There is no opportunity for installation of that large a wind farm on land so<br />
lagoon or reef installation would be required. That increases the cost of installation<br />
and maintenance and therefore the cost of energy from the wind farm. The<br />
environmental impact of a reef or lagoon mounted wind farm is not known but would<br />
probably not be large. A Kiritimati installation would be smaller and there is much<br />
more available land so reef or lagoon installation may not be required.<br />
There is unlikely to be any specific measurable impact on society brought about by<br />
adding wind power to the urban grid. Overall, it could benefit the economy through<br />
offsetting some petroleum imports and could provide some employment.<br />
7.3 Biofuel production to offset diesel imports<br />
The large scale use of biofuel to replace diesel for transport and electricity generation<br />
could result in significant economic benefit to the rural areas of <strong>Kiribati</strong> through<br />
increased sale of coconuts, copra and/or oil. It could also remove the problem<br />
common to outer islands of running out of fuel before a shipment arrives. However,<br />
there will also be problems associated with large scale use of biofuels. A significant<br />
problem will be the need for rejuvenation of the coconut tree source. According to the<br />
Imperial College Resource assessment, many if not most of the trees are over 50 years<br />
old with attendant drop in coconut production. A large scale replanting of trees will be<br />
needed in order to obtain the maximum benefit from biofuels and that would result in<br />
a great deal of biomass (tree trunks and fronds) that will need to be disposed of in a<br />
fashion that will be environmentally acceptable. The development of local sawmills<br />
for production of coconut lumber for the urban based manufacture of exotic wood<br />
furniture or structural materials may be an option. Also, depending on the size of the<br />
replanting that is needed and the time span it will take to complete the task, gasifiers<br />
or small steam systems could be used for electricity generation using the released<br />
biomass.<br />
As a part of the large scale development of biofuels, an institutional arrangement that<br />
assures land owners, nut collectors and nut processors receive a fair share of the<br />
proceeds will be essential. Also careful evaluation should be made of the options for<br />
processing (whether whole nuts, copra or finished oil should be shipped from the<br />
outer islands) and their effect on the end cost of the biofuel as well as the effect of the<br />
scale of production on the biofuel price.<br />
52
8 ENERGY E FFICIENCY OPPORTUNITIES<br />
Renewable energy cannot impact urban energy as easily as rural energy since the cost<br />
of conventional energy delivery is much lower. Therefore, for renewable energy to<br />
provide the highest possible percentage of energy supply for South Tarawa and<br />
Kiritimati Islands, energy efficiency measures should accompany any large scale<br />
implementation of renewable energy for urban islands.<br />
8.1 Petroleum Use Efficiency<br />
Transport is the largest user of petroleum in <strong>Kiribati</strong>. Marine transport and electricity<br />
generation are the major users of diesel fuel. Inter-island air transport, cooking and<br />
lights are the largest internal uses of kerosene. Automobiles on Tarawa and Kiritimati<br />
along with outboard powered private boats represent the main use of petrol. LPG is<br />
rapidly growing as a replacement for kerosene for cooking.<br />
Within these use sectors is scope for significant improvement in petroleum use<br />
efficiency, particularly with regards to marine transport where scheduling,<br />
maintenance and ship management significantly affect the use of fuel.<br />
Automobile use of petrol is often inefficient and with some focused effort can be<br />
significantly improved in efficiency. Special attention should be given to improving<br />
fuel efficiency in the public transport and government transport sectors and providing<br />
incentives for shifting to diesel so that biofuels can offset petroleum for transport as<br />
well as electricity generation.<br />
8.2 Electricity Efficiency<br />
The supply side efficiency should be reasonably good since the JICA upgrade project<br />
has installed new and adequately sized equipment for the PUB. However, there have<br />
been no concentrated efforts to improve demand side management (DSM) and there<br />
are many possibilities for more efficient electricity use, particularly in government<br />
facilities.<br />
53
9 CAPACITY D EVELOPMENT C O-FINANCING O PPORTUNITIES<br />
There are no firm renewable energy projects presently scheduled after completion of<br />
the EU outer island electrification project in 2005. However, there are a number of<br />
capacity development needs that could be co-financed as the project opportunities<br />
arise.<br />
1. Business training. A continuing programme to develop the management skills<br />
in the service sector of <strong>Kiribati</strong> through training in <strong>Kiribati</strong> would be of great<br />
value to the energy service sector including PUB, SEC and KOIL. It is<br />
important to realise that this cannot be accomplished by a one-off training<br />
programme, the training needs to be continually available as employee<br />
turnover makes retraining necessary and existing employees need refresher<br />
training. Although such training can be obtained external to <strong>Kiribati</strong>, the staff<br />
of the energy companies is small and the loss of even one for several months<br />
of training is a serious problem. For this to be effective, it also must be geared<br />
toward solving the unique problems of doing business in <strong>Kiribati</strong>, so local<br />
training is the only acceptable approach.<br />
2. Development of electrical trades technical training. A rejuvenation and<br />
upgrading of the electrical trades programme at TTI would benefit the PUB<br />
and the SEC as well as private electrical trades companies. As a part of the<br />
upcoming upgrading of facilities, the facilities for electrical trade training –<br />
the training programme should include solar photovoltaic installation and<br />
maintenance – should receive some priority. Training of teachers of electrical<br />
trades should be provided with specialty training in solar photovoltaic<br />
technology. Training modules specific to solar photovoltaics should be<br />
developed for TTI and included in the standard electrical trades curriculum.<br />
3. Assistance in National Energy Policy Development. Although there is a good<br />
understanding of the need for energy policy at the EPU, the capacity for its<br />
formal development needs development. Support through the PIEPSAP<br />
programme and other regional efforts for policy development may meet this<br />
need.<br />
4. Capacity building for the EPU regarding project development, project<br />
management and energy data management. If renewable energy and energy<br />
efficiency measures are to be rationally and effectively implemented,<br />
increased capacity at the EPU in the planning and preparation of high quality<br />
project documents is needed. The relatively rapid staff turnover at the EPU<br />
will require repetition of capacity building efforts every few years.<br />
5. Biofuel development assistance. Technical assistance and training related to<br />
the development and management of biofuel production in <strong>Kiribati</strong> will be<br />
needed if biofuel is to be a reasonable replacement for diesel in electricity<br />
generation and transport. This should be directed at agricultural specialists<br />
working with coconut growers as well as EPU personnel.<br />
6. Marine transport efficiency improvements. A training programme for marine<br />
diesel mechanics, ship’s officers and ship owners needs to be developed to<br />
improve the efficiency of marine transport.<br />
7. Tarawa public and government transport efficiency improvements. Training in<br />
energy efficiency improvement provided for public transport owners and the<br />
54
PWD vehicle pool managers could result in 10% to 15% reductions in their<br />
fuel use and lower emissions of air pollutants.<br />
8. Development of energy efficiency improvement fund. If the private sector is to<br />
participate in energy efficiency development, they will need finance for their<br />
customers to purchase the technology to provide the energy efficiency<br />
improvements and to guarantee that the customer will in fact receive the<br />
savings that are expected. A fund to underwrite the purchase of energy<br />
efficiency improvement equipment and to guarantee savings due to improved<br />
efficiency could make it possible for the private sector to participate.<br />
55
10 ANNEXES<br />
Annex A: People Consulted by the PIREP Mission to <strong>Kiribati</strong><br />
1) GOVERNMENT OF KIRIBATI:<br />
Ministry of PublicWorks and Utilities<br />
Mr. Taakei Taoaba Permanent Secretary for Public Works and Utilities<br />
Mr Mautaake Tannang Energy Planner, Energy Planning Unit; and<br />
PIREP National Coordinator, e-mail:<br />
energy.mwe@tskl.net.ki<br />
Mr Kireua Kaiea Energy Projects Officer, EPU<br />
Mr Tiante Tarakia Assistant Energy Planner, EPU<br />
Ministry of Finance and Economic Development<br />
Mr Peter Tong Chief Planning Officer<br />
Mr Kautuuna Kaitara Comptroller of Customs, Customs and Excise Division<br />
Ms Jenny Keaki-Tonganibeia Government Statistician<br />
Ministry of Environment, Lands, and Agricultural Development<br />
Mr Andrew Teem Climate Change Officer; email: ast.mesd2@tskl.net.ki<br />
Ministry of Commerce, Industry and Cooperatives<br />
Mr Takabea Barantarawa Commerce Officer and Price Control Officer<br />
Mr Aritaake Ientaake Assistant Commerce Officer<br />
2) GOVERNMENT-OWNED ENTERPRISES:<br />
Mr Titaaake Pinatake Chairman of Board of Commissioners, Public Utilities<br />
Board (PUB), and Chairman of Board of Directors, Solar<br />
Energy Company (SEC)<br />
Mr Tokia Grieg Chief Executive Officer, Public Utilities Board<br />
Mr Rutete Ioteba<br />
PO Box 443 Betio; ceo.pub@tskl.net.ki<br />
Chief Executive Officer, <strong>Kiribati</strong> Oil Company (KOIL)<br />
Ms Katerina Tofinga Chief Executive Officer, <strong>Kiribati</strong> Copra Marketing<br />
Company (KCMC)<br />
Mr Terubentau Akura General Manager, Solar Energy Company (SEC);<br />
Dr Jens Mertens<br />
sec@tskl.net.ki<br />
EU Adviser, SEC<br />
Ms Tiaen Abaiota Business Development Manager, Development Bank of<br />
<strong>Kiribati</strong> (DBK)<br />
Ms Teango Teimarawe Business Development Officer, DBK<br />
3) DIPLOMATIC MISSIONS, PRIVATE SECTOR AND CIVIL SOCIETY / NGOS:<br />
56
Ms Angiua Tekanene Manager Lending, Bank of <strong>Kiribati</strong> / ANZ<br />
Mr Anthony Hughes Consultant, <strong>Kiribati</strong> National Development Strategy<br />
Mr Mike Fudakowski<br />
andClimate Change Mitigation, avhughes@solomon.com.sb<br />
Director, Foundation for the Peoples of the South Pacific,<br />
<strong>Kiribati</strong><br />
Mr John Goodman High Commissioner, New Zealand High Commission<br />
Mr John Pirie Power Utilities Engineering Adviser and Pacific Power<br />
Association<br />
Training Needs Consultant to PUB; jspirie@connect.com.fj<br />
57
Annex B: References for <strong>Kiribati</strong> PIREP Report<br />
ADB, 2002 Country Strategy and Program Update: 2003 – 2005 (Manila; July)<br />
ADB, 2002 Monetization in an Atoll Society: Managing Economic and Social<br />
Change (ADB supported by AusAID; Manila; December)<br />
ADB, 2002 Poverty Assessment and Strategies for Equitable Growth and Poverty<br />
Reduction (Discussion Papers; Pacific Regional Department; Manila;<br />
April)<br />
ADB, 2003 <strong>Kiribati</strong> Section, Millennium Development Goals in the Pacific:<br />
Relevance and Progress (downloaded from www.adb.org; Manila;<br />
March)<br />
ADB, 2003 Key Indicators of Asian & Pacific Countries: <strong>Kiribati</strong> 1983-2000<br />
(Manila)<br />
ADB, undated <strong>Kiribati</strong> Country Data (downloaded from www.adb.org; January<br />
2004)<br />
AEA Technology, 1999 Evaluation of the PREP Component: PV Systems for Rural<br />
Electrification in <strong>Kiribati</strong> & Tuvalu (Project 7 ACP RPR 175; Final<br />
Report for the EU’s DGVIII Development; Brussels; March)<br />
Cheatham, C, 1997 Business Management Assistance to the Solar Energy Company<br />
of <strong>Kiribati</strong> (Final Report (prepared by C Cheatham with Kamlesh<br />
Kumar and H N Pande; Suva; September)<br />
CIA, 2003 World Factbook: <strong>Kiribati</strong> (updated August)<br />
Energo Group, 2002 Solutions for Reducing the Difference Between the Optimal and<br />
Real Fee (prepared for SEC by EDF Project ‘Solar Energy for the<br />
Outer islands’; Tarawa; September)<br />
Forsec, 1993 <strong>Kiribati</strong> Energy Conservation Project: Recommendations for<br />
Upgrading Kiritimati Energy System (prepared by Biomass<br />
Technology Group; 28 May)<br />
Forsec, 2001 Foreign Investment Environment in Individual Forum Island<br />
Countries: <strong>Kiribati</strong> (updated July)<br />
Forsec, 2003 Pacific Fuel Price Monitor (Edition 5; 12 Nov. 2003)<br />
GoK, 1981 Prices Ordinance (Laws of <strong>Kiribati</strong>; Chapter 75; 1976; revised 1979<br />
& 1981)<br />
GoK, 1993 Exemptions From Duties (Customs Schedule 1; No 13 of 1993)<br />
GoK, 1995 National Energy Policy in <strong>Kiribati</strong> (second draft)<br />
GoK, 1998 Public Utilities Act (Laws of <strong>Kiribati</strong>; Revised Edition 1998; Chapter<br />
83; incorporating amendments up to 1 September 1998)<br />
GoK, 1999 Ministry of Works and Energy Strategic Plan for 1999 – 2001<br />
GoK, 1999 <strong>Kiribati</strong>: Initial National Communication under the United Nations<br />
Framework Convention on Climate Change (Tarawa)<br />
58
GoK, 1999 Environment Act (Act 9 of 1999): An Act to provide for the<br />
protection, Improvement and Conservation of the Environment of the<br />
Republic of <strong>Kiribati</strong> (Tarawa; in effect from 21 march 2000)<br />
GoK, 2001 Energy Survey Report for Beru Island (prepared by Kireua Kaiea,<br />
EPU; July)<br />
GoK, 2001 Environment Regulations 2001 (Environment Act 1999; Section 53)(<br />
GoK, 2002 Energy Policy Guidelines and Issues (Energy Planning Unit)<br />
GoK, 2002 <strong>Kiribati</strong> Country Paper (prepared by Mautaake Tannang for the<br />
Regional Energy Meeting 2002; Rarotonga; 15-19 July)<br />
GoK, 2002 <strong>Kiribati</strong> Country Paper (prepared by Mautaake Tannang for the<br />
Middle Management Meeting; Tokyo; 2-6 September)<br />
GoK, 2003 2004 Budget of Republic of <strong>Kiribati</strong> (as approved by Te Maneaba Ni<br />
Maungatabu; 27 November)<br />
GoK, 2003 Energy Survey Report for Banaba Island (prepared by Kireua Kaiea,<br />
EPU; survey: September 2001; published: February 2003)<br />
GoK, 2003 National Development Strategies 2004 – 2007: Enhancing Growth<br />
and Ensuring Its’ Equitable Distribution (Ministry of Finance and<br />
Economic Development; November)<br />
GoK, 2003 Presentation on <strong>Kiribati</strong> Petroleum Issues (prepared by Kireua Kaiea,<br />
EPU for <strong>Kiribati</strong> Petroleum Workshop; Tarawa; October)<br />
GoK, 2004 National Accounts: Real GDP by Industry from 1991-2002 (Statistics<br />
Office)<br />
GoK/Forsec, 2003 Participants’ Handbook: Price Control Workshop (Ministry of<br />
Commerce, industry & Tourism; Betio)<br />
IEEJ, 2001 Manual for ‘Simple Econometric Simulation System’ (Tokyo)<br />
IMF, 2001 <strong>Kiribati</strong> Article IV Consultation (International Monetary Fund;<br />
Washington)<br />
JICA, 2003 Basic Design Study on the Project for Upgrading of Electric Power<br />
Supply in Tarawa Atoll, Phase II Field Report (December)<br />
McNamara, Luke, 1998 Institutional Strengthening of <strong>Kiribati</strong> Public Works<br />
Department (Western Institute of TAFE for AusAID CON 6356;<br />
Tarawa; September)<br />
PEDP, 1983 Draft National Energy Policy: Republic of <strong>Kiribati</strong> (report Kiri 83-2;<br />
Suva & Tarawa; December)<br />
SOPAC, 2003 Individual Country Biomass Resource Assessment Profile for <strong>Kiribati</strong><br />
(from ‘Biomass Resource Assessment, Utilisation and Management<br />
for Six Pacific Island Countries’ prepared by Department of<br />
Environmental Science and Technology of Imperial College London;<br />
December)<br />
UN, 2002 Common Country Assessment for <strong>Kiribati</strong> (prepared by Peter<br />
Johnston with Margaret Chung for the Office of the UN Resident<br />
Coordinator; Fiji)<br />
59
Wade, Herbert, 2001 Overview Report on an Advisory Mission to <strong>Kiribati</strong> (Prepared<br />
for Ministry of Works and Energy, for Energy Resources Section,<br />
ESCAP, Bangkok; October)<br />
WB, 2002 <strong>Kiribati</strong> at a Glance (20 September)<br />
WB, et. al. 1992 <strong>Kiribati</strong>: Issues and Options in the Energy Sector (Volume 5 of<br />
Pacific Regional Energy Assessment or PREA; prepared jointly by<br />
World Bank with UNDP/ESCAP PEDP plus ADB and Forum<br />
Secretariat)<br />
60