Structural and engineering geology of the East Gate Landslide ...
Structural and engineering geology of the East Gate Landslide ...
Structural and engineering geology of the East Gate Landslide ...

You also want an ePaper? Increase the reach of your titles
YUMPU automatically turns print PDFs into web optimized ePapers that Google loves.
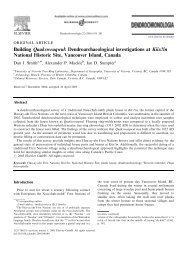
<strong>Structural</strong> <strong>and</strong> <strong>engineering</strong> <strong>geology</strong> <strong>of</strong> <strong>the</strong> <strong>East</strong> <strong>Gate</strong> L<strong>and</strong>slide,<br />
Purcell Mountains, British Columbia, Canada<br />
Abstract<br />
Marc-André Brideau a,⁎ , Doug Stead a , Réjean Couture b<br />
a Simon Fraser University, Burnaby, BC, Canada<br />
b Geological Survey <strong>of</strong> Canada, Ottawa, ON, Canada<br />
Received 19 July 2005; received in revised form 27 January 2006; accepted 31 January 2006<br />
The <strong>East</strong> <strong>Gate</strong> L<strong>and</strong>slide is a prehistoric l<strong>and</strong>slide that was reactivated in January 1997. The slope failure took place in <strong>the</strong> lower<br />
greenschist metasedimentary units <strong>of</strong> <strong>the</strong> Precambrian Horsethief Creek Group. The Grizzly Creek Thrust is a regional overturned<br />
fault that coincides with <strong>the</strong> location <strong>of</strong> <strong>the</strong> headscarp <strong>of</strong> <strong>the</strong> <strong>East</strong> <strong>Gate</strong> L<strong>and</strong>slide. Four discontinuity sets were recognised from<br />
detailed <strong>engineering</strong> geological mapping <strong>of</strong> <strong>the</strong> headscarp <strong>and</strong> surrounding area. The main scarp <strong>of</strong> <strong>the</strong> section reactivated in 1997<br />
was sub-divided into three structural domains based on its position within <strong>the</strong> l<strong>and</strong>slide, lithology, <strong>and</strong> orientation <strong>of</strong> <strong>the</strong><br />
discontinuity sets. Limit-equilibrium techniques, finite-difference (FLAC) <strong>and</strong> distinct-element (UDEC) codes were used to<br />
investigate <strong>the</strong> failure mechanism <strong>of</strong> <strong>the</strong> 1997 event. The results <strong>of</strong> <strong>the</strong> field observations <strong>and</strong> numerical models suggest that <strong>the</strong><br />
1997 failure involved a complex mechanism incorporating components <strong>of</strong> rock-slumping, bi-planar, <strong>and</strong> pseudo-circular failure<br />
that was controlled by both <strong>the</strong> orientation <strong>of</strong> <strong>the</strong> discontinuity sets <strong>and</strong> reduced rock-mass quality due to tectonic deformation.<br />
© 2006 Elsevier B.V. All rights reserved.<br />
Keywords: GSI; Limit-equilibrium; Finite-difference; Distinct-element<br />
1. Introduction<br />
The <strong>East</strong> <strong>Gate</strong> L<strong>and</strong>slide is located on <strong>the</strong> eastern side<br />
<strong>of</strong> <strong>the</strong> Beaver River Valley in Glacier National Park,<br />
British Columbia (Fig. 1). The Beaver River Valley is<br />
bounded to <strong>the</strong> east by <strong>the</strong> Dogtooth Range <strong>of</strong> <strong>the</strong><br />
Purcell Mountains <strong>and</strong> to <strong>the</strong> west by <strong>the</strong> Hermit <strong>and</strong> Sir<br />
Donald ranges <strong>of</strong> <strong>the</strong> Selkirk Mountains. In January<br />
1997, an important retrogressive failure took place<br />
within <strong>the</strong> rock mass above <strong>the</strong> oversteepened head<br />
scarp (Fig. 2). During <strong>the</strong> following days <strong>and</strong> weeks, <strong>the</strong><br />
large intact block slumped down to a few hundred<br />
meters below <strong>the</strong> head scarp. The rock mass disin-<br />
⁎ Corresponding author.<br />
E-mail address: mbrideau@sfu.ca (M.-A. Brideau).<br />
Engineering Geology 84 (2006) 183–206<br />
0013-7952/$ - see front matter © 2006 Elsevier B.V. All rights reserved.<br />
doi:10.1016/j.enggeo.2006.01.004<br />
tegrated completely after less than a few hundred meters<br />
<strong>of</strong> slumping, due to <strong>the</strong> high degree <strong>of</strong> fracturing <strong>and</strong><br />
low rock-mass quality, <strong>and</strong> transformed from a debris<br />
pile into both debris <strong>and</strong> mud flows. In both 1999 <strong>and</strong><br />
2003, mudflows from <strong>the</strong> upper slope debris impacted<br />
<strong>the</strong> Trans-Canada Highway (Highway 1), which is<br />
situated at <strong>the</strong> base <strong>of</strong> <strong>the</strong> <strong>East</strong> <strong>Gate</strong> L<strong>and</strong>slide (EBA<br />
Engineering Consultants Ltd., 2004).<br />
1.1. Previous work<br />
www.elsevier.com/locate/enggeo<br />
A kinematic analysis performed by Couture <strong>and</strong><br />
Evans (2000), using joint sets recognised in <strong>the</strong> headscarp,<br />
suggested toppling as a feasible failure mechanism.<br />
A pseudo-rotational or rock slumping mechanism<br />
was subsequently proposed as complementary to <strong>the</strong>
184 M.-A. Brideau et al. / Engineering Geology 84 (2006) 183–206<br />
toppling (Couture <strong>and</strong> Evans, 2000; EBA Engineering<br />
Consultants Ltd., 2004). Debris is now accumulating at<br />
varied elevations on flatter, bench-like sections <strong>of</strong> <strong>the</strong><br />
slope, forming unstable piles <strong>of</strong> disintegrated rock, in<br />
which large ripples <strong>and</strong> open fissures perpendicular to<br />
<strong>the</strong> flow direction indicate complex movements <strong>and</strong><br />
down-slope displacement <strong>of</strong> debris (Couture <strong>and</strong> Evans,<br />
2002). The benches are assumed to be bedrockcontrolled<br />
because <strong>the</strong>ir continuation is observed outside<br />
<strong>of</strong> <strong>the</strong> failure area (Couture <strong>and</strong> Evans, 2000).<br />
Fig. 1. Location map <strong>of</strong> <strong>the</strong> <strong>East</strong> <strong>Gate</strong> L<strong>and</strong>slide in southwestern Canada.<br />
Fig. 2. Overview <strong>of</strong> <strong>the</strong> <strong>East</strong> <strong>Gate</strong> L<strong>and</strong>slide (fall 2003 photograph).<br />
Ground-based monitoring <strong>and</strong> analysis <strong>of</strong> highresolution<br />
digital elevation models (DEM) <strong>of</strong> <strong>the</strong> debris<br />
indicate significant transfer <strong>of</strong> materials from <strong>the</strong> upper<br />
sections <strong>of</strong> <strong>the</strong> debris mass towards <strong>the</strong> lowermost part.<br />
In addition, <strong>the</strong> lowermost part <strong>of</strong> <strong>the</strong> debris mass<br />
exhibits high rates <strong>of</strong> movement, averaging 1m/month<br />
(Couture et al., 2004). This section <strong>of</strong> <strong>the</strong> debris remains<br />
<strong>the</strong> primary source <strong>of</strong> material that, once combined with<br />
run<strong>of</strong>f from snowmelt <strong>and</strong> heavy rainfalls, triggers<br />
seasonal debris-flow events that may impact <strong>the</strong>
highway. In addition, areas <strong>of</strong> <strong>the</strong> main escarpment<br />
show a large concentration <strong>of</strong> cracks <strong>and</strong> opened fissures<br />
that have opening rates varying from 7 to 603mm/year<br />
(Couture et al., 2004). Hence, <strong>the</strong> debris mass has <strong>the</strong><br />
potential to be continuously fed by down-slope<br />
movement <strong>of</strong> material from <strong>the</strong> upper parts <strong>of</strong> <strong>the</strong><br />
l<strong>and</strong>slide. Bedrock lineaments were identified in aerial<br />
photographs <strong>and</strong> in field investigations by previous<br />
workers (Couture <strong>and</strong> Evans, 2000; EBA Engineering<br />
Consultants Ltd., 2004). A hazard assessment <strong>of</strong> <strong>the</strong><br />
current conditions <strong>and</strong> a review <strong>of</strong> <strong>the</strong> mitigative options<br />
were prepared by EBA Engineering Consultants Ltd.<br />
(2004).<br />
1.2. Regional <strong>geology</strong><br />
The eastern side <strong>of</strong> <strong>the</strong> Beaver River Valley is<br />
composed <strong>of</strong> rocks from <strong>the</strong> late Pre-Cambrian Horsethief<br />
Creek Group (Wheeler, 1963) (Fig. 3). The<br />
Horsethief Creek Group represents a shallowing upward<br />
megacycle that was deposited during an intracratonic<br />
rifting event <strong>of</strong> <strong>the</strong> Late Proterozoic (Kubli, 1990). The<br />
metamorphic grade <strong>of</strong> <strong>the</strong> Horsethief Creek Group on<br />
<strong>the</strong> eastern side <strong>of</strong> <strong>the</strong> Beaver River Valley corresponds<br />
M.-A. Brideau et al. / Engineering Geology 84 (2006) 183–206<br />
to <strong>the</strong> chlorite zone <strong>of</strong> <strong>the</strong> lower greenschist facies<br />
(Kubli, 1990). The Horsethief Creek Group is subdivided<br />
in a series <strong>of</strong> slate, grit, <strong>and</strong> carbonate divisions<br />
(Poulton, 1970; Poulton <strong>and</strong> Simony, 1980; Kubli,<br />
1990). The slate divisions are predominantly composed<br />
<strong>of</strong> pelites metamorphosed to slate or phyllite, while <strong>the</strong><br />
grit divisions are comprised <strong>of</strong> weakly metamorphosed<br />
granule or pebble conglomerates. The grit divisions also<br />
contain a subordinate amount <strong>of</strong> interbedded laminated<br />
slate <strong>and</strong> s<strong>and</strong>stone with rare carbonate horizons (Kubli,<br />
1990).<br />
1.3. <strong>Structural</strong> <strong>geology</strong><br />
The Dogtooth Range is composed <strong>of</strong> a series <strong>of</strong><br />
southwest-dipping thrust sheets, which form part <strong>of</strong> an<br />
imbricate thrust system (Kubli, 1990). In a regional<br />
geological context, <strong>the</strong> Dogtooth Range is located on <strong>the</strong><br />
eastern limb <strong>of</strong> <strong>the</strong> nor<strong>the</strong>rn extension <strong>of</strong> <strong>the</strong> Purcell<br />
Anticlinorium (Wind, 1967). The rocks on <strong>the</strong> eastern<br />
side <strong>of</strong> <strong>the</strong> Beaver River Valley have been complexly<br />
folded, with <strong>the</strong> bedding (S0) striking north–northwest<br />
<strong>and</strong> dipping to <strong>the</strong> east. Older thrust faults have been<br />
folded into a vertical or overturned position (Poulton,<br />
Fig. 3. Geologic map <strong>of</strong> <strong>the</strong> <strong>East</strong> <strong>Gate</strong> L<strong>and</strong>slide (<strong>geology</strong> modified from Kubli, 1990; Poulton <strong>and</strong> Simony, 1980).<br />
185
186 M.-A. Brideau et al. / Engineering Geology 84 (2006) 183–206<br />
1970). The Grizzly Creek Thrust is a regional overturned<br />
thrust fault mapped by previous geologists<br />
(Poulton <strong>and</strong> Simony, 1980; Kubli, 1990) (Fig. 3). The<br />
Grizzly Creek Thrust fault was first suggested by<br />
Couture <strong>and</strong> Evans (2000) to coincide with <strong>the</strong> headscarp<br />
<strong>of</strong> <strong>the</strong> <strong>East</strong> <strong>Gate</strong> L<strong>and</strong>slide. A pervasive schistose<br />
fabric (S1) is present; it was subsequently deformed by a<br />
crenulation cleavage (S2) striking northwest to nor<strong>the</strong>ast<br />
<strong>and</strong> dipping to <strong>the</strong> east. The Beaver River Valley follows<br />
<strong>the</strong> Beaver River Fault, a normal fault that created <strong>the</strong><br />
Purcell Trench (Wheeler, 1963).<br />
2. Discontinuity sets <strong>and</strong> structural domains<br />
The attitudes <strong>and</strong> characteristics <strong>of</strong> approximately<br />
1000discontinuities were recorded at 66stations along<br />
rock exposures in <strong>the</strong> failure scar <strong>and</strong> on <strong>the</strong> ridge<br />
upslope from <strong>the</strong> <strong>East</strong> <strong>Gate</strong> L<strong>and</strong>slide (Fig. 4).<br />
Discontinuity terminology for spacing <strong>and</strong> persistence<br />
follows <strong>the</strong> suggested method from <strong>the</strong> International<br />
Society for Rock Mechanics (ISRM, 1978). Four<br />
dominant discontinuity sets were recognised within <strong>the</strong><br />
study area (Table 1). The dip- <strong>and</strong> strike-persistence<br />
Fig. 4. Attitudes <strong>of</strong> approximately 1000 discontinuities in <strong>the</strong> failure scar <strong>and</strong> ridge upslope from <strong>the</strong> <strong>East</strong> <strong>Gate</strong> L<strong>and</strong>slide. (A) Contoured plot <strong>of</strong> <strong>the</strong><br />
poles to discontinuities <strong>and</strong> (B) symbolic pole plot <strong>of</strong> <strong>the</strong> discontinuity types recognized at <strong>the</strong> <strong>East</strong> <strong>Gate</strong> L<strong>and</strong>slide. Both stereonets are lower<br />
hemisphere projection, Schmidt nets.
Table 1<br />
Summary <strong>of</strong> discontinuity-set characteristics, <strong>East</strong> <strong>Gate</strong> L<strong>and</strong>slide<br />
Discontinuity set Dip direction Dip Large-scale roughness Small-scale roughness Persistence (m) Spacing (mm)<br />
I–Joint 160°±20° 78°±20° Planar Rough
188 M.-A. Brideau et al. / Engineering Geology 84 (2006) 183–206<br />
Fig. 6. <strong>Structural</strong> domains at <strong>the</strong> head <strong>and</strong> upslope from <strong>the</strong> <strong>East</strong> <strong>Gate</strong> L<strong>and</strong>slide. The field stations are represented as dots on <strong>the</strong> map. Stations outside<br />
<strong>of</strong> domain boundary are associated with <strong>the</strong> location <strong>of</strong> tension cracks <strong>and</strong> do not include structural measurements.
steeply dipping <strong>and</strong> trend parallel <strong>and</strong> perpendicular,<br />
respectively, to <strong>the</strong> slope. Discontinuity set I has a close<br />
(60–200mm) to moderate (200–600mm) spacing,<br />
while discontinuity set II has a moderate (200–<br />
600mm) to wide (600–2000mm) spacing. The planar<br />
<strong>and</strong> smooth discontinuity set III represents a foliation<br />
related to <strong>the</strong> schistose fabric <strong>of</strong> <strong>the</strong> phyllite <strong>and</strong> granule<br />
conglomerate present at <strong>the</strong> study site. The predominantly<br />
stepped <strong>and</strong> rough discontinuity set IV is related<br />
to <strong>the</strong> crenulation cleavage. Fig. 5A illustrates how <strong>the</strong><br />
crenulation cleavage significantly reduces <strong>the</strong> rock-mass<br />
quality in <strong>the</strong> micaceous phyllite, whereas Fig. 5B<br />
shows <strong>the</strong> crenulation cleavage bounding larger blocks<br />
within <strong>the</strong> quartz-rich phyllite. Both discontinuity sets<br />
III <strong>and</strong> IV strike obliquely relative to <strong>the</strong> slope, dipping<br />
into <strong>the</strong> slope at between 10° <strong>and</strong> 40°, <strong>and</strong> are<br />
characterised by a very close (20–60mm) to close<br />
(60–200mm) spacing.<br />
Four structural domains were recognised at <strong>the</strong> <strong>East</strong><br />
<strong>Gate</strong> L<strong>and</strong>slide (Fig. 6). The structural domains were<br />
divided based on <strong>the</strong>ir locations on <strong>the</strong> l<strong>and</strong>slide<br />
(headscarp vs. sidescarp), <strong>the</strong> variation in lithology,<br />
<strong>and</strong> <strong>the</strong> attitude <strong>of</strong> <strong>the</strong> discontinuity sets (Table 2).<br />
Domain 1 encompasses <strong>the</strong> nor<strong>the</strong>rn section <strong>of</strong> <strong>the</strong> field<br />
site, which includes <strong>the</strong> sidescarp <strong>of</strong> <strong>the</strong> recently reactivated<br />
area. Domain 1 is composed <strong>of</strong> quartz-rich<br />
phyllite with subordinate interbeds <strong>of</strong> mica-rich phyllite.<br />
The second domain is based on measurements acquired<br />
on <strong>the</strong> ridge 400m behind <strong>the</strong> present headscarp.<br />
Table 2<br />
Summary <strong>of</strong> structural domains defined at <strong>the</strong> <strong>East</strong> <strong>Gate</strong> L<strong>and</strong>slide<br />
Domain Position on<br />
l<strong>and</strong>slide<br />
1 Nor<strong>the</strong>rn<br />
side scarp<br />
2 Ridge<br />
upslope from<br />
l<strong>and</strong>slide<br />
3 Sou<strong>the</strong>rn<br />
side scarp<br />
Lithology Attitude <strong>of</strong><br />
schistose<br />
foliation<br />
(dip→dip<br />
direction)<br />
Dominant<br />
quartz-rich<br />
phyllite<br />
Subordinate<br />
mica-rich<br />
phyllite<br />
Pebble<br />
conglomerate<br />
Dominant<br />
mica-rich<br />
phyllite<br />
Subordinate<br />
quartz-rich<br />
phyllite<br />
4 Headscarp Quartz- <strong>and</strong><br />
mica-rich<br />
phyllite<br />
M.-A. Brideau et al. / Engineering Geology 84 (2006) 183–206<br />
Average<br />
geological<br />
strength<br />
index<br />
14°→068° 20–30<br />
24°→281° 20–30<br />
27°→003° 10–20<br />
15°→015° 20–30<br />
Domain 2 is comprised <strong>of</strong> granule to pebble conglomerates<br />
that are characteristic <strong>of</strong> <strong>the</strong> grit divisions <strong>of</strong> <strong>the</strong><br />
Horsethief Creek Group. The relative attitude <strong>of</strong><br />
discontinuity sets I <strong>and</strong> II is different in domain 2 as<br />
compared to <strong>the</strong> o<strong>the</strong>r domains. Crenulation cleavage<br />
was not obvious in domain 2 outcrops, being replaced<br />
by a discontinuity set. Domain 3 encompasses <strong>the</strong><br />
sou<strong>the</strong>rn sidescarp <strong>of</strong> <strong>the</strong> l<strong>and</strong>slide <strong>and</strong> is characterised<br />
by two very well defined discontinuity sets III <strong>and</strong> IV.<br />
Domain 3 is composed <strong>of</strong> mica-rich phyllite with<br />
subordinate interbeds <strong>of</strong> quartz-rich phyllite. The central<br />
section <strong>of</strong> <strong>the</strong> l<strong>and</strong>slide, which includes all <strong>of</strong> <strong>the</strong> 1997<br />
failure headscarp area, is designated domain 4 <strong>and</strong> is<br />
composed <strong>of</strong> interbeds <strong>of</strong> quartz-rich <strong>and</strong> mica-rich<br />
phyllite.<br />
3. Tension cracks, anti-slope scarps <strong>and</strong> bedrock<br />
lineaments<br />
The locations, orientations <strong>and</strong> relative lengths <strong>of</strong><br />
tension cracks, anti-slope (uphill-facing) scarps, <strong>and</strong><br />
bedrock lineaments recognised at <strong>the</strong> study area are<br />
shown in Fig. 7. A typical tension crack present behind<br />
<strong>the</strong> sou<strong>the</strong>rn sidescarp is shown in Fig. 8. A series <strong>of</strong><br />
tension cracks immediately behind <strong>the</strong> main escarpment<br />
has been monitored by <strong>the</strong> Geological Survey <strong>of</strong> Canada<br />
<strong>and</strong> Parks Canada since 2000. The monitored features<br />
were visited <strong>and</strong> augmented by <strong>the</strong> first author with new<br />
features recognised during fieldwork performed in <strong>the</strong><br />
summer <strong>of</strong> 2004. EBA Engineering Consultants Ltd.<br />
(2004) first reported <strong>the</strong> presence <strong>of</strong> anti-slope scarps<br />
100m upslope from <strong>the</strong> headscarp. Some <strong>of</strong> <strong>the</strong> antislope<br />
scarps cut across contour lines. Three ground<br />
traverses from <strong>the</strong> headscarp to <strong>the</strong> anti-slope scarp<br />
position were conducted in order to evaluate <strong>the</strong><br />
presence <strong>of</strong> tension cracks or anti-slope scarps. Only a<br />
few subdued features were observed along <strong>the</strong>se<br />
traverses <strong>and</strong> were included in Fig. 7. The bedrock<br />
lineaments were identified from aerial photographs (30<br />
BCB 96083 194–196) <strong>and</strong> have a similar trend to <strong>the</strong><br />
lithological contacts <strong>and</strong> regional faulting, <strong>and</strong> are hence<br />
assumed to be <strong>the</strong> surface expression <strong>of</strong> <strong>the</strong>se features.<br />
4. Engineering Geology<br />
4.1. Geological strength index (GSI)<br />
189<br />
The geological strength index (GSI) was developed<br />
by Hoek <strong>and</strong> Brown (1997) to provide a quantitative<br />
evaluation <strong>of</strong> rock-mass quality for <strong>engineering</strong> purposes.<br />
The GSI considers <strong>the</strong> structure <strong>and</strong> surface<br />
conditions <strong>of</strong> <strong>the</strong> rock mass (Fig. 9). The spatial
190 M.-A. Brideau et al. / Engineering Geology 84 (2006) 183–206<br />
Fig. 7. Bedrock lineaments <strong>and</strong> tension cracks at <strong>the</strong> <strong>East</strong> <strong>Gate</strong> L<strong>and</strong>slide. Tension cracks were recognised during fieldwork, while bedrock lineaments<br />
were identified from aerial photographs.<br />
Fig. 8. Example <strong>of</strong> a tension crack located behind <strong>the</strong> sou<strong>the</strong>rn sidescarp (summer 2004 photograph).
distribution <strong>of</strong> <strong>the</strong> GSI estimates obtained at <strong>the</strong> <strong>East</strong><br />
<strong>Gate</strong> L<strong>and</strong>slide is shown in Fig. 10. As illustrated in<br />
Figs. 11 <strong>and</strong> 12, <strong>the</strong> rock-mass quality at <strong>the</strong> study site is<br />
poor. Fig. 11 illustrates <strong>the</strong> subtle field expression <strong>of</strong> <strong>the</strong><br />
Grizzly Creek Thrust Fault. The only two stations with a<br />
GSI as high as 40–50 were located on <strong>the</strong> nor<strong>the</strong>rn<br />
sidescarp <strong>of</strong> <strong>the</strong> 1997 failure (Fig. 10). The majority <strong>of</strong><br />
<strong>the</strong> headscarp area corresponds to GSI estimates<br />
between 20 <strong>and</strong> 40. Fig. 13 illustrates that <strong>the</strong>re was<br />
no clear correlation between <strong>the</strong> GSI estimates <strong>and</strong> <strong>the</strong><br />
identified structural domains. However, from field<br />
M.-A. Brideau et al. / Engineering Geology 84 (2006) 183–206<br />
Fig. 9. Geological strength index (GIS) table with shaded area representing <strong>the</strong> estimates obtained for <strong>the</strong> <strong>East</strong> <strong>Gate</strong> L<strong>and</strong>slide (from Marinos <strong>and</strong><br />
Hoek, 2000).<br />
191<br />
observation <strong>the</strong>re was a correlation between <strong>the</strong><br />
lithology <strong>of</strong> <strong>the</strong> outcrop <strong>and</strong> <strong>the</strong> GSI value <strong>and</strong> <strong>the</strong><br />
quartz rich phyllite consistently having a higher GSI<br />
than <strong>the</strong> adjacent micaceous phyllite.<br />
The distribution <strong>of</strong> <strong>the</strong> 61 GSI estimates obtained in<br />
<strong>the</strong> headscarp area was transformed into a 3D surface<br />
using <strong>the</strong> “Surfer” code (Golden, 2002) to fur<strong>the</strong>r<br />
investigate potential tectonic controls on <strong>the</strong> rock-slope<br />
instability (Fig. 14). The locations <strong>of</strong> <strong>the</strong> photographs <strong>of</strong><br />
field outcrops (Figs. 5, 11, <strong>and</strong> 12) are indicated on <strong>the</strong><br />
GSI surface in Fig. 14. A rose diagram <strong>of</strong> <strong>the</strong> orientation
192 M.-A. Brideau et al. / Engineering Geology 84 (2006) 183–206<br />
<strong>of</strong> <strong>the</strong> discontinuity <strong>and</strong> tension cracks is provided with<br />
<strong>the</strong> 3D GSI surface in order to allow comparison<br />
between <strong>the</strong> measured structures <strong>and</strong> <strong>the</strong> GSI surface.<br />
4.2. Point-load testing<br />
Fig. 10. Spatial distribution <strong>of</strong> <strong>the</strong> geological strength index (GSI) estimates for <strong>the</strong> head for <strong>the</strong> <strong>East</strong> <strong>Gate</strong> L<strong>and</strong>slide.<br />
Point-load tests were undertaken in order to characterise<br />
<strong>the</strong> intact strength properties <strong>of</strong> <strong>the</strong> different<br />
materials present at <strong>the</strong> <strong>East</strong> <strong>Gate</strong> L<strong>and</strong>slide. The tests<br />
were conducted according to <strong>the</strong> International Society<br />
for Rock Mechanics (ISRM, 1985) guidelines for<br />
irregular blocks. The results <strong>of</strong> <strong>the</strong> point load tests are<br />
summarised in Table 3. The unconfined compressive<br />
strength <strong>of</strong> <strong>the</strong> different lithologies increases with quartz<br />
content. These results correspond to <strong>the</strong> field estimates<br />
that <strong>the</strong> mica-rich unit could be easily excavated with a<br />
rock hammer (12.5–50MPa; “R3-medium strong rock”<br />
according to Brown (1981) <strong>and</strong> Hoek <strong>and</strong> Brown<br />
(1997)) <strong>and</strong> <strong>the</strong> quartz-rich units could only be broken<br />
with a single blow by a rock hammer (50–100MPa;<br />
“R4-strong rock”). All <strong>the</strong> lithologies revealed a<br />
strength anisotropy index (I s50perpendicular/I s50parallel;<br />
where I s50 is <strong>the</strong> point load index corrected for <strong>the</strong> size<br />
<strong>of</strong> <strong>the</strong> sample) between 1.55 <strong>and</strong> 1.94. This anisotropy is
attributed to <strong>the</strong> planes <strong>of</strong> weakness provided by <strong>the</strong><br />
schistose foliation <strong>of</strong> <strong>the</strong> rocks. According to Fig. 4<br />
<strong>the</strong>se planes <strong>of</strong> weakness dip obliquely into <strong>the</strong> slope.<br />
4.3. Slake-durability<br />
A series <strong>of</strong> slake-durability tests was conducted to<br />
investigate <strong>the</strong> physical wea<strong>the</strong>ring properties due to a<br />
series <strong>of</strong> wetting <strong>and</strong> drying cycles <strong>of</strong> <strong>the</strong> different<br />
phyllites present at <strong>the</strong> study area. The rapid break-<br />
M.-A. Brideau et al. / Engineering Geology 84 (2006) 183–206<br />
Fig. 11. Nor<strong>the</strong>rn sidescarp <strong>of</strong> <strong>the</strong> <strong>East</strong> <strong>Gate</strong> L<strong>and</strong>slide. Note <strong>the</strong> subtle change in GSI values interpreted to represent <strong>the</strong> field expression <strong>of</strong> <strong>the</strong><br />
overturned Grizzly Creek Thrust (summer 2004 photograph).<br />
193<br />
down <strong>of</strong> <strong>the</strong> failed mass reported by Couture <strong>and</strong><br />
Evans (2000, 2002) could have been due to <strong>the</strong><br />
material properties <strong>of</strong> <strong>the</strong> phyllite or to <strong>the</strong> closely<br />
spaced discontinuities within <strong>the</strong> rock mass. The<br />
samples for <strong>the</strong> slake-durability tests were collected<br />
from <strong>the</strong> headscarp, talus, mid-section, <strong>and</strong> deposition<br />
areas <strong>of</strong> <strong>the</strong> l<strong>and</strong>slide. An attempt was made to collect<br />
a wide range <strong>of</strong> lithological variation. An initial series<br />
<strong>of</strong> tests (Coarse A to Phyllite 6B; Table 4) was<br />
conducted following guidelines from <strong>the</strong> American
194 M.-A. Brideau et al. / Engineering Geology 84 (2006) 183–206<br />
Fig. 12. Headscarp <strong>of</strong> <strong>the</strong> 1997 slope failure with structural domains represented (summer 2004 photograph).<br />
Society for Testing <strong>and</strong> Materials (ASTM, 1987).<br />
None <strong>of</strong> <strong>the</strong> samples <strong>of</strong> <strong>the</strong> initial series <strong>of</strong> tests<br />
exhibited more than 10% disintegration after two<br />
cycles <strong>of</strong> 10min at 20rpm (Id2>0.90) (Table 4).<br />
Similar Id2 values were obtained by Ramamurthy et al.<br />
(1993) for phyllites from <strong>the</strong> Himalayan region. A<br />
second series <strong>of</strong> tests was performed using four cycles<br />
<strong>of</strong> 10min at 20rpm, as suggested in an alternate<br />
procedure by Richardson <strong>and</strong> Long (1987). Samples<br />
from this second series <strong>of</strong> tests again failed to exhibit<br />
a disintegration <strong>of</strong> more than 10% (Id4>0.90) (Table<br />
4). No relation between <strong>the</strong> slake durability <strong>and</strong> ei<strong>the</strong>r<br />
<strong>the</strong> location on <strong>the</strong> slope or <strong>the</strong> lithology <strong>of</strong> <strong>the</strong> sample<br />
was observed in ei<strong>the</strong>r series <strong>of</strong> tests.<br />
Fig. 13. Distribution <strong>of</strong> <strong>the</strong> GSI estimates as a function <strong>of</strong> <strong>the</strong> identified structural domains.
4.4. Kinematic analysis<br />
A kinematic analysis <strong>of</strong> sliding, toppling, <strong>and</strong><br />
wedge failure mechanisms was performed on <strong>the</strong><br />
mean <strong>of</strong> <strong>the</strong> discontinuity sets identified in domain 4<br />
because this domain encompassed <strong>the</strong> area involved<br />
in <strong>the</strong> 1997 failure (Fig. 15). A slope attitude <strong>of</strong><br />
45°→270° (dip →dip direction) <strong>and</strong> a 30° friction<br />
angle was used in <strong>the</strong> analysis (Fig. 15A). A very low<br />
friction angle <strong>of</strong> 20° was also considered along <strong>the</strong><br />
Fig. 14. Three-dimensional GSI surface related to <strong>the</strong> structural data.<br />
Table 3<br />
Point-load test results for different lithologies recognised at <strong>the</strong> <strong>East</strong> <strong>Gate</strong> L<strong>and</strong>slide<br />
Lithology Point load index<br />
(MPa)<br />
Mica-rich phyllite parallel<br />
(average quartz content 25%)<br />
M.-A. Brideau et al. / Engineering Geology 84 (2006) 183–206<br />
schistose fabric to assess <strong>the</strong> sensitivity <strong>of</strong> <strong>the</strong> friction<br />
angle because it was described in <strong>the</strong> field as smooth<br />
<strong>and</strong> planar. Such a low effective frictional strength<br />
could also be considered to simulate <strong>the</strong> effect <strong>of</strong> high<br />
pore-water pressures. Toppling along some discontinuities<br />
<strong>of</strong> set II is feasible (Fig. 15B). Planar failure is<br />
not feasible with a 30° friction angle <strong>and</strong> is<br />
marginally possible using a 20° friction angle (Fig.<br />
15A). Wedge failures do not appear kinematically<br />
feasible (Fig. 15C).<br />
Unconfined compressive<br />
strength (MPa)<br />
Number samples<br />
tested<br />
1.59 38 3 7<br />
Number <strong>of</strong><br />
tests performed<br />
Mica-rich phyllite perpendicular 3.14 59 2 2 1.55<br />
Quartz-rich phyllite parallel<br />
(average quartz content 40%)<br />
2.45 54 4 5<br />
Quartz-rich phyllite perpendicular 4.77 105 3 3 1.94<br />
Grit parallel (average quartz content 60%) 4.09 90 2 2<br />
Grit perpendicular 6.36 140 2 2 1.55<br />
Samples were tested parallel <strong>and</strong> perpendicular to <strong>the</strong> schistose fabric.<br />
195<br />
Anisotropy<br />
index
196 M.-A. Brideau et al. / Engineering Geology 84 (2006) 183–206<br />
Table 4<br />
Results <strong>of</strong> slake-durability testing<br />
Sample 1 cycle 2 cycles 3 cycles 4 cycles Sample location<br />
Id1 Id2 Id3 Id4<br />
Coarse A 0.993 0.945 Mid-Talus<br />
Coarse B 0.991 0.939 Mid-Talus<br />
Phyllite 1A 0.969 0.900 Lower-Talus<br />
Phyllite 2B 0.986 0.929 Lower-Talus<br />
Phyllite 3A 0.970 0.907 Lower-Talus<br />
Phyllite 4B 0.987 0.932 Lower-Talus<br />
Phyllite 5A 0.967 0.943 Lower-Talus<br />
Phyllite 6B 0.981 0.967 Lower-Talus<br />
04-25-09-01 0.988 0.981 0.975 0.970 Nor<strong>the</strong>rn side scarp<br />
04-25-12-01 0.987 0.977 0.970 0.963 Nor<strong>the</strong>rn side scarp<br />
04-23-09-01 0.979 0.966 0.953 0.942 Headscarp<br />
04-26-05-01 0.982 0.969 0.958 0.948 Headscarp<br />
04-23-06-01 0.974 0.956 0.942 0.929 Headscarp<br />
04-22-06-02 0.993 0.989 0.985 Sou<strong>the</strong>rn side scarp<br />
04-22-06-01 0.971 0.954 0.937 0.924 Sou<strong>the</strong>rn side scarp<br />
04-28-01-01 0.986 0.976 0.967 0.958 Sou<strong>the</strong>rn side scarp<br />
Several difficulties are encountered, however, when<br />
considering toppling as <strong>the</strong> dominant failure mechanism<br />
for <strong>the</strong> <strong>East</strong> <strong>Gate</strong> L<strong>and</strong>slide. Firstly, <strong>the</strong> prominent basal<br />
surfaces <strong>of</strong> <strong>the</strong> blocks are dipping into <strong>the</strong> slope with<br />
only a subordinate number <strong>of</strong> planes dipping downslope.<br />
Secondly, <strong>the</strong> spacing <strong>of</strong> <strong>the</strong> discontinuity sets<br />
(Table 1) creates tabular blocks which do not favour a<br />
block toppling mechanism (Wyllie <strong>and</strong> Mah, 2004).<br />
Thirdly, <strong>the</strong> tension cracks surveyed behind <strong>the</strong> headscarp<br />
opened (with only two exceptions) on <strong>the</strong><br />
slumping (cataclinal) discontinuity <strong>and</strong> not on <strong>the</strong><br />
toppling (anaclinal) discontinuity. Fourthly, <strong>the</strong> observed<br />
failures since 1997 all have exhibited pseudocircular<br />
slumping topography. Finally, <strong>the</strong> present-day<br />
headscarp morphology is controlled by <strong>the</strong> southstriking<br />
<strong>and</strong> steeply west-dipping (cataclinal) discontinuity<br />
set II.<br />
Using <strong>the</strong> discontinuity sets recognised at <strong>the</strong> <strong>East</strong><br />
<strong>Gate</strong> L<strong>and</strong>slide, <strong>and</strong> considering both kinematic analysis<br />
<strong>and</strong> field observations, a conceptual 3D block diagram is<br />
proposed (Fig. 16). In this model, discontinuity set I<br />
would facilitate <strong>the</strong> development <strong>of</strong> lateral release<br />
surfaces. The interaction <strong>of</strong> discontinuity sets II, III<br />
<strong>and</strong>/or IV suggests that a rock-slumping (Kieffer, 1998,<br />
2003) or active-passive wedge (Coulthard, 1979; Stead,<br />
1984) mechanism might be appropriate. Such mechanisms<br />
are fur<strong>the</strong>r complicated by <strong>the</strong> presence <strong>of</strong> <strong>the</strong><br />
Grizzly Creek Thrust fault which has degraded <strong>the</strong> rockmass<br />
quality at <strong>the</strong> base <strong>of</strong> <strong>the</strong> unstable mass. In <strong>the</strong><br />
proposed conceptual model, <strong>the</strong> toppling (anaclinal)<br />
discontinuities are attributed to fault damage associated<br />
with <strong>the</strong> overturned Grizzly Creek Thrust.<br />
5. Numerical modelling<br />
The failure mechanism <strong>of</strong> <strong>the</strong> 1997 event at <strong>the</strong> <strong>East</strong><br />
<strong>Gate</strong> L<strong>and</strong>slide was investigated using limit-equilibrium,<br />
finite-difference <strong>and</strong> distinct-element models. The<br />
limit-equilibrium model was used as a preliminary<br />
assessment <strong>of</strong> <strong>the</strong> dependence <strong>of</strong> <strong>the</strong> critical failure<br />
geometry on <strong>the</strong> strength <strong>of</strong> <strong>the</strong> rock mass. The rock<br />
mass was assumed <strong>of</strong> sufficiently low-rock mass quality<br />
(as opposed to a weak intact rock mass) to be considered<br />
as an equivalent continuum material. The finite<br />
difference code was used to model <strong>the</strong> stress–strain<br />
relations within <strong>the</strong> rock slope. The distinct-element<br />
code allowed <strong>the</strong> control exerted by both discrete<br />
structures <strong>and</strong> rock-mass strength to be investigated.<br />
The cross section used in all <strong>of</strong> <strong>the</strong> models was derived<br />
from a pre-1997 detailed topographic map <strong>of</strong> <strong>the</strong> <strong>East</strong><br />
<strong>Gate</strong> L<strong>and</strong>slide provided by <strong>the</strong> Geological Survey <strong>of</strong><br />
Canada. The Mohr–Coulomb parameters used for <strong>the</strong><br />
rock mass in <strong>the</strong> various models were estimated using<br />
RocLab s<strong>of</strong>tware (RocScience, 2002). Two sets <strong>of</strong><br />
properties were derived. The first set <strong>of</strong> properties<br />
related to <strong>the</strong> overall quality <strong>of</strong> <strong>the</strong> rock mass observed<br />
at <strong>the</strong> <strong>East</strong> <strong>Gate</strong> L<strong>and</strong>slide (Table 5). The uniaxial<br />
compressive strength (UCS) measured perpendicular to<br />
<strong>the</strong> foliation for <strong>the</strong> mica-rich phyllite <strong>of</strong> 50MPa <strong>and</strong> a<br />
GSI value <strong>of</strong> 30 were used as input in RocLab. The<br />
second set <strong>of</strong> properties described <strong>the</strong> intensely<br />
deformed material associated with <strong>the</strong> Grizzly Creek<br />
Thrust Fault (Table 5). A reduced GSI value <strong>of</strong> 15<br />
(based on field observation) was used as input in<br />
RocLab.
Fig. 15. Kinematic analysis for <strong>the</strong> headscarp <strong>of</strong> <strong>the</strong> <strong>East</strong> <strong>Gate</strong><br />
L<strong>and</strong>slide: (A) planar sliding, (B) toppling, (C) wedge failure.<br />
M.-A. Brideau et al. / Engineering Geology 84 (2006) 183–206<br />
Fig. 16. Conceptual block model <strong>of</strong> <strong>the</strong> <strong>East</strong> <strong>Gate</strong> L<strong>and</strong>slide showing<br />
<strong>the</strong> discontinuity sets <strong>and</strong> <strong>the</strong> tectonic structures influencing slope<br />
stability.<br />
5.1. Limit-equilibrium modelling<br />
SLIDE by RocScience (2004) is a slope-stability<br />
program that evaluates <strong>the</strong> stability <strong>of</strong> circular <strong>and</strong> noncircular<br />
slip surfaces in soil or rock slopes using verticalslice<br />
limit-equilibrium methods. The Spencer (1967)<br />
<strong>and</strong> Morgenstern <strong>and</strong> Price (1965) analysis methods<br />
were used in <strong>the</strong> models investigated. These methods are<br />
rigorous limit-equilibrium techniques that satisfy both<br />
force <strong>and</strong> moment equilibrium. The first series <strong>of</strong><br />
models investigated circular <strong>and</strong> non-circular surfaces<br />
for a Mohr–Coulomb material with <strong>the</strong> cohesion <strong>and</strong><br />
friction-angle values for <strong>the</strong> overall rock mass (Table 5).<br />
These models suggested a factor <strong>of</strong> safety (FOS) <strong>of</strong> ∼1.6<br />
Table 5<br />
Material <strong>and</strong> discontinuity properties used in <strong>the</strong> numerical models <strong>of</strong><br />
<strong>the</strong> <strong>East</strong> <strong>Gate</strong> L<strong>and</strong>slide<br />
Overall rock mass Damaged rock mass<br />
Material<br />
Density (kg/m 3 ) 2700 2700<br />
Bulk modulus (GPa) 1.5 0.66<br />
Shear modulus (GPa) 1.0 0.40<br />
Cohesion (MPa) 0.25 0.1<br />
Tensile strength (MPa) 0 0<br />
Friction angle (deg) 45 34<br />
Joint<br />
Normal stiffness (GPa/m) 4 2<br />
Shear stiffness (GPa/m) 2 1<br />
Joint cohesion (MPa) 0 0<br />
Joint tensile strength (MPa) 0 0<br />
Joint friction angle (deg) 20–30 20–30<br />
197
198 M.-A. Brideau et al. / Engineering Geology 84 (2006) 183–206<br />
Fig. 17. Global minimum slip surface <strong>of</strong> <strong>the</strong> <strong>East</strong> <strong>Gate</strong> L<strong>and</strong>slide<br />
obtained from Spencer's limit-equilibrium method for (A) <strong>the</strong> overall<br />
rock-mass material properties <strong>and</strong> (B) <strong>the</strong> damaged-rock-mass<br />
properties. The critical slip surface obtained in (B) resembles <strong>the</strong><br />
actual 1997 slope failure.<br />
for both <strong>the</strong> Spencer <strong>and</strong> Morgenstern–Price methods<br />
(Fig. 17A). The minimum FOS was obtained for a deepseated<br />
movement with a top <strong>of</strong> <strong>the</strong> surface<br />
corresponding with <strong>the</strong> location <strong>of</strong> <strong>the</strong> anti-slope scarps.<br />
The damaged rock-mass properties were <strong>the</strong>n investigated<br />
with respect to <strong>the</strong>ir effects on <strong>the</strong> stability <strong>of</strong> <strong>the</strong><br />
slope <strong>and</strong> on <strong>the</strong> shape <strong>of</strong> <strong>the</strong> minimum circular <strong>and</strong> noncircular<br />
surfaces. For a cohesion value <strong>of</strong> 0.1MPa <strong>and</strong> a<br />
friction angle <strong>of</strong> 34°, a circular failure surface <strong>of</strong> similar<br />
shape <strong>and</strong> cross sectional area to <strong>the</strong> 1997 failure event<br />
developed for <strong>the</strong> Spencer <strong>and</strong> Morgenstern–Price<br />
methods (Fig. 17B). The models investigated for a<br />
non-circular slip surface with <strong>the</strong> reduced material<br />
properties had larger volumes than <strong>the</strong> circular failure<br />
<strong>and</strong> <strong>the</strong> 1997 event.<br />
Since no constraints were available on <strong>the</strong> groundwater<br />
conditions, its effect on <strong>the</strong> slope stability was<br />
investigated by considering various values for <strong>the</strong> “ru”<br />
coefficient, which models <strong>the</strong> pore-water pressure as a<br />
fraction <strong>of</strong> <strong>the</strong> vertical earth pressure for each slice along<br />
<strong>the</strong> critical slip surface (“ru”=0 for dry condition <strong>and</strong><br />
“ru”=1 for artesian pore-water pressure rising above<br />
ground <strong>the</strong> height <strong>of</strong> <strong>the</strong> soil column modeled). For “ru”<br />
<strong>of</strong> 0.3, <strong>the</strong> factor <strong>of</strong> safety is 1.0 for overall rock mass<br />
strength properties, but <strong>the</strong> critical slip surface is similar<br />
to Fig 17A, which is larger than <strong>the</strong> observed failure<br />
surface for <strong>the</strong> 1997 event (Table 6).<br />
5.2. Finite-difference modelling<br />
FLAC is a 2D finite-difference modelling code<br />
from Itasca (2002a), which models <strong>the</strong> stress–strain<br />
response <strong>of</strong> a continuum material (e.g., soil or rock) to<br />
loading (static or dynamic). The advantages <strong>of</strong> <strong>the</strong><br />
finite-difference code over <strong>the</strong> limit-equilibrium technique<br />
are that no failure path needs to be specified <strong>and</strong><br />
<strong>the</strong> elastic <strong>and</strong> plastic behaviour <strong>of</strong> <strong>the</strong> material can be<br />
included in <strong>the</strong> analysis. A factor <strong>of</strong> safety can be<br />
computed using <strong>the</strong> strength-reduction technique<br />
(Dawson et al., 1999) in <strong>the</strong> FLAC/Slope module<br />
(Itasca, 2002b). The factor <strong>of</strong> safety values obtained in<br />
FLAC/Slope for <strong>the</strong> overall <strong>and</strong> damage rock<br />
properties (Table 5) <strong>of</strong> <strong>the</strong> <strong>East</strong> <strong>Gate</strong> L<strong>and</strong>slide<br />
correlated with <strong>the</strong> factors <strong>of</strong> safety obtained using<br />
<strong>the</strong> limit equilibrium method.<br />
The first model investigating <strong>the</strong> stress–strain<br />
behaviour in <strong>the</strong> <strong>East</strong> <strong>Gate</strong> L<strong>and</strong>slide using FLAC,<br />
modelled <strong>the</strong> overall rock-mass properties using an<br />
elastic–plastic Mohr–Coulomb constitutive criterion<br />
(Table 5). The maximum shear strain increment contour<br />
plot illustrates a small shear-strain concentration at <strong>the</strong><br />
base <strong>of</strong> <strong>the</strong> material that failed in 1997 (Fig. 18A). In <strong>the</strong><br />
second model, <strong>the</strong> elastic–plastic Mohr–Coulomb<br />
properties were reduced to reflect <strong>the</strong> properties <strong>of</strong> <strong>the</strong><br />
damaged rock mass. The maximum shear-strain increment<br />
concentration observed in this model was four<br />
Table 6<br />
Factor <strong>of</strong> safety obtained for limit-equilibrium analyses using different<br />
combinations <strong>of</strong> material strength properties <strong>and</strong> “ru” pore-pressure<br />
coefficients<br />
Model Cohesion<br />
(kPa)<br />
Friction<br />
angle<br />
(deg)<br />
ru Factor <strong>of</strong> safety<br />
(limitequilibrium)<br />
1 100 34 0 0.93 0.99<br />
2 160 37 0.1 1.01 –<br />
3 200 40 0.2 1.00 –<br />
4 250 45 0 1.65 1.67<br />
5 250 45 0.1 1.45 –<br />
6 250 45 0.2 1.22 –<br />
7 250 45 0.3 1.01 –<br />
Factor <strong>of</strong> safety<br />
(strengthreduction)
orders <strong>of</strong> magnitude greater than in <strong>the</strong> overall rock<br />
mass <strong>and</strong> it encompassed a zone only slightly smaller<br />
than <strong>the</strong> material that failed in 1997 (Fig. 18B).<br />
M.-A. Brideau et al. / Engineering Geology 84 (2006) 183–206<br />
Fig. 18. FLAC numerical model <strong>of</strong> <strong>the</strong> <strong>East</strong> <strong>Gate</strong> L<strong>and</strong>slide. Maximum shear strain increment contour plots for (A) <strong>the</strong> overall rock-mass quality<br />
observed at <strong>the</strong> site <strong>and</strong> (B) <strong>the</strong> damaged-rock-mass quality. Note that <strong>the</strong> contour intervals are four orders <strong>of</strong> magnitude larger in (B) than in (A).<br />
199<br />
Models in which a ubiquitous joint was introduced in<br />
<strong>the</strong> elastic–plastic Mohr–Coulomb constitutive criteria<br />
were also investigated. The overall <strong>and</strong> damaged rock-
200 M.-A. Brideau et al. / Engineering Geology 84 (2006) 183–206<br />
mass properties listed in Table 5 were investigated with<br />
<strong>the</strong> addition <strong>of</strong> a ubiquitous discontinuity set dipping<br />
10° into <strong>the</strong> slope (anaclinal). This discontinuity set<br />
represents <strong>the</strong> intersection <strong>of</strong> discontinuity sets III<br />
(schistose foliation) <strong>and</strong> IV (crenulation cleavage).<br />
The behaviour <strong>of</strong> <strong>the</strong> models with <strong>and</strong> without <strong>the</strong><br />
Fig. 19. UDEC numerical models <strong>of</strong> <strong>the</strong> <strong>East</strong> <strong>Gate</strong> L<strong>and</strong>slide. Velocity vectors for model with fault as (A) single discontinuity, (B) a set <strong>of</strong> parallel<br />
discontinuities. Plasticity state <strong>of</strong> <strong>the</strong> nodes from <strong>the</strong> model with fault as (C) single discontinuity <strong>and</strong> (D) a set <strong>of</strong> parallel discontinuities.
ubiquitous joint criterion was similar, with <strong>the</strong> exception<br />
that <strong>the</strong> ubiquitous models developed a wider zone <strong>of</strong><br />
elements failing in tension behind <strong>the</strong> headscarp <strong>of</strong> <strong>the</strong><br />
<strong>East</strong> <strong>Gate</strong> L<strong>and</strong>slide.<br />
M.-A. Brideau et al. / Engineering Geology 84 (2006) 183–206<br />
Fig. 19 (continued).<br />
5.3. Distinct-element modelling<br />
201<br />
UDEC is a two-dimensional distinct-element code<br />
from Itasca (2004) that models <strong>the</strong> response <strong>of</strong> a
202 M.-A. Brideau et al. / Engineering Geology 84 (2006) 183–206<br />
discontinuous medium, such as a jointed rock mass, to<br />
loading (static or dynamic). The material <strong>and</strong> discontinuity<br />
properties used in a series <strong>of</strong> models are listed in<br />
Table 5. The models investigated assumed that <strong>the</strong><br />
blocks making up <strong>the</strong> rock mass behaved as an elastic–<br />
plastic Mohr–Coulomb material. The schistose foliation<br />
was simulated using <strong>the</strong> ubiquitous Mohr–Coulomb<br />
criteria with an assumed direction <strong>of</strong> weakness dipping<br />
10° into <strong>the</strong> slope.<br />
Several discontinuity geometries were represented in<br />
<strong>the</strong> UDEC models. First, <strong>the</strong> discontinuity set II anaclinal,<br />
discontinuity set II cataclinal, <strong>and</strong> discontinuity<br />
III (schistose foliation) (Fig. 6) were represented<br />
individually in <strong>the</strong> models to investigate <strong>the</strong>ir influence<br />
on slope movement. Discontinuity set I was not<br />
considered in <strong>the</strong> models presented here because it is<br />
parallel to <strong>the</strong> cross section investigated. Discontinuity<br />
set I is important, however, because it provides lateral<br />
release to <strong>the</strong> blocks. This first series <strong>of</strong> models found<br />
that <strong>the</strong> anaclinal discontinuities (toppling) create an<br />
extensive zone <strong>of</strong> opening <strong>and</strong> shearing upslope from<br />
<strong>the</strong> headscarp <strong>of</strong> <strong>the</strong> failure while <strong>the</strong> model with<br />
cataclinal discontinuities (slumping) creates a more<br />
localised opening <strong>and</strong> shearing along discontinuities<br />
upslope from <strong>the</strong> headscarp. A second series <strong>of</strong> models<br />
compared <strong>the</strong> representation <strong>of</strong> <strong>the</strong> Grizzly Creek Fault<br />
as a single discontinuity <strong>and</strong> as a set <strong>of</strong> parallel<br />
discontinuities (similar to representation in Fig. 16).<br />
Fig. 19A <strong>and</strong> B show <strong>the</strong> velocity vectors for <strong>the</strong> model<br />
with <strong>the</strong> fault as a single discontinuity <strong>and</strong> a set <strong>of</strong><br />
parallel discontinuities respectively. Fig. 19B outlines<br />
more clearly a semi-circular zone <strong>of</strong> material that is<br />
slightly larger than <strong>the</strong> 1997 failure outline. Fig. 19C<br />
<strong>and</strong> D represent <strong>the</strong> plasticity state <strong>of</strong> <strong>the</strong> nodes<br />
composing <strong>the</strong> two models. Fig. 19D outlines a zone<br />
at <strong>the</strong> toe <strong>of</strong> <strong>the</strong> <strong>East</strong> <strong>Gate</strong> L<strong>and</strong>slide where a<br />
concentration <strong>of</strong> nodes has failed by slip along <strong>the</strong><br />
ubiquitous joints. Also occurring in both models are<br />
tensile failures in <strong>the</strong> nodes behind <strong>the</strong> headscarp.<br />
6. Discussion<br />
The results <strong>of</strong> <strong>the</strong> slake-durability tests suggest that<br />
<strong>the</strong> observed rapid breakdown <strong>of</strong> <strong>the</strong> failed material<br />
reported by Couture <strong>and</strong> Evans (2000, 2002) is not a<br />
material property. It is possible that <strong>the</strong> apparent lack <strong>of</strong><br />
breakdown indicated by <strong>the</strong> slake-durability test is<br />
related to <strong>the</strong> inability <strong>of</strong> <strong>the</strong> testing method to readily<br />
simulate <strong>the</strong> material's physical wea<strong>the</strong>ring due, for<br />
example, to freeze–thaw cycles. Alternatively, <strong>the</strong> rapid<br />
material breakdown at <strong>the</strong> headscarp <strong>of</strong> <strong>the</strong> 1997 failure<br />
<strong>of</strong> <strong>the</strong> <strong>East</strong> <strong>Gate</strong> L<strong>and</strong>slide may be highly localized <strong>and</strong><br />
controlled by tectonic damage due to major structures<br />
such as <strong>the</strong> Grizzly Creek Thrust.<br />
The headscarp <strong>of</strong> <strong>the</strong> 1997 event is covered by a<br />
thin film <strong>of</strong> silt- <strong>and</strong> clay-size material while <strong>the</strong> cliff<br />
face just 10m away from <strong>the</strong> headscarp did not have<br />
such a thin film. This condition was also observed<br />
during fieldwork by <strong>the</strong> third author in 1999. Silt- <strong>and</strong><br />
clay-size material appears to have been moved<br />
predominantly by surface run<strong>of</strong>f on <strong>the</strong> headscarp. A<br />
localized source <strong>of</strong> <strong>the</strong> fine material could not be<br />
observed directly in <strong>the</strong> field; however, <strong>the</strong> groundwater<br />
conditions <strong>and</strong> <strong>the</strong> influence <strong>of</strong> groundwater on<br />
<strong>the</strong> stability <strong>of</strong> <strong>the</strong> slope at <strong>the</strong> <strong>East</strong> <strong>Gate</strong> L<strong>and</strong>slide are<br />
not well known. Field mapping by <strong>the</strong> first author in<br />
August 2004 indicated one seepage zone located at <strong>the</strong><br />
base <strong>of</strong> <strong>the</strong> central section <strong>of</strong> <strong>the</strong> headscarp <strong>and</strong> a<br />
second one at <strong>the</strong> base <strong>of</strong> <strong>the</strong> nor<strong>the</strong>rn sidescarp. Both<br />
occurred in micaceous phyllite with very low GSI<br />
values (0–10), indicating possible structural control.<br />
EBA Engineering Consultants Ltd. (2004) also noted<br />
groundwater seepage at <strong>the</strong> base <strong>of</strong> <strong>the</strong> first bench in<br />
<strong>the</strong> debris material (∼50m from <strong>the</strong> headscarp). A low<br />
temperature (approx. −10°C) period preceded warm<br />
temperatures (approx. 0°C) in <strong>the</strong> days before <strong>the</strong><br />
1997 l<strong>and</strong>slide. It was suggested that such low<br />
temperatures would have reduced <strong>the</strong> permeability<br />
due to freezing <strong>of</strong> <strong>the</strong> natural conduit. This would<br />
have led to high pore-water pressure when <strong>the</strong><br />
temperature increased, <strong>the</strong>reby fur<strong>the</strong>r reducing <strong>the</strong><br />
stability <strong>of</strong> <strong>the</strong> slope by reducing <strong>the</strong> effective friction<br />
along <strong>the</strong> discontinuity surfaces (EBA Engineering<br />
Consultants Ltd., 2004).<br />
The delineated structural domains suggest that <strong>the</strong><br />
sou<strong>the</strong>rn sidescarp <strong>of</strong> <strong>the</strong> <strong>East</strong> <strong>Gate</strong> L<strong>and</strong>slide has<br />
subsided vertically <strong>and</strong> rotated counter-clockwise relative<br />
to <strong>the</strong> central <strong>and</strong> nor<strong>the</strong>rn sections. This confirms<br />
<strong>the</strong> preliminary observation by Couture <strong>and</strong> Evans<br />
(2000) that <strong>the</strong> sou<strong>the</strong>rn sidescarp appeared to be<br />
displaced. Domain 3 is a culmination <strong>of</strong> a progressive<br />
counter-clockwise rotation <strong>of</strong> <strong>the</strong> strike <strong>of</strong> <strong>the</strong> discontinuity<br />
sets from domains 1, 3, <strong>and</strong> 4. This is fur<strong>the</strong>r<br />
supported by field observations that <strong>the</strong> sou<strong>the</strong>rn portion<br />
<strong>of</strong> <strong>the</strong> l<strong>and</strong>slide is bounded by lineaments. Domain 2 is<br />
not considered fur<strong>the</strong>r here because it is 400m from <strong>the</strong><br />
o<strong>the</strong>r domains <strong>and</strong> possibly is affected by ano<strong>the</strong>r fault<br />
system.<br />
Circular rock-mass <strong>and</strong> rock-slumping failure in<br />
weak highly jointed rock masses has been recognised<br />
in <strong>the</strong> past in rock cuts <strong>and</strong> open-pit mines (Sjoberg,<br />
2000; Wyllie <strong>and</strong> Mah, 2004). Couture <strong>and</strong> Evans<br />
(2000) noted that, because <strong>of</strong> <strong>the</strong> highly fractured<br />
nature <strong>of</strong> <strong>the</strong> rock mass at <strong>the</strong> <strong>East</strong> <strong>Gate</strong> L<strong>and</strong>slide, a
pseudo-circular retrogressive failure may have been<br />
possible. The proposed conceptual model <strong>and</strong> <strong>the</strong><br />
results from preliminary numerical models appear to<br />
support a complex rock slumping/bi-planar mechanism<br />
that approaches a circular failure due to <strong>the</strong> poor rockmass<br />
quality. The geometry used in <strong>the</strong> numerical<br />
analysis was based on <strong>the</strong> conceptual model presented<br />
in Fig. 16. The numerical models can be constrained<br />
by <strong>the</strong> geological structures observed on site. Shear<br />
displacement along discontinuities in models that<br />
include steep slumping (cataclinal) discontinuity<br />
matches agree closely with <strong>the</strong> location <strong>of</strong> <strong>the</strong> tension<br />
cracks immediately behind <strong>the</strong> main escarpment <strong>and</strong><br />
<strong>of</strong> <strong>the</strong> anti-slope scarps observed in <strong>the</strong> field. This is<br />
in contrast to <strong>the</strong> discontinuum models that simulated<br />
only toppling (anaclinal) discontinuities <strong>and</strong> which<br />
developed extensive zones <strong>of</strong> extension <strong>and</strong> shear that<br />
did not match field observations. The inclusion <strong>of</strong> <strong>the</strong><br />
Grizzly Creek Thrust in <strong>the</strong> numerical models was<br />
shown to have an important effect on <strong>the</strong> failure<br />
outline, its representation as a set <strong>of</strong> parallel discontinuities<br />
led to stress concentration in <strong>the</strong> toe <strong>of</strong> <strong>the</strong><br />
l<strong>and</strong>slide <strong>and</strong> facilitated slip along <strong>the</strong> ubiquitous<br />
(foliation) discontinuities. The heavily fractured nature<br />
<strong>of</strong> <strong>the</strong> rock mass introduced two complications in <strong>the</strong><br />
numerical models. First, <strong>the</strong> material properties<br />
observed in <strong>the</strong> field <strong>and</strong> estimated using RocLab<br />
were at <strong>the</strong> boundary between a weak rock mass <strong>and</strong><br />
M.-A. Brideau et al. / Engineering Geology 84 (2006) 183–206<br />
soil behaviour. Secondly, it was impossible to<br />
represent a discontinuity spacing in <strong>the</strong> distinctelement<br />
model that would be <strong>of</strong> <strong>the</strong> same order <strong>of</strong><br />
magnitude as observed in <strong>the</strong> field. Ano<strong>the</strong>r limitation<br />
<strong>of</strong> <strong>the</strong> models presented here is that <strong>the</strong> 3D nature <strong>of</strong><br />
<strong>the</strong> failure cannot be accurately represented in <strong>the</strong> 2D<br />
models. Schistose foliation <strong>and</strong> crenulation cleavage<br />
were represented as one plane dipping 10° into <strong>the</strong><br />
slope, while in practice <strong>the</strong>y are two distinct planes<br />
striking obliquely with respect to <strong>the</strong> slope (Fig. 16).<br />
Taking into account <strong>the</strong> effect <strong>of</strong> groundwater only as<br />
a “ru” coefficient in <strong>the</strong> limit-equilibrium models is an<br />
oversimplification <strong>of</strong> <strong>the</strong> potential role played by porewater<br />
pressure on rock slope-stability <strong>and</strong> failure<br />
mechanisms. These limitations <strong>of</strong> <strong>the</strong> model reduce its<br />
capability to investigate <strong>the</strong> influence <strong>of</strong> <strong>the</strong> 3D<br />
geometry <strong>of</strong> discontinuity sets <strong>and</strong> groundwater on <strong>the</strong><br />
stability <strong>of</strong> <strong>the</strong> slope. However, <strong>the</strong> good correlation<br />
between <strong>the</strong> deformation structures observed in <strong>the</strong><br />
field <strong>and</strong> those simulated in <strong>the</strong> numerical models<br />
suggests that <strong>the</strong> dominant mechanisms operative at<br />
<strong>the</strong> <strong>East</strong> <strong>Gate</strong> L<strong>and</strong>slide have been realistically<br />
captured.<br />
Slope instability along <strong>the</strong> Beaver River Valley is not<br />
restricted to <strong>the</strong> <strong>East</strong> <strong>Gate</strong> L<strong>and</strong>slide (Pritchard et al.,<br />
1989). Pritchard (1989) suggested that <strong>the</strong> location <strong>of</strong><br />
l<strong>and</strong>slides in <strong>the</strong> Beaver River Valley was partially<br />
controlled by <strong>the</strong> lithology as <strong>the</strong>y appeared to occur<br />
Fig. 20. Hillshade obtained from a digital elevation model (DEM) <strong>of</strong> <strong>the</strong> Beaver River Valley showing <strong>East</strong> <strong>Gate</strong> L<strong>and</strong>slide in relation to o<strong>the</strong>r<br />
instabilities <strong>and</strong> <strong>the</strong> trace <strong>of</strong> <strong>the</strong> Grizzly Creek Thrust.<br />
203
204 M.-A. Brideau et al. / Engineering Geology 84 (2006) 183–206<br />
preferentially in <strong>the</strong> slate divisions. Fig. 20 is a hillshade<br />
<strong>of</strong> <strong>the</strong> digital elevation model (DEM) <strong>of</strong> <strong>the</strong><br />
Beaver River Valley, in which at least four o<strong>the</strong>r large<br />
slope failures can be clearly recognised. The Hea<strong>the</strong>r<br />
Hill L<strong>and</strong>slide has been <strong>the</strong> subject <strong>of</strong> a previous field<br />
investigation <strong>and</strong> numerical modelling (Pritchard, 1989;<br />
Pritchard <strong>and</strong> Savigny, 1991). Two previously unstudied<br />
l<strong>and</strong>slides south <strong>of</strong> <strong>the</strong> main study site in <strong>the</strong> Beaver<br />
River Valley, located at a similar elevation to <strong>the</strong> <strong>East</strong><br />
<strong>Gate</strong> L<strong>and</strong>slide occur on <strong>the</strong> eastern side <strong>of</strong> <strong>the</strong> Beaver<br />
River Valley <strong>and</strong> within <strong>the</strong> Grit Unit <strong>of</strong> <strong>the</strong> Horsethief<br />
Creek Group (Fig. 21). From a reconnaissance helicopter<br />
flight over <strong>the</strong> headscarp <strong>of</strong> L<strong>and</strong>slide 1, it appears to<br />
have similar discontinuity sets as <strong>the</strong> <strong>East</strong> <strong>Gate</strong><br />
L<strong>and</strong>slide (Fig. 21A). The headscarp also corresponds<br />
to <strong>the</strong> mapped location <strong>of</strong> <strong>the</strong> Grizzly Creek Thrust<br />
which is <strong>the</strong> same fault that controlled <strong>the</strong> location <strong>of</strong> <strong>the</strong><br />
<strong>East</strong> <strong>Gate</strong> L<strong>and</strong>slide. The headscarp <strong>of</strong> L<strong>and</strong>slide 2 has a<br />
different morphology from that <strong>of</strong> <strong>the</strong> <strong>East</strong> <strong>Gate</strong><br />
L<strong>and</strong>slide (Fig. 21B). Mapping undertaken by Kubli<br />
(1990) suggests that <strong>the</strong> Grizzly Creek Thrust does not<br />
follow <strong>the</strong> Beaver River Valley at this location. A debris<br />
flow originating from L<strong>and</strong>slide 2 reached <strong>the</strong> trail at <strong>the</strong><br />
bottom <strong>of</strong> <strong>the</strong> valley in 1999. This study suggests that<br />
<strong>the</strong> presence <strong>of</strong> regional tectonic structures also has a<br />
significant influence on <strong>the</strong> location <strong>of</strong> <strong>the</strong> l<strong>and</strong>slides in<br />
<strong>the</strong> Beaver River Valley.<br />
A toppling failure mechanism was proposed by<br />
Pritchard <strong>and</strong> Savigny (1991) for <strong>the</strong> Hea<strong>the</strong>r Hill<br />
L<strong>and</strong>slide, while a complex block-slumping/bi-planar<br />
Fig. 21. Two o<strong>the</strong>r l<strong>and</strong>slides on <strong>the</strong> eastern side <strong>of</strong> <strong>the</strong> Beaver River Valley. (A) L<strong>and</strong>slide 1 has a similar morphology <strong>and</strong> is <strong>the</strong> closest to <strong>the</strong> <strong>East</strong><br />
<strong>Gate</strong> L<strong>and</strong>slide. Its location corresponds to <strong>the</strong> mapped position <strong>of</strong> <strong>the</strong> Grizzly Creek Thrust. (B) L<strong>and</strong>slide 2 has different morphology in comparison<br />
to <strong>the</strong> <strong>East</strong> <strong>Gate</strong> L<strong>and</strong>slide (summer 2004 photographs).
pseudo-rotational mechanism is suggested from <strong>the</strong><br />
present work for <strong>the</strong> <strong>East</strong> <strong>Gate</strong> L<strong>and</strong>slide. The<br />
discontinuity sets identified by Pritchard <strong>and</strong> Savigny<br />
(1991) in <strong>the</strong> headscarp <strong>of</strong> <strong>the</strong> Hea<strong>the</strong>r Hill L<strong>and</strong>slide<br />
correspond closely to <strong>the</strong> discontinuity sets presented in<br />
this study for <strong>the</strong> headscarp <strong>of</strong> <strong>the</strong> <strong>East</strong> <strong>Gate</strong> L<strong>and</strong>slide.<br />
Fur<strong>the</strong>r work is planned to ascertain if a similar complex<br />
failure mechanism could also explain <strong>the</strong> features<br />
observed at <strong>the</strong> Hea<strong>the</strong>r Hill L<strong>and</strong>slide. A major<br />
difference between <strong>the</strong> <strong>East</strong> <strong>Gate</strong> <strong>and</strong> Hea<strong>the</strong>r Hill<br />
l<strong>and</strong>slides is that <strong>the</strong> toppling joint set recognised by<br />
Pritchard (1989) <strong>and</strong> Pritchard <strong>and</strong> Savigny (1991) north<br />
<strong>and</strong> south <strong>of</strong> <strong>the</strong> Hea<strong>the</strong>r Hill L<strong>and</strong>slide corresponds to<br />
<strong>the</strong> foliation <strong>and</strong> crenulation cleavage while <strong>the</strong> toppling<br />
joints observed at <strong>the</strong> <strong>East</strong> <strong>Gate</strong> L<strong>and</strong>slide can be<br />
attributed to a sub-parallel discontinuity set associated<br />
with <strong>the</strong> fault damage zone <strong>of</strong> <strong>the</strong> overturned Grizzly<br />
Creek Thrust.<br />
7. Conclusions<br />
Four discontinuity sets <strong>and</strong> three structural domains<br />
were recognised in <strong>the</strong> headscarp area <strong>of</strong> <strong>the</strong> <strong>East</strong> <strong>Gate</strong><br />
L<strong>and</strong>slide. The sou<strong>the</strong>rn portion <strong>of</strong> <strong>the</strong> l<strong>and</strong>slide appears<br />
to have subsided vertically <strong>and</strong> rotated counter-clockwise<br />
relative to <strong>the</strong> nor<strong>the</strong>rn portion. Point-load tests<br />
revealed an anisotropy index between 1.55 <strong>and</strong> 1.96 <strong>and</strong><br />
correlation between <strong>the</strong> point-load index <strong>and</strong> <strong>the</strong> quartz<br />
content <strong>of</strong> <strong>the</strong> samples tested. Tension cracks <strong>and</strong><br />
trenches appear to be restricted to <strong>the</strong> immediate vicinity<br />
<strong>of</strong> <strong>the</strong> headscarp. Although kinematic analysis suggested<br />
that toppling was a feasible failure mechanism, field<br />
observations <strong>of</strong> block shape <strong>and</strong> rock-mass quality make<br />
simple block toppling an unlikely dominant failure<br />
mechanism. A 3D conceptual block diagram suggested<br />
that a complex rock slumping/bi-planar pseudo-rotational<br />
failure mechanism may be involved. Twodimensional<br />
limit-equilibrium, finite-difference, <strong>and</strong><br />
distinct-element modelling indicates that a pseudocircular<br />
failure influenced by a steeply dipping cataclinal<br />
discontinuity set would result from <strong>the</strong> very low rockmass<br />
quality <strong>and</strong> <strong>the</strong> discontinuity sets recognised at <strong>the</strong><br />
<strong>East</strong> <strong>Gate</strong> L<strong>and</strong>slide.<br />
Acknowledgements<br />
The authors would like to thank K. Fecova for her<br />
capable assistance in <strong>the</strong> field, A. Polster (Mount<br />
Revelstoke <strong>and</strong> Glacier National Park) for his insightful<br />
discussions <strong>and</strong> ongoing monitoring efforts <strong>of</strong> <strong>the</strong> <strong>East</strong><br />
<strong>Gate</strong> L<strong>and</strong>slide <strong>and</strong> T.E. Kubli for discussions on <strong>the</strong><br />
regional <strong>geology</strong> during a CPGS fieldtrip. Logistical<br />
M.-A. Brideau et al. / Engineering Geology 84 (2006) 183–206<br />
support was provided by Parks Canada <strong>and</strong> <strong>the</strong><br />
Geological Survey <strong>of</strong> Canada. The Geological Survey<br />
<strong>of</strong> Canada also provided <strong>the</strong> detail topographic information<br />
<strong>of</strong> <strong>the</strong> <strong>East</strong> <strong>Gate</strong> L<strong>and</strong>slide used in this paper.<br />
Funding for this project was provided from NSREC<br />
Discovery grant to D. Stead, Geological Survey <strong>of</strong><br />
Canada Contribution 2005847.<br />
References<br />
205<br />
American Society for Testing <strong>and</strong> Materials (ASTM), 1987. St<strong>and</strong>ard<br />
Test Methods for <strong>the</strong> Slake Durability <strong>of</strong> Shales <strong>and</strong> Similar Weak<br />
Rocks. American Society for Testing <strong>and</strong> Materials (ASTM).<br />
St<strong>and</strong>ard D4644-87.<br />
Brown, E.T., 1981. Rock Characterization, Testing <strong>and</strong> Monitoring –<br />
ISRM Suggested Methods. Pergamon Press, Oxford.<br />
Coulthard, M.A., Back-analysis <strong>of</strong> observed spoil failures using a twowedge<br />
method. Commonwealth Scientific <strong>and</strong> Research Organisation<br />
(CSIRO) Technical Report 83. 20 pp.<br />
Couture, R., Evans, S.G., 2000. The <strong>East</strong> <strong>Gate</strong> L<strong>and</strong>slide, Beaver Valley,<br />
Glacier National Park, Columbia Mountains, British Columbia. Open<br />
File, vol. 3877. Geological Survey <strong>of</strong> Canada, pp. 1–26.<br />
Couture, R., Evans, S.G., 2002. Disintegrating rock slope movements<br />
in <strong>the</strong> Beaver River Valley, Glacier National Park, British<br />
Columbia, Canada. In: Evans, S.G. (Ed.), NATO Publication;<br />
Massive Rock Failure: New Models for Hazard Assessment,<br />
Celano, Italy, pp. 19–23.<br />
Couture, R., Evans, S.G., Polster, A., 2004. Movement <strong>and</strong><br />
mechanisms <strong>of</strong> a complex l<strong>and</strong>slide: <strong>the</strong> case <strong>of</strong> <strong>East</strong> <strong>Gate</strong><br />
L<strong>and</strong>slide, Glacier National Park, Canada. In: Lacerda, W.A.,<br />
Ehrlich, M., Fontoura, S.A.B., Sayao, A.S.F. (Eds.), L<strong>and</strong>slides:<br />
Evaluation <strong>and</strong> Stabilization, Proceedings <strong>of</strong> 9th International<br />
Symposium on L<strong>and</strong>slides. Balkema, Rotterdam, pp. 1271–1278.<br />
Dawson, E.M., Roth, W.H., Drescher, A., 1999. Slope stability<br />
analysis by strength reduction. Geotechnique 49 (6), 835–840.<br />
EBA Engineering Consultants Ltd., 2004. <strong>East</strong> <strong>Gate</strong> L<strong>and</strong>slide Study,<br />
Beaver Valley, Glacier National Park, Project No. 0807-7825120.<br />
178 pp.<br />
Golden, 2002. Surfer (Version 8.05). Golden S<strong>of</strong>tware Inc, Boulder,<br />
CO.<br />
Hoek, E., Brown, E.T., 1997. Practical estimates <strong>of</strong> rock mass strength.<br />
International Journal <strong>of</strong> Rock Mechanics <strong>and</strong> Mining Sciences 34<br />
(8), 1165–1186.<br />
International Society for Rock Mechanics (ISRM), 1978. Suggested<br />
methods for <strong>the</strong> quantitative description <strong>of</strong> discontinuities in rock<br />
masses. International Journal <strong>of</strong> Rock Mechanics <strong>and</strong> Mining<br />
Sciences & Geomechanics Abstracts 15, 319–368.<br />
International Society for Rock Mechanics (ISRM), 1985. Suggested<br />
method for determining point load strength. International Journal<br />
<strong>of</strong> Rock Mechanics <strong>and</strong> Mining Sciences & Geomechanics<br />
Abstracts 22, 51–60.<br />
Itasca, 2002a. FLAC—Fast Lagrangian Analysis <strong>of</strong> Continua (Version<br />
4.0). Itasca Consulting Group, Minneapolis, MN.<br />
Itasca, 2002b. FLAC/Slope (Version 4.0). Itasca Consulting Group,<br />
Minneapolis, MN.<br />
Itasca, 2004. UDEC—Universal Distinct Element Code (Version 4.0).<br />
Itasca Consulting Group, Minneapolis, MN.<br />
Kieffer, D.S. 1998. Rock Slumping: A compound failure mode <strong>of</strong><br />
jointed hard rock slopes. PhD <strong>the</strong>sis, University <strong>of</strong> California,<br />
Berkeley. 166 pp.
206 M.-A. Brideau et al. / Engineering Geology 84 (2006) 183–206<br />
Kieffer, D.S., 2003. Rotational instability <strong>of</strong> hard rock slopes. Felsbau<br />
21 (2), 31–38.<br />
Kubli, T.E., 1990. Geology <strong>of</strong> <strong>the</strong> Dogtooth Range, Nor<strong>the</strong>rn Purcell<br />
Mountains, British Columbia. PhD <strong>the</strong>sis, University <strong>of</strong> Calgary,<br />
Calgary, Alberta. 324 pp.<br />
Marinos, P., Hoek, E., 2000. GSI: A geologically friendly tool for rock<br />
mass strength estimation, Proceedings <strong>of</strong> <strong>the</strong> GEOENG 2000<br />
Conference, Melbourne, Australia.<br />
Morgenstern, N.R., Price, V.E., 1965. The analysis <strong>of</strong> <strong>the</strong> stability <strong>of</strong><br />
general slip surfaces. Geotechnique 15 (1), 79–93.<br />
Poulton, T.P., 1970. Stratigraphy <strong>and</strong> sedimentology, Horsethief Creek<br />
Formation, Nor<strong>the</strong>rn Dogtooth Mountains, British Columbia. M.<br />
Sc. Thesis, University <strong>of</strong> Calgary, Calgary, Alberta. 117 pp.<br />
Poulton, T.P., Simony, P.S., 1980. Stratigraphy, sedimentology, <strong>and</strong><br />
regional correlation <strong>of</strong> <strong>the</strong> Horsethief Creek Group (Hadrynian,<br />
late Precambrian) in <strong>the</strong> Nor<strong>the</strong>rn Purcell <strong>and</strong> Selkirk Mountains,<br />
British Columbia. Canadian Journal <strong>of</strong> Earth Sciences 17,<br />
1708–1724.<br />
Pritchard, M.A. 1989. Numerical modelling <strong>of</strong> large scale toppling. M.<br />
A.Sc. Thesis, University <strong>of</strong> British Columbia, Vancouver, British<br />
Columbia. 179 pp.<br />
Pritchard, M.A., Savigny, K.W., 1991. The Hea<strong>the</strong>r Hill l<strong>and</strong>slide: an<br />
example <strong>of</strong> a large scale toppling failure in a natural slope.<br />
Canadian Geotechnical Journal 28, 410–422.<br />
Pritchard, M.A., Savigny, K.W., Evans, S.G., 1989. Deep-seated slope<br />
movements in <strong>the</strong> Beaver River Valley, Glacier National Park, B.C.<br />
Open File, vol. 2011. Geological Survey <strong>of</strong> Canada. 8 pp.<br />
Ramamurthy, T., Venkatappa Rao, G., Singh, J., 1993. Engineering<br />
behaviour <strong>of</strong> phyllites. Engineering Geology 33, 209–225.<br />
Richardson, D.N., Long, J.D., 1987. The sieved slake durability.<br />
Bulletin <strong>of</strong> <strong>the</strong> Association <strong>of</strong> Engineering Geologists XXIV (2),<br />
247–258.<br />
RocScience, 2002. RocLab (Version 1.010). RocScience Inc., Toronto.<br />
RocScience, 2004. SLIDE (Version 5.013). RocScience Inc., Toronto.<br />
Sjoberg, J., 2000. Failure mechanisms for high slopes in hard rock. In:<br />
Hustrulid, W.A., McCarter, M.K., Van Zyl, D.J.A. (Eds.), Slope<br />
Stability in Surface Mining, pp. 71–80.<br />
Spencer, E., 1967. A method <strong>of</strong> analysis <strong>of</strong> <strong>the</strong> stability <strong>of</strong><br />
embankments assuming parallel inter-slice forces. Geotechnique<br />
17, 11–26.<br />
Stead, D., 1984. An Evaluation <strong>of</strong> <strong>the</strong> factors governing <strong>the</strong> stability <strong>of</strong><br />
surface coal mine slopes. PhD <strong>the</strong>sis. University <strong>of</strong> Nottingham.<br />
486 pp.<br />
Wheeler, J.O., 1963. Rogers Pass map-area, British Columbia <strong>and</strong><br />
Alberta (82N W1/2). 62-32, Geological Survey <strong>of</strong> Canada.<br />
Wind, G., 1967. <strong>Structural</strong> <strong>geology</strong> <strong>of</strong> <strong>the</strong> Nor<strong>the</strong>rn Dogtooth Range,<br />
British Columbia. M.Sc. Thesis, University <strong>of</strong> Calgary, Calgary,<br />
Alberta. 96 pp.<br />
Wyllie, D.C., Mah, C.W., 2004. Rock Slope Engineering; Civil <strong>and</strong><br />
Mining, 4th edition. Spon Press. 431 pp.