reconstruction of sri lanka‟s fisheries catches - Sea Around Us Project
reconstruction of sri lanka‟s fisheries catches - Sea Around Us Project
reconstruction of sri lanka‟s fisheries catches - Sea Around Us Project

Create successful ePaper yourself
Turn your PDF publications into a flip-book with our unique Google optimized e-Paper software.
Fisheries catch <strong>reconstruction</strong>s: Islands, Part II. Harper and Zeller 85<br />
RECONSTRUCTION OF SRI LANKA‟S FISHERIES CATCHES: 1950-2008 1<br />
Devon O‟Meara a, Sarah Harper a, Nishan Perera b and Dirk Zeller a<br />
a<strong>Sea</strong> <strong>Around</strong> <strong>Us</strong> <strong>Project</strong>, Fisheries Centre, University <strong>of</strong> British Columbia,<br />
2202 Main Mall, Vancouver, BC, V6T 1Z4, Canada<br />
b Linnaeus University, SE 39182 Kalmar, Sweden<br />
d.omeara@<strong>fisheries</strong>.ubc.ca; s.harper@<strong>fisheries</strong>.ubc.ca; nishan.perera@lnu.se; d.zeller@<strong>fisheries</strong>.ubc.ca<br />
ABSTRACT<br />
Sri Lanka has a long history <strong>of</strong> reliance on the sea for the nutritional and economic well-being <strong>of</strong> its<br />
people. Fishing has long been an important industry and, while detailed fishing records exist dating back<br />
to the early 1900s, they are incomplete. In this study, we estimated total marine <strong>fisheries</strong> <strong>catches</strong> for the<br />
1950-2008 time period by accounting for all <strong>fisheries</strong> sub-sectors and components and compared this to<br />
the reported landings as provided to FAO. Our total reconstructed catch which included commercial and<br />
subsistence <strong>catches</strong>, and discarded bycatch was estimated at almost 18 million tonnes over the 1950-2008<br />
time period. This estimate was over 2 times larger than the total landings reported by Sri Lanka to the<br />
FAO. The majority <strong>of</strong> this discrepancy was due to <strong>catches</strong> from the subsistence sector and discarded<br />
bycatch associated with shrimp trawl <strong>fisheries</strong>. Improved monitoring <strong>of</strong>, and record-keeping for, these<br />
<strong>fisheries</strong> components is crucial to the longterm management <strong>of</strong> Sri Lanka‟s <strong>fisheries</strong> and to maintaining<br />
livelihoods and food security <strong>of</strong> the Sri Lankan people.<br />
INTRODUCTION<br />
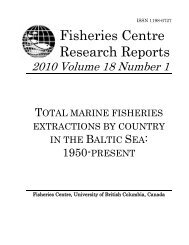
The Democratic Socialist Republic <strong>of</strong> Sri Lanka is an island country southeast <strong>of</strong> India within the Bay <strong>of</strong><br />
Bengal (Figure 1). The climate is tropical with seasonal monsoon and cyclones, but no upwelling. In 2009,<br />
the population was 20 million (Anon, 2009) with 32 percent living in coastal areas (UNEP, 2001). The Sri<br />
Lankan Exclusivity Economic Zone (EEZ) lies within FAO statistical area 57 (FAO, 2011).<br />
The island was colonized by the Portuguese and the Dutch, but most influentially by the British. Sri Lanka,<br />
or “Ceylon” as it was known prior to 1972, was a strategic military and trade link between West Asia and<br />
Southeast Asia. It acquired independence from the British Empire as the Dominion <strong>of</strong> Ceylon in 1948, just<br />
after World War II. In 1972, Ceylon became a republic and the name was changed back to the pre-colonial<br />
name: Sri Lanka (De Silva, 1981).<br />
Attempts to record <strong>fisheries</strong> data in Sri Lanka may have begun during British rule; however, a rigorous<br />
island-wide attempt to estimate total landings did not start until after independence. Since 1910, general<br />
<strong>fisheries</strong> information was recorded by the resident marine biologist as part <strong>of</strong> an annual <strong>fisheries</strong><br />
administration report. These reports included descriptions <strong>of</strong> traditional <strong>fisheries</strong>, destructive practices,<br />
<strong>fisheries</strong> regulations, results <strong>of</strong> test <strong>fisheries</strong>, policy changes, and financial record keeping; yet,<br />
information regarding landings on the island was incomplete (Pearson, 1911; 1922). By the 1930s, the<br />
importance <strong>of</strong> quantifying total landings was recognized, and by the 1940s, efforts to quantify landings<br />
were well underway with the appointment <strong>of</strong> 12 <strong>fisheries</strong> inspectors (FIs) within 20 <strong>fisheries</strong> districts. In<br />
the early 1950s, the number <strong>of</strong> FIs was increased to 24. The first comprehensive annual report <strong>of</strong> total<br />
landings was published in 1952 by the Department <strong>of</strong> Fisheries (DOF); the reports were, from then on,<br />
published annually (reviewed in Sivasubramaniam, 1997).<br />
Records <strong>of</strong> landings in the 1950s focused mainly on the traditional practice <strong>of</strong> beach seining as it<br />
accounted for approximately 40% <strong>of</strong> total landings (Canagaratnam and Medc<strong>of</strong>, 1956). The use <strong>of</strong> the large<br />
beach seine, madella, began in the mid to late 1800s and continued to be the most commonly used<br />
traditional fishing techniques throughout the twentieth century (Alexander, 1977). Gillnetting began in the<br />
195os, and eventually took over as the most widespread fishing method for small-scale fishers. Incidents <strong>of</strong><br />
1 Cite as: O‟Meara, D., Harper, S., Perera, N. and Zeller, D. (2011) Reconstruction <strong>of</strong> Sri Lanka‟s <strong>fisheries</strong> <strong>catches</strong>: 1950-2008. pp. 85-<br />
96. In: Harper, S. and Zeller, D. (eds.) Fisheries catch <strong>reconstruction</strong>. Islands, Part II. Fisheries Centre Research Reports 19(4).<br />
Fisheries Centre, University <strong>of</strong> British Columbia [ISSN 1198-6727].
illegal dynamite fishing and fish poisoning were also reported. The DOF showed great interest at this time<br />
in test <strong>fisheries</strong>, with special attention to experimental dredging for pearl and windowpane oysters, as well<br />
as trawler surveys (Sivalingam, 1961).<br />
Artisanal and traditional <strong>fisheries</strong> in the<br />
1950s could not meet the island‟s domestic<br />
demand for marine fish. Thus, markets<br />
were supplemented with cheap imports <strong>of</strong><br />
predominantly dried fish products from<br />
Pakistan, Japan, and India. Sri Lanka was<br />
not a large exporter <strong>of</strong> marine fish with the<br />
exception <strong>of</strong> a small market in Thailand<br />
and Singapore for shark fins, sea<br />
cucumbers and ornamental shells called<br />
„chanks‟ (Turbinella pyrum). Domestic<br />
marine fish production and export capacity<br />
were limited by poor infrastructure, most<br />
importantly the lack <strong>of</strong> ice and salt at<br />
landing sites, and inefficiencies attributed<br />
to the traditional nature <strong>of</strong> the fishery. In<br />
an attempt to improve upon traditional<br />
methods, the DOF imported nylon nets<br />
and implemented the development <strong>of</strong> a<br />
craft motorization program<br />
(Canagaratnam and Medc<strong>of</strong>, 1956).<br />
Subsidies for 11,000 outboard motors and<br />
the introduction <strong>of</strong> 17-23 foot fibre-<br />
Figure 1. Map <strong>of</strong> Sri Lanka and ts Exclusive Economic Zone.<br />
reinforced plastic (FRP) boats were<br />
credited for the subsequent high annual growth rate <strong>of</strong> Sri Lanka‟s <strong>fisheries</strong> that lasted until the beginning<br />
<strong>of</strong> civil war in 1983 (RAPA, 1989). In the last few decades, there has been an effort to augment pelagic<br />
<strong>fisheries</strong> though government assistance to increase the number <strong>of</strong> multiday vessels capable <strong>of</strong> fishing<br />
<strong>of</strong>fshore and in international waters.<br />
With the aid <strong>of</strong> the FAO, statistical methods again improved in the 1970s with the removal <strong>of</strong> the position<br />
<strong>of</strong> statistical <strong>of</strong>ficer and the appointment <strong>of</strong> an additional 143 FIs, while a new sampling system was also<br />
adopted that utilized landing centers as primary sampling units, and boats as secondary sampling units. In<br />
1981, the National Aquatic Resources Research and Development Agency (NARA) was established with the<br />
mandate to improve research and development, with an emphasis to better understand tuna biology and<br />
catch statistics by way <strong>of</strong> a collaborative effort with the Indo-Pacific Tuna Programme (IPTP), the Bay <strong>of</strong><br />
Bengal Programme (BOBP), the Food and Agriculture Organization (FAO) and the Asian Development<br />
Bank (ADB) (Dayaratne and Maldeniya, 1996). Gillnetting, a practice that had become popular in the<br />
1960s, continued as a favorite <strong>of</strong> Sri Lankan fishers and by the 1970s, was accountable for 60% <strong>of</strong> reported<br />
<strong>fisheries</strong> <strong>catches</strong>.<br />
Shortly after the establishment <strong>of</strong> NARA, civil war broke out between the Liberation Tigers <strong>of</strong> Tamil Eelam<br />
(LITE) and the Government <strong>of</strong> Sri Lanka (GoSL). The effect <strong>of</strong> the war on <strong>fisheries</strong> was considerable,<br />
especially in the north where restrictions (e.g., a ban on outboard motors greater than 40 hp, Maldeniya,<br />
1997b) on fishers were put in place to prevent fuel and weapons from being illegally brought from India by<br />
the LITE. Additionally, the conflict led to the destruction <strong>of</strong> boats, gear, and infrastructure which included<br />
ice making facilities and highways important for fish transport to distant markets (Silucaithsam and<br />
Stokke, 2006). The northern fishing grounds, once responsible for producing over 40% <strong>of</strong> the country‟s<br />
reported landings, were the most productive and accessible fishing grounds in Sri Lanka due to the<br />
presence <strong>of</strong> a large continental shelf and a trawlable bottom (Engvall et al., 1977).<br />
The 1990s saw an increase in reported landings due to improvements in the security situation in some<br />
areas <strong>of</strong> the north and the expansion <strong>of</strong> the fishing fleet <strong>of</strong>fshore and internationally. By the 1990s,<br />
government <strong>of</strong>ficials recognized coastal resources were fully exploited, and efforts were shifted to<br />
expanding the potential <strong>of</strong> deep sea <strong>fisheries</strong> by providing boat and equipment subsidies (Mallikage,
Fisheries catch <strong>reconstruction</strong>s: Islands, Part II. Harper and Zeller 87<br />
2001). For billfish, this was attributed to improvements in gear and the expansion <strong>of</strong> <strong>fisheries</strong> into<br />
<strong>of</strong>fshore and deep sea areas (Maldeniya et al., 1996).<br />
Methods for improvement <strong>of</strong> catch statistics have been made in the 2000s, but overall, they remained the<br />
same since the changes made in 1981. The demand for marine fish has remained high, with a catch that<br />
was insufficient to meet demand. Despite the increase in multiday fishing vessels and other larger craft a<br />
large component <strong>of</strong> the marine fishing fleet continues to consist <strong>of</strong> small FRP boats with outboard motors<br />
as well as non-motorized traditional craft (FAO, 2006). The tsunami in December 2004 seriously affected<br />
90% <strong>of</strong> the fishing community through losses <strong>of</strong> boats, fishing nets, housing, and lives. Eighty percent <strong>of</strong><br />
fishing villages were completely destroyed, along with 12-14 fishing harbors (ITDG, 2005). Post-tsunami<br />
efforts to rebuild <strong>fisheries</strong> have resulted in an overabundance <strong>of</strong> fishing boats in some areas raising<br />
concerns for overfishing (Jayasuriya et al., 2005).<br />
With the end <strong>of</strong> the civil war in 2010, efforts to increase <strong>fisheries</strong> production in the north were a high<br />
priority for the DOF. Growing domestic demand for seafood and the potential for substantial earnings<br />
from seafood exports appear to be the driving force behind current <strong>fisheries</strong> policy, with plans to double<br />
marine <strong>fisheries</strong> production in the future. Apart from increasing landings, <strong>of</strong>fshore <strong>fisheries</strong> have been<br />
identified as a more viable source <strong>of</strong> high value export oriented species such as tuna. The lack <strong>of</strong> adequate<br />
<strong>of</strong>fshore fishing capacity has been seen as a major obstacle to <strong>fisheries</strong> expansion, and there have been<br />
initiatives to allow commercial fishing by foreign vessels in exchange for access fees and prescribed<br />
landings in order to increase domestic fish supply (Anon., 2010).<br />
Small-scale subsistence <strong>fisheries</strong> are <strong>of</strong>ten not considered when collecting <strong>fisheries</strong> statistics; however,<br />
they can constitute a large portion <strong>of</strong> actual <strong>catches</strong> (Zeller et al., 2007). The goal <strong>of</strong> this study was to more<br />
accurately quantify total marine <strong>fisheries</strong> <strong>catches</strong>, by taking into account all <strong>fisheries</strong> sub-sectors and<br />
components, including subsistence catch and discarded bycatch. The importance <strong>of</strong> <strong>fisheries</strong> to the<br />
livelihoods <strong>of</strong> Sri Lankan‟s, particularly coastal dwellers, requires a more comprehensive estimate and<br />
accounting <strong>of</strong> the true magnitude <strong>of</strong> <strong>fisheries</strong> extractions.<br />
METHODS<br />
Total marine <strong>fisheries</strong> <strong>catches</strong> were<br />
estimated using information obtained<br />
from national reports, independent<br />
studies, local experts and grey literature.<br />
Landings data presented by the FAO on<br />
behalf <strong>of</strong> Sri Lanka were compared to<br />
national landings data, and household<br />
surveys were used to estimate total<br />
demand for domestic seafood as compared<br />
to local supply. We also estimated<br />
discarded bycatch for the shrimp trawl and<br />
tuna longline <strong>fisheries</strong>. In this report we<br />
refer to ‟landings‟ as the amount <strong>of</strong> fish<br />
caught, brought to shore and recorded,<br />
while ‟catch‟ refers to the total amount <strong>of</strong><br />
fish caught, and includes Illegal,<br />
Unreported and Unregulated (IUU)<br />
<strong>catches</strong> and discarded bycatch.<br />
Population<br />
Population (x10 6 )<br />
25<br />
20<br />
15<br />
10<br />
5<br />
0<br />
1950 1960 1970 1980 1990 2000<br />
Year<br />
Figure 2: Human population trend for Sri Lanka. Data<br />
source: www.populstat.info and World Bank (Anon, 2009).<br />
Human population data were obtained for the 1950-1959 period from Populstat (www.populstat.info) and<br />
for the 1960-2008 time period from the World Bank (Anon, 2009). Population estimates were used to<br />
derive per capita marine supply and subsistence catch rates. The population <strong>of</strong> Sri Lanka has increased<br />
steadily from 7 million in 1950 to over 20 million in 2008 (Figure 2).
Commercial <strong>fisheries</strong><br />
Total commercial landings for Sri<br />
Lanka were available in nationally<br />
published reports as well as by the<br />
FAO; however, the national data<br />
contained a statistical error causing<br />
landings to be high for years prior to<br />
1970 (Pathirana, 1972); landings<br />
reported to FAO and obtained from<br />
FAO FishStat were lower than<br />
nationally reported landings prior to<br />
1970 (Figure 3). Therefore, it was<br />
assumed that the statistical error in<br />
the national data was accounted for<br />
and corrected in landings presented<br />
in FAO‟s FishStat. Landings<br />
presented by the FAO were also more<br />
complete from 1980-1990, where<br />
national landings data were sparse.<br />
FAO data for crustaceans were<br />
compared to prawn and lobster landings presented by NARA. For the 1994-2002 time period, prawn and<br />
lobster landings were used in place <strong>of</strong> the FAO‟s „miscellaneous marine crustaceans‟ grouping, as they were<br />
deemed to be a better representation <strong>of</strong> total crustacean <strong>catches</strong> (Figure 5). Marine crab <strong>fisheries</strong>, although<br />
known to occur in Sri Lanka, were assumed to be contained within a new, but smaller miscellaneous<br />
crustaceans category as no data was available to determine catch. With the exception <strong>of</strong> the amendment to<br />
crustaceans landings, the remainder <strong>of</strong> the FAO data was considered a good representation <strong>of</strong> commercial<br />
<strong>fisheries</strong> landings, both for the artisanal and industrial sectors. These landings were used as a baseline, to<br />
which we added components not accounted for in the <strong>of</strong>ficially reported data. Noteworthy are two nonfishery<br />
related events which are correlated with a noticeable decrease in landings over the time period<br />
considered; the beginning <strong>of</strong> the civil war in 1983 and the tsunami which occurred on December 26 th,<br />
2004.<br />
Discards<br />
Shrimp trawl <strong>fisheries</strong> are typically associated with considerable bycatch, which can either be landed or<br />
discarded at sea. A study in the late 1970s estimated bycatch associated with the shrimp fishery in two <strong>of</strong><br />
Sri Lanka‟s main shrimp trawling grounds, Jaffna and Mannar (Subasinghe, 1981). The study provided<br />
estimates for both the landed and discarded components <strong>of</strong> the bycatch. Subasinghe (1981) presents<br />
discard rates for both areas, which gave an average rate <strong>of</strong> 10.2 kg <strong>of</strong> discards per kg <strong>of</strong> shrimp landed for<br />
1979 (Discard rates for Mannar and Jaffina were 8.92 and 11.48 kg discarded per kg landed, respectively).<br />
These two regions were responsible for 60% <strong>of</strong> the commercial production <strong>of</strong> shrimp that year<br />
(Subasinghe, 1981; Saila, 1983). Therefore, we assumed that this discard rate was representative <strong>of</strong> Sri<br />
Lanka‟s shrimp trawl <strong>fisheries</strong> and applied the rate <strong>of</strong> 10.2 kg discards per<br />
kg <strong>of</strong> shrimp landed across the entire time period. Discards may have<br />
been even higher in earlier time periods due to greater benthic biomass<br />
and/or less storage capacity on vessels for non-target species; however, to<br />
remain conservative we held the discard rate constant back in time to<br />
1950. For the recent time period, we carried the 1979 discard rate<br />
forward, unaltered, to 2008. This same study reported that over 80% <strong>of</strong><br />
the discarded catch was silverbellies (Leiognathidae); we considered the<br />
remainder to be miscellaneous small pelagic fishes and miscellaneous<br />
sharks.<br />
Depending on the type <strong>of</strong> gear used, bycatch is also <strong>of</strong> concern for tuna<br />
<strong>fisheries</strong>. The majority <strong>of</strong> tuna <strong>catches</strong> in Sri Lanka are skipjack tuna<br />
(Katsuwonus pelamis), representing roughly 60% <strong>of</strong> tuna <strong>catches</strong> and<br />
Catch (t x 10 4 )<br />
14<br />
12<br />
10<br />
8<br />
6<br />
4<br />
2<br />
0<br />
National<br />
1950 1960 1970<br />
Year<br />
Figure 3: Comparison <strong>of</strong> landings data as presented by FAO<br />
and the national data source, indicating the statistical error in<br />
the national data, and its correction in data presented by FAO<br />
on behalf <strong>of</strong> Sri Lanka.<br />
Table 1. Estimated seafood<br />
consumption rates derived from<br />
the Department <strong>of</strong> Census and<br />
Statistics 2007 Household<br />
Income and Expenditure<br />
Survey.<br />
Year Per capita demand<br />
(kg∙person -1 ∙year -1 )<br />
1981 19.39<br />
1986 18.24<br />
1991 14.64<br />
2002 19.86<br />
2005 24.12<br />
2007 24.12<br />
yellowfin tuna (Thunnus albacares), representing approximately 20% <strong>of</strong> the tuna <strong>catches</strong>. Tuna are<br />
predominantly caught using gillnets, although, longlines are becoming increasingly popular for <strong>catches</strong><br />
FAO
Fisheries catch <strong>reconstruction</strong>s: Islands, Part II. Harper and Zeller 89<br />
aimed at the export market (Maldeniya, 1997b). Kelleher (2005) estimates discards by tuna longline in Sri<br />
Lankan waters to be 0.05%. Given that this was a very low discard rate, and given that we were unable to<br />
determine the portion <strong>of</strong> the tuna catch taken by longline, we did not estimate this component <strong>of</strong> the<br />
bycatch. As for bycatch associated with the tuna gillnet <strong>fisheries</strong>, information was also quite sparse. Due to<br />
the size <strong>of</strong> the nets used, incidental catch in the tuna gillnet fishery is mainly seerfish, billfish and shark.<br />
Given that these are marketable species, we assumed that the majority <strong>of</strong> the non-targeted catch for the<br />
tuna gillnet fishery was retained and that this portion <strong>of</strong> the catch was accounted for in the landings data.<br />
Subsistence <strong>fisheries</strong><br />
We assumed that the subsistence<br />
component <strong>of</strong> small-scale <strong>fisheries</strong> was<br />
unaccounted for in the reported data. To<br />
estimate this component <strong>of</strong> the total catch,<br />
we calculated the island-wide marine<br />
seafood demand using per capita<br />
consumption data from the 2007<br />
Department <strong>of</strong> Census and Statistics<br />
Household Income and Expenditure Survey<br />
(Anon, 2007); and compared this to the<br />
reported (commercial) landings presented<br />
by the FAO. We considered the difference<br />
between the supply <strong>of</strong> marine products for<br />
human consumption and the demand for<br />
seafood to be the subsistence catch.<br />
The supply <strong>of</strong> marine products available for<br />
consumption by the local population was<br />
estimated as the commercial landings (FAO<br />
data) adjusted for imports and exports (W. Swartz, unpublished data, UBC Fisheries Centre). These<br />
adjusted landings were then converted to per capita supply rates using human population data.<br />
To estimate marine demand, the per capita marine fish consumption was obtained from the 2007 Sri<br />
Lanka Department <strong>of</strong> Census and Statistics Household Income and Expenditure Survey (HIES). A detailed<br />
breakdown <strong>of</strong> per capita consumption <strong>of</strong> marine products was available for 2007 only. The per capita<br />
consumption <strong>of</strong> fish, which included<br />
aquaculture and freshwater products, was<br />
summarized in the 2007 survey for the<br />
years: 1981, 1986, 1991, 2002, and 2005. In<br />
order to remove aquaculture and<br />
freshwater consumption and calculate<br />
marine consumption, we assumed that the<br />
ratio <strong>of</strong> freshwater and aquaculture<br />
consumption to marine fish consumption<br />
remained the same over the entire survey<br />
period. This assumption resulted in a<br />
conservative estimate <strong>of</strong> per capita marine<br />
consumption as aquaculture and<br />
freshwater fish consumption have likely<br />
increased since the 1980s. However, in<br />
order to remain conservative, the amounts<br />
removed were assumed to be proportional<br />
to those in 2007. Conversion factors<br />
Catch (t x 10) 3<br />
Catch (t x 10 4 )<br />
35<br />
30<br />
25<br />
20<br />
15<br />
10<br />
provided by the FAO for Indonesia (FAO, 2000) were used to convert product weight from the 2007 HIES<br />
into live weight. The resulting per capita seafood consumption rates for 1981, 1986 and 2007 were used as<br />
anchor points to derive a complete time series <strong>of</strong> consumption rates for the 1950-2008 study period (Table<br />
1). We did not use the 1991 and 2002 estimates <strong>of</strong> per capita consumption since these points exactly<br />
matched FAO reported landings when they were multiplied by the human population. These points were<br />
likely estimates <strong>of</strong> per caput consumption (reported landings divided by the population) and hence left out<br />
5<br />
0<br />
Artisanal<br />
1950 1960 1970 1980 1990 2000<br />
Year<br />
Industrial<br />
Figure 4: Total commercial <strong>fisheries</strong> <strong>catches</strong> for Sri Lanka,<br />
separated by industrial and artisanal <strong>fisheries</strong>, 1950-2008.<br />
18<br />
16<br />
14<br />
12<br />
Add-on<br />
10<br />
8<br />
6<br />
4<br />
2<br />
0<br />
Marine Crustaceans<br />
1950 1960 1970 1980 1990 2000<br />
Year<br />
Figure 5: Reported landings <strong>of</strong> marine crustaceans (light<br />
colour) and the additional estimated <strong>catches</strong> during the<br />
1990s and early 2000s.
<strong>of</strong> the analysis. We assumed that the consumption rate in 1950 was the same as that in the 1980s, and<br />
therefore carried the 1981 rate <strong>of</strong> 19.39 kg∙person -1∙year -1 back, unaltered to 1950. The 2007 estimate was<br />
carried forward to 2008. Years between anchor points were interpolated linearly. Finally, we subtracted<br />
the per capita marine supply (FAO landings adjusted for imports and exports) from the total per capita<br />
seafood demand to determine the per capita subsistence catch rate. Human population data were then<br />
used to convert per capita subsistence catch rates into total subsistence catch amounts. This calculation<br />
was not done for 2005 since, although the 2005 consumption estimate was thought to be reasonable, the<br />
reported landings were low due to the tsunami, which was likely the result <strong>of</strong> both fewer <strong>catches</strong> and poor<br />
reporting. The subsistence catch rate for the year following the tsunami (2005) was estimated by linear<br />
interpolation between the 2004 and 2006<br />
subsistence catch rates and then was reduced<br />
by the same percent decline in catch (42%) as<br />
reported by the FAO for landings between the<br />
years 2004 and 2005. It is possible that<br />
subsistence was underestimated for anchor<br />
points following the beginning <strong>of</strong> civil conflict<br />
in 1983 as it is unlikely surveys included<br />
regions at war. The 2007 HIES states that<br />
Trincomalee and the Northern Province,<br />
known for high marine productivity and<br />
possibly higher per capita consumption, were<br />
not sampled in 2007 due to active conflict in<br />
these areas; consequently, it is likely the per<br />
capita consumption and hence the<br />
subsistence catch estimates are conservative.<br />
Subsistence <strong>catches</strong> were assumed to be composed <strong>of</strong> small pelagic species (50%), demersal species (40%)<br />
and invertebrates such as crabs and cephalopods (10%). The small pelagic species caught were mainly<br />
clupeids and scombrids, with the most common species being Sardinella gibbosa, S. albella, Amblygaster<br />
sirm, A. clupeoides, Rastrelliger kanagurta, and Auxis thazard. Demersal species <strong>catches</strong> were mainly<br />
represented by Lethrinidae, Carangidae, Myliobatidae, Sciaenidae, Haemulidae, Leognathidae, and<br />
Acanthuridae (Canagaratnam and Medc<strong>of</strong>, 1956; Maldeniya, 1997a; MFAR, 2008). Industrial and<br />
artisanal <strong>catches</strong> were also improved for FAO “crustaceans nei” utilizing assumptions based on<br />
Jayawardane et al. (2003). The species breakdowns for lobster and sea cucumbers were also improved<br />
based on local expert opinion (N. Perera, pers. obs., Linnaeus University)<br />
Other IUU components<br />
While <strong>catches</strong> <strong>of</strong> sea cucumbers and sharks are reported in the <strong>of</strong>ficial landings data, they are likely underestimates.<br />
Unreported <strong>catches</strong> <strong>of</strong> sea cucumbers and sharks are common in Sri Lankan waters; however,<br />
data on these were not readily available. Although we were unable to account for this unreported<br />
component as part <strong>of</strong> the reconstructed catch, it should be noted that IUU fishing is known to occur in Sri<br />
Lanka and should be further investigated (P. Ganapathiraju, pers. comm., UBC Fisheries Centre).<br />
RESULTS<br />
Commercial <strong>fisheries</strong><br />
Catch (t x 10 3 )<br />
Total marine <strong>fisheries</strong> <strong>catches</strong> by the commercial sector (artisanal and industrial) were estimated to be 8.4<br />
million tonnes over the 1950-2007 time period (Figure 4). Catches in 1950 were approximately 20,000<br />
t∙year -1 and increased steadily to over 300,000 t∙year -1 in 2004. This was followed by a substantial<br />
decrease in <strong>catches</strong> to around 15,000 tonnes in 2005, the year after the tsunami devastated Sri Lanka.<br />
Total commercial <strong>catches</strong> were composed <strong>of</strong> small- (artisanal) and large-scale (industrial) sectors, which<br />
represented 55% and 44%, respectively <strong>of</strong> the total commercial catch. The total commercial catch included<br />
over 50,000 tonnes <strong>of</strong> additional crustaceans, which were not represented in the reported landings as<br />
presented by FAO (Figure 5). Catches <strong>of</strong> marine crustaceans were estimated to be 320,000 tonnes for the<br />
period 1950-2008. These were mainly shrimp (75%) and lobster (9%), with the remainder being<br />
160<br />
140<br />
120<br />
100<br />
80<br />
60<br />
40<br />
20<br />
0<br />
1950 1960 1970 1980 1990 2000<br />
Year<br />
Figure 6: Reconstructed total subsistence <strong>catches</strong> for<br />
Sri Lanka, 1950-2008.
Fisheries catch <strong>reconstruction</strong>s: Islands, Part II. Harper and Zeller 91<br />
miscellaneous marine crustaceans.<br />
Discards associated with the shrimp trawl<br />
fishery were estimated over the study<br />
period to be approximately 2.4 million<br />
tonnes (Figure 8).<br />
Subsistence Fisheries<br />
Total <strong>catches</strong> by the subsistence sector<br />
were estimated to be over 7 million tonnes<br />
from 1950-2008 (Figure 6). Subsistence<br />
<strong>catches</strong> remained relatively stable over the<br />
entire study period with an average annual<br />
catch <strong>of</strong> around 120,000 t·year -1 (Figure<br />
8). A decrease in subsistence <strong>catches</strong> was<br />
observed for the late 1970s and early<br />
1980s, but they increased again after that.<br />
Total reconstructed catch<br />
The total reconstructed catch <strong>of</strong> marine<br />
<strong>fisheries</strong> in Sri Lanka was estimated to be<br />
almost 18 million tonnes over the 1950-<br />
2008 time period (Figure 7). This estimate<br />
<strong>of</strong> total <strong>catches</strong> was 2.13 times larger than<br />
the landings <strong>of</strong>ficially reported by Sri<br />
Lanka to the FAO. Reported landings, as<br />
presented by the FAO on behalf <strong>of</strong> Sri<br />
Lanka were 8.4 million tonnes. The<br />
subsistence catch represented 40% and<br />
discards represented 13% <strong>of</strong> the total<br />
estimated catch (Figure 8). The remainder<br />
<strong>of</strong> the total catch was from the artisanal<br />
(26%) and industrial (21%) sub-sectors <strong>of</strong><br />
commercial <strong>fisheries</strong>. The estimate for<br />
commercial catch was almost entirely<br />
based on reported landings, while the<br />
subsistence and discards were entirely<br />
unreported components. Major<br />
contributing taxa in the reconstructed<br />
catch included silverbellies<br />
(Leiognathidae), skipjack tuna<br />
(Katsuwonus pelamis), herrings,<br />
sardines, and anchovies (Clupeoids), jacks<br />
(Carangidae), and yellowfin tuna<br />
(Thunnus albacares; Figure 9).<br />
DISCUSSION<br />
Total marine <strong>fisheries</strong> <strong>catches</strong> for Sri<br />
Lanka were estimated to be approximately<br />
18 million tonnes over the 1950-2008<br />
time period. This estimate was over 2<br />
times larger than the landings reported by<br />
Sri Lanka to the FAO, which was<br />
Catch (t x 10 4 )<br />
Catch (t x 10 3 )<br />
Catch (t x 10 4 )<br />
600<br />
500<br />
400<br />
300<br />
200<br />
100<br />
Year<br />
Figure 8: Total reconstructed <strong>catches</strong> for Sri Lanka by<br />
component or <strong>fisheries</strong> sector, 1950-2008.<br />
60<br />
50<br />
40<br />
30<br />
20<br />
10<br />
0<br />
0<br />
60<br />
50<br />
40<br />
30<br />
20<br />
10<br />
0<br />
1950 1960 1970 1980 1990 2000<br />
Clupeoids<br />
Leiognathidae<br />
Clupeidae<br />
Total reconstructed catch<br />
Artisanal<br />
Discards<br />
Supplied to FAO<br />
1950 1960 1970 1980 1990 2000<br />
Year<br />
Figure 7: Total reconstructed <strong>catches</strong> compared to the data<br />
submitted by Sri Lanka to FAO, 1950-2008.<br />
Subsistence<br />
Carangidae<br />
Thunnus albacares<br />
Katsuwonus pelamis<br />
Others<br />
Industrial<br />
Scomber spp.<br />
1950 1960 1970 1980 1990 2000<br />
Year<br />
Figure 9: Total reconstructed <strong>catches</strong> with main taxa<br />
caught. All other taxa (88 total) were grouped into „Others‟<br />
category.<br />
approximately 8.4 million tonnes. This large discrepancy indicates a clear need for improvements in the<br />
collection and reporting <strong>of</strong> <strong>fisheries</strong> statistics in Sri Lanka. Our investigation into the <strong>fisheries</strong> <strong>of</strong> Sri Lanka<br />
revealed that information on subsistence <strong>fisheries</strong>, discarded bycatch and other IUU components was<br />
quite limited, even though these <strong>fisheries</strong> components contributed substantially to overall marine <strong>fisheries</strong>
<strong>catches</strong>. Subsistence <strong>fisheries</strong> <strong>catches</strong> were the largest unreported component <strong>of</strong> the catch, and<br />
represented 40% <strong>of</strong> the total reconstructed catch.<br />
Discards from the shrimp trawl fishery were also a substantial contributor (13%) to the total catch, and<br />
was unaccounted for in the <strong>of</strong>ficial data. The high rate <strong>of</strong> discarding in Sri Lankan shrimp trawl <strong>fisheries</strong><br />
has been attributed to the limited cold storage facilities on multi-day boats. Economically important<br />
species are <strong>of</strong>ten stored while other less valuable species are discarded. However, the majority <strong>of</strong> the<br />
bycatch consists <strong>of</strong> low-valued species <strong>of</strong> Leiognathidae, which are typically discarded (Subasinghe, 1981).<br />
Tuna longline <strong>fisheries</strong>, on the other hand, have a much lower discard rate (0.05%) according to Kelleher<br />
(2005). This low rate <strong>of</strong> discarding is thought to be due to fishers targeting and landing multiple species <strong>of</strong><br />
high economic importance, thus reducing the amount <strong>of</strong> discarded fish (Kelleher, 2005). Beach seining in<br />
the early period (1950s) was reported to have few discards, with the exception <strong>of</strong> jellyfish which were<br />
known to seasonally clog nets (Canagaratnam and Medc<strong>of</strong>, 1956).<br />
The year following the tsunami, reported landings were significantly lower, even though seafood<br />
consumption remained constant. Although DOF <strong>of</strong>fices were badly damaged by the tsunami and efforts<br />
were directed into emergency measures rather than accounting for landings, it is likely <strong>catches</strong> also<br />
decreased, especially in small-scale and subsistence <strong>fisheries</strong> as they sustained a large amount <strong>of</strong> damage.<br />
An assessment <strong>of</strong> the impacts <strong>of</strong> the tsunami on coastal fishers suggested that fishing pressure may have<br />
initially decreased in 2005, but then increased to pre-tsunami levels caused by excessive replacement gear<br />
and vessels donated to local fishers as part <strong>of</strong> the relief effort (De Silva and Yamao, 2007).<br />
Illegal, unreported and unregulated <strong>fisheries</strong> are known to occur in Sri Lankan waters. For example, the<br />
transshipments <strong>of</strong> shark fins caught in Sri Lanka‟s EEZ occur regularly. Most Sri Lankan vessels lack<br />
adequate refrigeration capacity and will therefore trade sacks <strong>of</strong> shark fins to foreign vessels at sea, which<br />
allows them to empty their hold and continue fishing while at sea. Such <strong>catches</strong> are not included in any<br />
reporting mechanism. Sri Lankan vessels also participate in the poaching <strong>of</strong> sharks and sea cucumbers,<br />
which are caught illegally outside <strong>of</strong> Sri Lanka‟s EEZ in the poorly regulated waters <strong>of</strong> Somalia,<br />
Madagascar, and the Seychelles, and are then landed in Sri Lanka. These <strong>catches</strong> are reported as domestic<br />
landings, but this is not necessarily the case. A lack <strong>of</strong> enforcement and proper reporting has allowed these<br />
IUU <strong>fisheries</strong> to continue and possibly expand over time (P. Ganapathiraju, pers. comm., UBC Fisheries<br />
Centre). Additionally, foreign vessels, in particular Indian vessels, engage in illegal fishing within Sri<br />
Lanka‟s EEZ and these <strong>catches</strong> are not reported for Sri Lanka.<br />
Previous attempts to estimate the potential sustainable yield in Sri Lankan waters suggested harvest rates<br />
<strong>of</strong> 250,000 t∙year -1, with around 80,000 t allocated to demersal species <strong>catches</strong> and 170,000 t for pelagic<br />
species (RAPA, 1989). Our reconstructed <strong>catches</strong> indicate that this level was likely surpassed as far back as<br />
1974. In this study we highlighted the lack <strong>of</strong> proper accounting for total <strong>fisheries</strong> <strong>catches</strong>, which in the<br />
case <strong>of</strong> the subsistence sector accounted for almost half <strong>of</strong> the domestic marine food supply. Without a<br />
realistic estimate <strong>of</strong> what is being extracted, <strong>fisheries</strong> are likely to be mismanaged and possibly<br />
overexploited. Although human and financial resources may not be available to establish and maintain in<br />
depth monitoring programs, regular surveys conducted every few years have been found to be very<br />
effective in estimating subsistence and small-scale catch in other developing countries (Brouwer et al.,<br />
1997; Zeller et al., 2006).<br />
ACKNOWLEDGMENTS<br />
We thank the <strong>Sea</strong> <strong>Around</strong> <strong>Us</strong> <strong>Project</strong>, a collaboration between the University <strong>of</strong> British Columbia and the<br />
Pew Environment Group. The present work was funded by FAO through the Bay <strong>of</strong> Bengal Large Marine<br />
Ecosystem <strong>Project</strong> (www.boblme.org/). We thank Rudolf Hermes (FAO-BOBLME) for critical comments.<br />
REFERENCES<br />
Alexander, P. (1977) <strong>Sea</strong> Tenure in Southern Sri Lanka. Ethnology 16 (3): 231-251.<br />
Anon (2007) Household income and expenditure survey. Sri Lanka Ministry <strong>of</strong> Finance and Planning- Department <strong>of</strong><br />
Census and Statistics, Colombo, 117 p.<br />
Anon (2009) World Bank: World Databank. http://data.worldbank.org/country/<strong>sri</strong>-lanka Accessed: Nov 4, 2010.
Fisheries catch <strong>reconstruction</strong>s: Islands, Part II. Harper and Zeller 93<br />
Anon. (2010) Saudi Arabia to fish in Sri Lankan waters. ColomboPage.<br />
http://www.colombopage.com/archive_10C/Nov28_1290968294KA.php.<br />
Brouwer, S.L., Mann, B.Q., Lamberth, S.J., Sauer, W.H.H. and Erasmus, C. (1997) A survey <strong>of</strong> the South African<br />
shore- angling fishery. South African Journal <strong>of</strong> Marine Science: 165-175.<br />
Canagaratnam, P. and Medc<strong>of</strong>, J.C. (1956) Bulletin No. 4: Ceylon's Beach Seine Fishery The Fisheries Research<br />
Station, Ceylon.<br />
Dayaratne, P. and Maldeniya, R. (1996) Status report on the development <strong>of</strong> tuna research and data collection<br />
National Aquatic Resources Agency. Colombo, Sri Lanka.<br />
ftp://ftp.fao.org/fi/CDrom/IOTC_Proceedings(1999-<br />
2002)/files/proceedings/miscellaneous/ec/1996/EC604-01.pdf. Accessed: Jan 10, 2010. 4 p.<br />
De Silva, D. and Yamao, M. (2007) Effects <strong>of</strong> the tsunami on <strong>fisheries</strong> and coastal livelihood: a case study <strong>of</strong> tsunamiravaged<br />
southern Sri Lanka. Disasters 31 (4): 386-404.<br />
De Silva, K.M. (1981) The V.O.C in Sri Lanka: The Last Phase 1767-1796. Pp 609. In A History <strong>of</strong> Sri Lanka. C. Hurst &<br />
Company Ltd.<br />
Engvall, L.O., Ratcliffe, C. and Scheepens, T.J. (1977) Assessment <strong>of</strong> problems and needs in marine small-scale<br />
<strong>fisheries</strong>. Ministry <strong>of</strong> Fisheries. Development <strong>of</strong> small-scale <strong>fisheries</strong> in Southwest Asia.<br />
ftp://ftp.fao.org/docrep/fao/006/ad739e/ad739e08.pdf [Accessed: August 24, 2010]. Colombo, p1-9 p.<br />
FAO (2000) Conversion factors - landed weight to live weight. FAO Fisheries Circular No.847, Revision no. 1, Rome,<br />
176 p.<br />
FAO (2006) Fishery Country Pr<strong>of</strong>ile- Sri Lanka. fao.org/fi/oldsite/FCP/en/LKA/pr<strong>of</strong>ile.htm. Accessed: June 24, 2010.<br />
FAO (2011) FAO major fishing areas. FAO Fisheries and Aquaculture Department.<br />
http://www.fao.org/fishery/area/search/en Accessed: Jan 24, 2011.<br />
ITDG (2005) Rebuilding <strong>fisheries</strong> livelihoods in Sri Lanka post-tsunami. Intermediate Technology Development<br />
Group (ITDG). http://practicalaction.org/docs/region_south_asia/rebuilding-<strong>fisheries</strong>-livelihoods-<br />
(draft).pdf. Accessed: Feb 14, 2011.<br />
Jayasuriya, S., Steele, P., Weerakoon, D., Knight-John, M. and Arunatilake, N. (2005) Post-tsunami recovery: issues<br />
and challenges in Sri Lanka. The Institute <strong>of</strong> Policy Studies (IPS) <strong>of</strong> Sri Lanka and the Asian Development<br />
Bank Institute (ADBI) and the Asian Economics Centre, University <strong>of</strong> Melbourne.<br />
http://www.ips.lk/news/newsarchive/2005/01122005_p_tsun/tsunami_recovery.pdf. Accessed: Feb 14,<br />
2011.<br />
Jayawardane, P.A.A.T., Mclusky, D.S. and Tytler, P. (2003) Population bynamics <strong>of</strong> Metapenaeus dobsoni from the<br />
western coastal waters <strong>of</strong> Sri Lanka. Fisheries Management and Ecology 10: 179-189.<br />
Kelleher, K. (2005) Discards in the world's marine <strong>fisheries</strong>. FAO Fisheries Technical Paper 31-32, 111 p.<br />
Maldeniya, R. (1997a) The coastal <strong>fisheries</strong> <strong>of</strong> Sri Lanka: resources, exploitation, and managment. In Silvestre, G. and<br />
Pauly, D., (eds.), Status and Management <strong>of</strong> Tropical Coastal Fisheries in Asia. Asian Development Bank,<br />
Makati CIty.<br />
Maldeniya, R. (1997b) Small boat tuna longline fishery north-west coast <strong>of</strong> Sri Lanka. National Aquatic Resources<br />
Agency (NARA), Colombo. ftp://ftp.fao.org/fi/CDrom/IOTC_Proceedings(1999-<br />
2002)/files/proceedings/miscellaneous/ec/1996/EC602-04.pdf. Accessed: Jan 27, 2011.<br />
Maldeniya, R., Dayaratne, P. and Amarasooriya, P.D.K.D. (1996) An analysis <strong>of</strong> billfish landings in the pelagic<br />
<strong>fisheries</strong> in Sri Lanka. National Aquatic Resources Agency, Colombo.<br />
ftp://ftp.fao.org/fi/CDrom/IOTC_Proceedings(1999-<br />
2002)/files/proceedings/miscellaneous/ec/1996/EC602-31.pdf. Accessed: Jan 10, 2010.<br />
Mallikage, M. (2001) The effect <strong>of</strong> different cooling system on quality <strong>of</strong> pelagic species. Department <strong>of</strong> Fisheries and<br />
Aquatic Resources, Colombo, 34 p.<br />
MFAR (2008) Major marine fish types by commercial group. Ministry <strong>of</strong> Fisheries and Aquatic Resources.<br />
http://www.<strong>fisheries</strong>.gov.lk/Data/Fish%20Types.pdf. Accessed: January 27, 2011.<br />
Pathirana, W. (1972) Administration report <strong>of</strong> the acting director <strong>of</strong> <strong>fisheries</strong> for 1969-1970. Ceylon Government<br />
Press, Colombo. 146 p.<br />
Pearson, J. (1911) Report <strong>of</strong> the marine biologist for 1910-11. Ceylon administration reports: part IV- education,<br />
science and art., Colombo.<br />
Pearson, J. (1922) Report <strong>of</strong> the government marine biologist for 1922. Ceylon administration reports, Colombo.<br />
RAPA (1989) Marine fishery production in the Asia-Pacific Region- Sri Lanka. Regional <strong>of</strong>fice for Asia and the Pacific<br />
(RAPA) Food and Agricultural Organization (FAO) <strong>of</strong> the United Nations, Bangkok.<br />
Saila, S.B. (1983) Importance and assessment <strong>of</strong> discards in commercial <strong>fisheries</strong>. FAO Fisheries Circular 765: 62.<br />
Silucaithsam, A.S. and Stokke, K. (2006) Fisheries under fire: Impacts <strong>of</strong> war and challenges <strong>of</strong> <strong>reconstruction</strong> and<br />
development in Jaffina <strong>fisheries</strong>, Sri Lanka. Norsk Geografisk Tidsskrift- Norwegian Journal fo Geography<br />
60: 240-248.
Sivalingam, S. (1961) The 1958 Pearl Oyster Fishery, Gulf <strong>of</strong> Mannar. Ceylon Fisheries Research Bulletin No 11. 28 p.<br />
Sivasubramaniam, K. (1997) One hundred years <strong>of</strong> <strong>fisheries</strong> management in Sri Lanka: lessons for the future. The<br />
department <strong>of</strong> Fisheries and Aquatic Resources, Colombo. 156p.<br />
Subasinghe, S. (1981) Fish By-catch...Bonus From the <strong>Sea</strong>- Sri Lanka. 141-142.<br />
UNEP (2001) Sri Lanka state <strong>of</strong> the environment report: coastal resources. United Nations Environment Programme.<br />
http://www.rrcap.unep.org/pub/soe/<strong>sri</strong>lankasoe.cfm. Accessed: Nov 3rd, 2010.<br />
Zeller, D., Booth, S., Craig, P. and Pauly, D. (2006) Reconstruction <strong>of</strong> coral reef <strong>fisheries</strong> <strong>catches</strong> in American Samoa,<br />
1950-2002. Coral Reefs 25: 144-152.<br />
Zeller, D., Booth, S., Gerald, D. and Pauly, D. (2007) Re-estimation <strong>of</strong> small-scale fishery <strong>catches</strong> for U.S. flagassociated<br />
island areas in the western Pacific: the last 50 years. Fishery Bulletin 105: 266-267.
Fisheries catch <strong>reconstruction</strong>s: Islands, Part II. Harper and Zeller 95<br />
Appendix Table 1. FAO reported landings vs. total reconstructed catch<br />
for Sri Lanka, 1950-2008, in metric tonnes.<br />
Year FAO landings (t) Total reconstructed catch (t)<br />
1950 20,622 151,813<br />
1951 24,103 156,210<br />
1952 24,709 158,421<br />
1953 25,016 160,496<br />
1954 26,433 166,998<br />
1955 27,265 166,716<br />
1956 32,702 176,616<br />
1957 29,638 172,670<br />
1958 35,737 185,640<br />
1959 40,434 189,190<br />
1960 50,775 198,438<br />
1961 59,717 206,182<br />
1962 71,137 227,544<br />
1963 71,256 222,926<br />
1964 87,796 259,676<br />
1965 68,836 222,888<br />
1966 72,083 230,049<br />
1967 78,225 238,398<br />
1968 93,080 245,640<br />
1969 91,936 255,295<br />
1970 83,855 242,466<br />
1971 69,074 224,345<br />
1972 85,438 243,631<br />
1973 93,972 247,627<br />
1974 96,608 264,940<br />
1975 99,110 273,005<br />
1976 122,870 302,695<br />
1977 126,000 295,302<br />
1978 142,768 319,436<br />
1979 150,934 310,821<br />
1980 167,594 320,543<br />
1981 179,398 348,908<br />
1982 184,664 374,713<br />
1983 183,005 352,116<br />
1984 137,909 302,847<br />
1985 158,065 298,884<br />
1986 159,437 298,798<br />
1987 164,998 307,197<br />
1988 175,347 320,621<br />
1989 183,773 331,133<br />
1990 159,173 305,788<br />
1991 193,989 349,006<br />
1992 189,939 360,916<br />
1993 219,447 390,223<br />
1994 240,307 381,993<br />
1995 222,170 399,668<br />
1996 242,031 411,686<br />
1997 248,790 419,199<br />
1998 259,746 443,709<br />
1999 288,301 449,153<br />
2000 284,314 483,307<br />
2001 265,749 428,117<br />
2002 271,927 432,235<br />
2003 302,082 524,880<br />
2004 303,168 533,482<br />
2005 160,142 251,821<br />
2006 239,292 432,512<br />
2007 270,176 468,803<br />
2008 285,028 503,501
Appendix Table 2. Total reconstructed catch (t) by major taxa for Sri Lanka, 1950-2008. Clupeoids include<br />
herrings, sardines, and anchovies. Others includes 86 taxa<br />
Year Leiognathidae Clupeoids Katsuwonus Clupeidae Thunnus Carangidae Scomber Others<br />
pelamis<br />
albacares<br />
spp.<br />
1950 10,457 8,000 771 12,715 774 2,543 0 116,553<br />
1951 10,511 8,000 890 12,807 1,150 2,561 0 120,290<br />
1952 11,125 9,000 807 12,887 903 2,577 0 121,122<br />
1953 11,748 7,100 723 12,983 655 3,697 0 123,591<br />
1954 14,638 9,500 720 13,087 606 4,717 0 123,730<br />
1955 13,537 11,600 717 13,137 557 4,027 0 123,140<br />
1956 16,390 18,300 981 13,180 720 3,436 0 123,609<br />
1957 15,303 14,100 1,245 13,253 883 3,351 0 124,536<br />
1958 19,852 14,900 1,410 13,294 970 4,859 0 130,356<br />
1959 18,749 17,000 1,576 13,341 1,055 5,968 0 131,502<br />
1960 19,200 20,400 2,063 13,151 1,347 7,030 0 135,247<br />
1961 18,094 28,400 2,551 13,192 1,639 6,838 0 135,467<br />
1962 24,895 31,500 3,960 13,217 2,493 8,443 0 143,036<br />
1963 21,509 22,400 5,369 13,228 3,348 9,846 0 147,226<br />
1964 35,647 36,300 5,227 13,230 3,222 10,146 0 155,905<br />
1965 23,203 24,200 5,084 13,224 3,096 6,545 3,000 147,536<br />
1966 26,023 24,300 5,830 13,212 3,515 6,342 3,000 150,828<br />
1967 27,706 20,000 6,576 13,190 3,931 8,638 3,000 158,357<br />
1968 22,596 27,500 7,448 13,156 4,416 8,631 3,000 161,893<br />
1969 30,482 21,700 8,322 13,105 4,901 8,621 4,000 168,164<br />
1970 27,612 22,300 6,554 13,034 3,841 9,007 3,600 160,118<br />
1971 25,861 18,400 4,785 12,942 2,783 7,588 5,100 151,986<br />
1972 28,621 20,100 8,250 12,830 4,266 7,566 6,200 161,997<br />
1973 26,281 20,600 9,919 12,700 5,244 8,440 4,900 164,443<br />
1974 37,502 24,900 8,792 12,552 4,610 11,610 4,300 164,974<br />
1975 42,447 32,530 6,937 12,387 3,771 8,637 7,994 166,294<br />
1976 47,751 38,541 12,392 12,207 6,908 10,076 11,018 174,819<br />
1977 41,644 46,278 11,583 12,010 5,806 11,192 9,179 166,788<br />
1978 48,182 54,412 12,933 11,795 5,915 12,717 7,747 173,482<br />
1979 37,957 59,276 9,692 11,557 6,555 12,440 13,388 173,344<br />
1980 34,769 69,061 14,117 11,296 7,304 12,307 13,888 171,689<br />
1981 47,292 64,479 15,196 11,151 8,068 12,796 12,906 189,926<br />
1982 63,048 66,764 14,172 10,935 8,682 10,579 11,302 200,533<br />
1983 49,864 70,971 14,649 10,705 9,264 10,726 15,518 185,937<br />
1984 48,481 52,153 12,348 10,465 6,694 12,594 12,773 160,112<br />
1985 33,183 27,682 13,699 10,217 7,160 10,139 13,000 196,803<br />
1986 33,794 28,471 13,697 9,962 7,416 10,319 13,000 195,139<br />
1987 34,848 29,460 14,442 10,108 7,785 10,638 13,000 199,916<br />
1988 36,061 30,608 15,004 10,255 8,089 11,003 13,000 209,601<br />
1989 36,590 31,064 16,500 10,400 8,727 11,165 13,000 216,687<br />
1990 35,154 27,958 19,495 10,543 9,929 9,831 10,500 192,878<br />
1991 40,141 33,426 21,990 10,683 11,934 11,112 12,000 219,721<br />
1992 50,504 35,097 25,786 10,820 14,185 11,112 13,557 213,413<br />
1993 49,542 37,379 29,692 10,951 16,478 13,068 10,854 233,113<br />
1994 26,277 38,870 35,755 11,075 21,045 10,215 16,450 238,756<br />
1995 48,498 49,785 33,915 11,190 16,499 9,148 17,642 230,633<br />
1996 42,941 48,221 41,000 11,296 21,308 8,347 17,700 238,573<br />
1997 42,681 47,200 50,012 11,393 27,094 9,179 20,000 231,641<br />
1998 50,824 50,800 50,124 11,481 26,122 10,796 20,900 243,562<br />
1999 35,840 51,370 64,316 11,562 32,767 10,992 21,350 242,307<br />
2000 59,392 53,250 70,957 11,636 29,512 12,777 22,180 245,783<br />
2001 35,461 49,270 66,692 11,698 26,522 12,290 16,760 226,183<br />
2002 33,768 52,310 64,425 11,786 28,085 13,117 17,250 228,743<br />
2003 79,929 56,390 75,146 11,954 34,425 17,331 17,760 249,705<br />
2004 83,900 54,410 75,795 12,146 35,512 16,009 18,440 255,711<br />
2005 21,620 24,870 44,938 6,489 24,887 7,248 9,680 121,769<br />
2006 55,219 56,230 54,341 12,433 35,842 12,057 15,570 206,391<br />
2007 59,779 63,520 73,240 12,524 32,998 13,885 16,290 212,857<br />
2008 73,544 66,890 78,860 12,618 33,027 13,684 18,260 224,878


![Nacion.com, San José, Costa Rica [Nacionales] - Sea Around Us ...](https://img.yumpu.com/26166123/1/190x245/nacioncom-san-josac-costa-rica-nacionales-sea-around-us-.jpg?quality=85)