Visual Acuity - Optometry in Practice
Visual Acuity - Optometry in Practice
Visual Acuity - Optometry in Practice

You also want an ePaper? Increase the reach of your titles
YUMPU automatically turns print PDFs into web optimized ePapers that Google loves.
<strong>Optometry</strong> <strong>in</strong> <strong>Practice</strong> Vol 5 (2004) 53–70<br />
<strong>Visual</strong> <strong>Acuity</strong><br />
AJ Jackson 1 PhD MCOptom and IL Bailey 2 OD MS FCOptom FAAO<br />
1 2 Department of Ophthalmology, Royal Group of Hospitals, Belfast and School of <strong>Optometry</strong>, University of Berkeley,<br />
CA, USA<br />
Accepted for publication 14 January 2004<br />
Almost 150 years after Herman Snellen (Snellen 1862,<br />
1864), the renowned ophthalmologist from the University<br />
of Utrecht, published his table of optotypes for assess<strong>in</strong>g<br />
the visual status of the eye, we cont<strong>in</strong>ue to utilise optotype<br />
test charts as the ma<strong>in</strong>stay of our cl<strong>in</strong>ical evaluation of<br />
vision. Although the term ‘visual acuity’ is almost<br />
synonymous with the assessment of central visual status,<br />
us<strong>in</strong>g optotypes, it is however more specific and refers to<br />
the ability of the visual system to resolve spatial detail. It<br />
is a measure of the angular size of detail that is just<br />
resolvable by the observer and its limitations are imposed<br />
by a comb<strong>in</strong>ation of optical and neural factors.<br />
Optical Limitations<br />
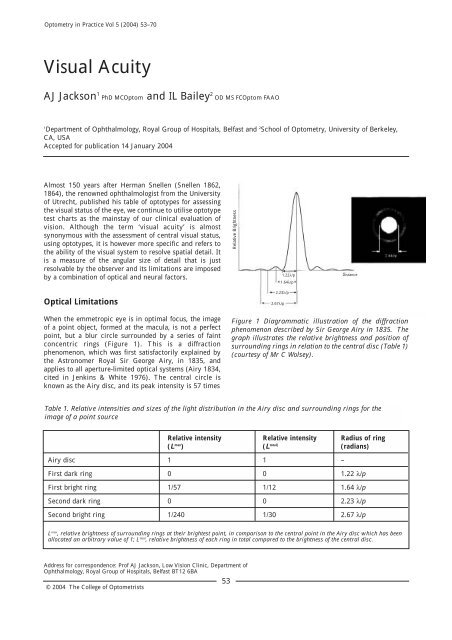
When the emmetropic eye is <strong>in</strong> optimal focus, the image<br />
of a po<strong>in</strong>t object, formed at the macula, is not a perfect<br />
po<strong>in</strong>t, but a blur circle surrounded by a series of fa<strong>in</strong>t<br />
concentric r<strong>in</strong>gs (Figure 1). This is a diffraction<br />
phenomenon, which was first satisfactorily expla<strong>in</strong>ed by<br />
the Astronomer Royal Sir George Airy, <strong>in</strong> 1835, and<br />
applies to all aperture-limited optical systems (Airy 1834,<br />
cited <strong>in</strong> Jenk<strong>in</strong>s & White 1976). The central circle is<br />
known as the Airy disc, and its peak <strong>in</strong>tensity is 57 times<br />
Address for correspondence: Prof AJ Jackson, Low Vision Cl<strong>in</strong>ic, Department of<br />
Ophthalmology, Royal Group of Hospitals, Belfast BT12 6BA<br />
© 2004 The College of Optometrists<br />
53<br />
Figure 1 Diagrammatic illustration of the diffraction<br />
phenomenon described by Sir George Airy <strong>in</strong> 1835. The<br />
graph illustrates the relative brightness and position of<br />
surround<strong>in</strong>g r<strong>in</strong>gs <strong>in</strong> relation to the central disc (Table 1)<br />
(courtesy of Mr C Wolsey).<br />
Table 1. Relative <strong>in</strong>tensities and sizes of the light distribution <strong>in</strong> the Airy disc and surround<strong>in</strong>g r<strong>in</strong>gs for the<br />
image of a po<strong>in</strong>t source<br />
Relative <strong>in</strong>tensity Relative <strong>in</strong>tensity Radius of r<strong>in</strong>g<br />
(L max ) (L total) (radians)<br />
Airy disc 1 1 –<br />
First dark r<strong>in</strong>g 0 0 1.22 λ/p<br />
First bright r<strong>in</strong>g 1/57 1/12 1.64 λ/p<br />
Second dark r<strong>in</strong>g 0 0 2.23 λ/p<br />
Second bright r<strong>in</strong>g 1/240 1/30 2.67 λ/p<br />
L max , relative brightness of surround<strong>in</strong>g r<strong>in</strong>gs at their brightest po<strong>in</strong>t, <strong>in</strong> comparison to the central po<strong>in</strong>t <strong>in</strong> the Airy disc which has been<br />
allocated an arbitrary value of 1; L total , relative brightness of each r<strong>in</strong>g <strong>in</strong> total compared to the brightness of the central disc.<br />
Relative Brightness<br />
1.22λ/p<br />
1.64λ/p<br />
2.23λ/p<br />
2.67λ/p<br />
Distance
AJ Jackson & IL Bailey<br />
brighter than that of the first surround<strong>in</strong>g r<strong>in</strong>g. The angular<br />
size, or radius, of each of the surround<strong>in</strong>g dark and light<br />
r<strong>in</strong>gs is a function of the wavelength of the <strong>in</strong>cident light (λ)<br />
and the pupil diameter (p). In the case of the first dark r<strong>in</strong>g<br />
the diameter, expressed <strong>in</strong> radians, is 1.22 λ/p, where λ and<br />
p are normally expressed <strong>in</strong> millimetres. The diameter of<br />
the first bright r<strong>in</strong>g is 1.64 λ/p radians. In convert<strong>in</strong>g the<br />
measurement from radians to degrees and subsequently to<br />
m<strong>in</strong>utes of arc, one needs to multiply the figure by 57.29<br />
and thereafter by 60 (Table 1).<br />
If the eye were perfectly focused and free of aberrations,<br />
the only optical factor limit<strong>in</strong>g the resolution of the eye<br />
would be diffraction. Apply<strong>in</strong>g the Rayleigh criterion, the<br />
amount of overlap between adjacent blur circles, to render<br />
resolution impossible, would be half the diameter of the<br />
blur circle. At this po<strong>in</strong>t, the centre of one blur circle<br />
would be aligned with the edge of its neighbour. An eye<br />
with a pupil diameter of 4.6mm would thus have a<br />
m<strong>in</strong>imal angle of resolution (MAR) of 0.5m<strong>in</strong> of arc<br />
whereas an eye with a pupil diameter half that size<br />
(2.3mm), would have an MAR of 1m<strong>in</strong> of arc (Bailey<br />
1998). The relationship between pupil size and image<br />
quality is, however, more complex because superimposed<br />
on diffractive blur are degradations <strong>in</strong> image quality due to<br />
optical aberrations. These optical aberrations result from<br />
the shape, alignment and position<strong>in</strong>g of the various optical<br />
surfaces with<strong>in</strong> the eye and variations <strong>in</strong> the refractive<br />
<strong>in</strong>dices and the chromatic dispersion of the optical media.<br />
When the eye views a po<strong>in</strong>t source, it receives a cone of<br />
diverg<strong>in</strong>g rays and the diameter of the <strong>in</strong>cident cone is<br />
limited by pupil size. Because of aberrations, the cone of<br />
rays that converge to form the image on the ret<strong>in</strong>a has an<br />
apex that is imperfectly def<strong>in</strong>ed. Ideally all rays would<br />
converge as a cone to a s<strong>in</strong>gle po<strong>in</strong>t, and with the eye <strong>in</strong><br />
focus, the image po<strong>in</strong>t at the apex of the image cone would<br />
be on the ret<strong>in</strong>a. In reality, for light of a given wavelength,<br />
rays from different parts of the pupil deviate from the ideal<br />
cone pattern, so the image on the ret<strong>in</strong>a is a patch rather<br />
than a po<strong>in</strong>t. The light distribution across the patch is<br />
called the po<strong>in</strong>t spread function and the distribution is<br />
not necessarily symmetrical. In general, rays from the<br />
more peripheral parts of the pupil are more aberrated.<br />
Ret<strong>in</strong>al cones are, however, directionally sensitive, be<strong>in</strong>g<br />
less sensitive to rays that fall upon them obliquely (Stiles<br />
& Crawford 1933). The Stiles–Crawford effect thus<br />
reduces the impact of the aberrational effects associated<br />
with rays from more peripheral parts of the pupil. If the<br />
object is a f<strong>in</strong>e l<strong>in</strong>e, the cross-sectional distribution of light<br />
<strong>in</strong> the image has a bell shape. This is called the l<strong>in</strong>e spread<br />
function. This profile differs from the po<strong>in</strong>t spread<br />
function <strong>in</strong> that it is narrower and it does not have the<br />
noticeable r<strong>in</strong>gs or fr<strong>in</strong>ges.<br />
54<br />
For light of different wavelengths, there will be a<br />
longitud<strong>in</strong>al difference <strong>in</strong> the position of best focus. Shortwavelength<br />
light will have its best focus about 0.5mm<br />
anterior to the best focus for long-wavelength light. This<br />
represents about 1.5D of longitud<strong>in</strong>al chromatic<br />
aberration. The light spread <strong>in</strong> the ret<strong>in</strong>al image depends<br />
on pupil size. Light spread due to diffraction <strong>in</strong>creases as<br />
the pupil becomes smaller. On the other hand, light spread<br />
due to monochromatic and chromatic optical aberrations<br />
is reduced as the pupil becomes smaller. The optimal pupil<br />
size required to balance these effects best is<br />
approximately 2.5mm (Westheimer 1964).<br />
Neural Limitations<br />
A significant neural limitation on visual resolution is<br />
imposed by the anatomical structure of the ret<strong>in</strong>al<br />
photoreceptor layer. In the foveal region, cones are packed<br />
closely together and cones are known to have an average<br />
diameter of about 2µm. It might be expected that, <strong>in</strong> order<br />
for images of two-po<strong>in</strong>t objects to be resolved, they should<br />
fall on two <strong>in</strong>dividual cones separated by a cone which is<br />
not stimulated. The two-po<strong>in</strong>t images should thus be<br />
separated by a distance of 4µm. Assum<strong>in</strong>g the nodal po<strong>in</strong>t<br />
of the eye is 16.67mm from the ret<strong>in</strong>a, then the neural<br />
limit to resolution becomes 0.82m<strong>in</strong> of arc. Other neural<br />
limitations of the system may also be imposed by the<br />
various complex <strong>in</strong>terconnections and <strong>in</strong>teractions<br />
between neurones with<strong>in</strong> the ret<strong>in</strong>a and visual pathways.<br />
Def<strong>in</strong><strong>in</strong>g Resolution<br />
Resolution can be def<strong>in</strong>ed as m<strong>in</strong>imum detectable,<br />
m<strong>in</strong>imum separable or m<strong>in</strong>imum recognisable.<br />
M<strong>in</strong>imum detectable resolution<br />
M<strong>in</strong>imum detectable (or m<strong>in</strong>imum dist<strong>in</strong>guishable)<br />
resolution is the m<strong>in</strong>imum angular size of a spot or the<br />
m<strong>in</strong>imum angular width of a l<strong>in</strong>e necessary for it to be<br />
detected aga<strong>in</strong>st its background. In the case of a spot,<br />
when the diameter of the image formed on the ret<strong>in</strong>a<br />
becomes smaller than the surface area of a s<strong>in</strong>gle<br />
photoreceptor, detection rema<strong>in</strong>s possible as long as the<br />
visual system can recognise that adjacent photoreceptors,<br />
one receiv<strong>in</strong>g the stimulus and one not, have responded<br />
differently. Threshold detection is achievable when the<br />
spot is large enough or has sufficient contrast to create a<br />
detectable elevation or reduction <strong>in</strong> illum<strong>in</strong>ation on the<br />
photoreceptor, <strong>in</strong> comparison to its neighbour. Under<br />
photopic conditions, the differential contrast threshold
ema<strong>in</strong>s a constant ratio, at approximately 1%,<br />
irrespective of overall field lum<strong>in</strong>ance. This phenomenon<br />
forms the basis of Weber’s law (Weber 1834). As light<strong>in</strong>g<br />
levels drop, the threshold contrast ratio between target<br />
spot and its surround must <strong>in</strong>crease by up to 20 times <strong>in</strong><br />
order to enable target detection to take place.<br />
Detectability will also vary as a function of target size,<br />
wavelength and the distribution of lum<strong>in</strong>ance with<strong>in</strong> the<br />
visual field. The m<strong>in</strong>imal dimension of a high-contrast<br />
po<strong>in</strong>t object required for detection is reported to be<br />
between 10 and 35 seconds of arc, whereas for a highcontrast<br />
l<strong>in</strong>e target, the width only needs to be 4–10<br />
seconds of arc (Duke-Elder 1937).<br />
M<strong>in</strong>imum separable resolution<br />
M<strong>in</strong>imum separable resolution is a measure of the<br />
m<strong>in</strong>imum separation between adjacent spots or l<strong>in</strong>es<br />
required for the observer to identify the objects as<br />
separate. This form of resolution is usually assessed us<strong>in</strong>g<br />
grat<strong>in</strong>g targets, the dimensions of which may be expressed<br />
<strong>in</strong> cycles per degree (cpd). In a grat<strong>in</strong>g with a spatial<br />
frequency of 30 cpd, the width of each dark stripe and<br />
each bright stripe will be 1 m<strong>in</strong> of arc. The limit of an eye’s<br />
ability to resolve a high-contrast grat<strong>in</strong>g, and dist<strong>in</strong>guish it<br />
from a uniform field of the same average lum<strong>in</strong>ance, is a<br />
measure of its threshold spatial frequency for m<strong>in</strong>imum<br />
separable resolution. An eye that can just resolve a 30-cpd<br />
grat<strong>in</strong>g can be said to have a MAR of 1 m<strong>in</strong> of arc.<br />
In measur<strong>in</strong>g resolution with grat<strong>in</strong>g targets, there may be<br />
spurious resolution, <strong>in</strong> which the presence of a grat<strong>in</strong>g can<br />
be recognised, even though the perception of the number<br />
of stripes <strong>in</strong> the grat<strong>in</strong>g is erroneous. This can be seen most<br />
easily <strong>in</strong> resolution tests that use sets of three l<strong>in</strong>e grat<strong>in</strong>gs<br />
that have different spatial frequencies (Figure 2).<br />
Hyperacuities<br />
To this po<strong>in</strong>t we have described visual acuity as a measure<br />
of the ability of the eye to detect spatial separation<br />
between details, and that the magnitude of visual acuity is<br />
closely related to the angle between adjacent ret<strong>in</strong>al<br />
receptors. There are, however, some tasks <strong>in</strong> which<br />
<strong>in</strong>formation about location is pooled across many<br />
receptors, allow<strong>in</strong>g spatial discrim<strong>in</strong>ations that are f<strong>in</strong>er<br />
than the m<strong>in</strong>imal separable resolution by a factor of about<br />
10-fold. The term ‘hyperacuity’ is used to describe these<br />
ultraf<strong>in</strong>e spatial discrim<strong>in</strong>ations. Vernier acuity and<br />
stereoacuity are the two best known of the hyperacuities.<br />
When assess<strong>in</strong>g Vernier acuity, the task is to judge<br />
whether two l<strong>in</strong>e segments are <strong>in</strong> l<strong>in</strong>e with each other.<br />
When assess<strong>in</strong>g stereoacuity, the task is to judge whether<br />
one l<strong>in</strong>e segment is closer or further away than another <strong>in</strong><br />
55<br />
<strong>Visual</strong> <strong>Acuity</strong><br />
Figure 2 Resolution and spurious resolution<br />
An illustration of the light distribution with<strong>in</strong> a three-l<strong>in</strong>e<br />
target when the spac<strong>in</strong>g is close to the resolution limit. The<br />
figure depicts the light distribution on the ret<strong>in</strong>a view<strong>in</strong>g an<br />
object that consists of three f<strong>in</strong>e white l<strong>in</strong>es. Due to<br />
diffraction and aberrations, each <strong>in</strong>dividual f<strong>in</strong>e l<strong>in</strong>e creates<br />
an image with a bell-shaped light profile, and each of these<br />
light distributions is called a l<strong>in</strong>e spread function (LSF).<br />
Diffraction and aberrations affect the width and shape of the<br />
LSF.<br />
Bottom: the light distribution of the ret<strong>in</strong>al image when there<br />
is only marg<strong>in</strong>al overlap of the adjacent LSF. The observer<br />
should easily be able to tell there are three l<strong>in</strong>es present.<br />
Middle: the l<strong>in</strong>es have been brought closer together (spatial<br />
frequency has been <strong>in</strong>creased) so there is substantial overlap<br />
between the three LSFs. In the total light distribution of the<br />
image, there are three peaks correspond<strong>in</strong>g to the positions of<br />
the three l<strong>in</strong>es <strong>in</strong> the object. There is only a relatively small<br />
difference between the ret<strong>in</strong>al illum<strong>in</strong>ance at the three peaks<br />
and the two troughs. If this difference (contrast) is sufficient,<br />
the observer will perceive a low-contrast grat<strong>in</strong>g pattern from<br />
the three l<strong>in</strong>es. As the l<strong>in</strong>es are brought a little closer together,<br />
the difference between the ret<strong>in</strong>al illum<strong>in</strong>ance at the peaks<br />
and troughs will be further reduced.<br />
Top: the l<strong>in</strong>es are even closer together. The overlap between<br />
adjacent LSFs is more substantial. Now, summation between<br />
the slop<strong>in</strong>g sides of adjacent LSFs gives rise to peaks <strong>in</strong> the<br />
total light distribution. Here, the sum of the three LSFs gives<br />
two peaks with an <strong>in</strong>terven<strong>in</strong>g trough. The observer may<br />
perceive a striped pattern of low contrast, but it will appear<br />
that there are only two l<strong>in</strong>es present . This is called spurious<br />
resolution. The observer can tell the object has a grat<strong>in</strong>g<br />
structure, but has an erroneous perception of the number of<br />
component l<strong>in</strong>es.
AJ Jackson & IL Bailey<br />
three-dimensional space. Thresholds for these<br />
hyperacuity tasks are commonly <strong>in</strong> the order of 5 seconds<br />
of arc. Other hyperacuity tasks <strong>in</strong>clude recognis<strong>in</strong>g that a<br />
l<strong>in</strong>e is curved rather than straight, discrim<strong>in</strong>at<strong>in</strong>g<br />
deviations from vertical or horizontal, discern<strong>in</strong>g<br />
deviations from parallelism, detect<strong>in</strong>g a bump <strong>in</strong> a l<strong>in</strong>e and<br />
judg<strong>in</strong>g equality of lengths <strong>in</strong> a bisection task.<br />
M<strong>in</strong>imum recognisable resolution<br />
M<strong>in</strong>imum recognisable (or m<strong>in</strong>imum legible) is the term<br />
given to the measurement of acuity us<strong>in</strong>g optotype<br />
symbols. Whereas grat<strong>in</strong>g acuity is often used to<br />
determ<strong>in</strong>e optical performance under laboratory<br />
conditions, most cl<strong>in</strong>ical tests of visual resolution utilise<br />
symbols or optotypes as targets (Figure 3). The optotypes<br />
chosen may, however, be simple or complex. Landolt<br />
r<strong>in</strong>gs, which represent the simplest of targets, were<br />
adopted <strong>in</strong> 1909 by the XI International Ophthalmological<br />
Congress as the standard test object (Landolt 1899,<br />
Woodruff 1947). Each r<strong>in</strong>g is constructed so that its<br />
external diameter is five times greater than its stroke<br />
width, which <strong>in</strong> turn, is equal <strong>in</strong> size to the gap <strong>in</strong> the r<strong>in</strong>g.<br />
Most vision tests us<strong>in</strong>g Landolt r<strong>in</strong>gs simply require the<br />
observer to identify the location of the gap which may be<br />
<strong>in</strong> one of four positions – to the right, left, up or down.<br />
Sometimes obliquely oriented gaps (45º, 135º, 225º and<br />
315º) are <strong>in</strong>cluded, giv<strong>in</strong>g a choice of eight gap<br />
orientations. When test<strong>in</strong>g with Landolt r<strong>in</strong>gs, the patient<br />
need not be familiar with any particular alphabet. The test<br />
is therefore well-suited for test<strong>in</strong>g persons who are<br />
illiterate or who cannot name letters that might otherwise<br />
be used as the optotype. For research purposes, Landolt<br />
r<strong>in</strong>gs may be the preferred optotype because the<br />
resolution task is essentially the same for each of the<br />
alternative gap positions. When us<strong>in</strong>g a comb<strong>in</strong>ation of<br />
letters as optotypes, the observer’s task and decisionmak<strong>in</strong>g<br />
strategies might be quite different from one letter<br />
to another. Tumbl<strong>in</strong>g E (or ‘illiterate E’) charts have been<br />
constructed us<strong>in</strong>g an E optotype with four alternative<br />
orientations. Typically, the E is constructed on a 5 × 5 grid<br />
with each of the three parallel limbs be<strong>in</strong>g one grid-unit<br />
wide. As for the Landolt r<strong>in</strong>g test, the observer’s task is to<br />
identify the orientation of each optotype by <strong>in</strong>dicat<strong>in</strong>g if<br />
the ‘legs’ of the E po<strong>in</strong>t right, left, up or down. Forcedchoice<br />
methodology is often used <strong>in</strong> the assessment of<br />
threshold acuity us<strong>in</strong>g tumbl<strong>in</strong>g Es or Landolt r<strong>in</strong>gs,<br />
especially when used for research purposes.<br />
More traditional visual acuity tests utilise charts with sets<br />
of alphanumeric symbols as optotypes, as this makes the<br />
process of test<strong>in</strong>g simpler and quicker. Individual letter, or<br />
number, optotypes are usually constructed us<strong>in</strong>g either a<br />
56<br />
Serif E 5 × 5 Landolt r<strong>in</strong>g<br />
Sans serif H 5 × 5 Sans serif E 5 × 4<br />
Figure 3<br />
An illustration of the font styles and grid structure of serif<br />
and sans serif letters, the Landolt r<strong>in</strong>g and tumbl<strong>in</strong>g E.<br />
5 × 4 grid, <strong>in</strong> which stroke width measures one-fifth of the<br />
grid height, or a 5 × 5 grid. Snellen’s orig<strong>in</strong>al charts used<br />
letters the stroke width of which were equal to one-fifth of<br />
the letter height. Although most letters were constructed<br />
us<strong>in</strong>g a 5 × 5 grid, some 5 × 6 letters were used (Snellen<br />
1862, 1864). His letters had serifs, which are short l<strong>in</strong>es<br />
added to the ends of the limbs of the letters. S<strong>in</strong>ce Snellen,<br />
there have been numerous variations <strong>in</strong> the design of the<br />
letters and the chart layout. Bennett (1965) reviewed the<br />
history of visual acuity chart design at about the time the<br />
British Standards Institute chose to adopt a set of 10<br />
letters based on a 5 × 4 grid format as the standard<br />
optotypes for cl<strong>in</strong>ical test<strong>in</strong>g of visual acuity (BSI 4274-1<br />
1968). The UK standards have recently been updated <strong>in</strong><br />
such a manner as to <strong>in</strong>troduce log MAR notations and<br />
several other features consistent with log MAR test<strong>in</strong>g<br />
strategies (BSI 4274-1 2003).<br />
Optotype Test Chart Design<br />
S<strong>in</strong>ce the time of Snellen, the practice of express<strong>in</strong>g<br />
central visual status us<strong>in</strong>g measurements obta<strong>in</strong>ed from<br />
optotype charts has been confounded by the proliferation<br />
of charts utilis<strong>in</strong>g different design features. The
assessment of visual acuity us<strong>in</strong>g optotype targets has<br />
become almost synonymous with clarity of vision (Figure<br />
4). Bennett (1965) <strong>in</strong> his extensive review on ophthalmic<br />
test types classified the three pr<strong>in</strong>cipal problems<br />
associated with standardisation as:<br />
1. Selection and style of symbols<br />
2. Progression of sizes of symbols<br />
3. The notation used for express<strong>in</strong>g acuity<br />
Figure 4 In popular perception the test letter chart quickly<br />
became synonymous with the sight test, as demonstrated by<br />
the cartoonist Sidney Strube (1891–1956) <strong>in</strong> this newspaper<br />
draw<strong>in</strong>g from 1938. The Prime M<strong>in</strong>ister, Neville<br />
Chamberla<strong>in</strong>, is portrayed as an ophthalmic optician whose<br />
sum total of equipment consists of an electrically<br />
illum<strong>in</strong>ated screen chart, a simple drop-cell trial frame and<br />
case of trial lenses. The <strong>in</strong>ability of the govern<strong>in</strong>g MPs<br />
(portrayed as the British lion <strong>in</strong> a school cap) to read the<br />
smallest letter<strong>in</strong>g is <strong>in</strong>tended as a symbol for their failure to<br />
focus on what supporters of Appeasement felt to be a more<br />
important issue <strong>in</strong> a country still recover<strong>in</strong>g from the effects<br />
of the great economic slump. Mother, <strong>in</strong> the form of W<strong>in</strong>ston<br />
Churchill, dressed somewhat ridiculously as Britannia, sits<br />
<strong>in</strong> on the test <strong>in</strong> a position of splendid isolation across the<br />
room. All may not be as it seems, however. As Strube was a<br />
fanatical anti-Nazi and favourite of Churchill it is possible<br />
that the artist’s <strong>in</strong>tention is to illustrate the priority of the<br />
more easily seen letters (courtesy of Mr Neil Handley MA<br />
AMA, Curator British Optical Association Museum, College<br />
of Optometrists, London).<br />
© The Daily Express<br />
The orig<strong>in</strong>al sketch for this cartoon, <strong>in</strong> which Chamberla<strong>in</strong><br />
is described as an ‘oculist’, is <strong>in</strong> the collection of the BOA<br />
Museum at the College of Optometrists.<br />
57<br />
Symbol selection<br />
<strong>Visual</strong> <strong>Acuity</strong><br />
Not all letters are of equal legibility and legibility will differ<br />
accord<strong>in</strong>g to font style. Snellen’s charts (1862) used<br />
‘Egyptian paragon’ styled serif letters, each of which had<br />
prom<strong>in</strong>ent ornamental cross-strokes at the end of each<br />
limb. Green (1868, 1905), who favoured simpler font<br />
styles, <strong>in</strong>itially used a sans serif Gothic design and<br />
excluded letters with oblique l<strong>in</strong>es (Z, N, S etc). Hartridge<br />
and Owen, who compared the legibility of Snellen and<br />
Green style letters, recommended that acuity should be<br />
assessed us<strong>in</strong>g a series of n<strong>in</strong>e letters (D F H N P T U X Z)<br />
selected from the Green series (Hartridge & Owen 1922).<br />
By 1872, Green’s thoughts on the matter had changed <strong>in</strong><br />
favour of a modified serif design as sans serif letters had<br />
been criticised as be<strong>in</strong>g ‘unf<strong>in</strong>ished <strong>in</strong> appearance’ (Green<br />
1872). Dennett (1885) adjusted <strong>in</strong>dividual letter sizes <strong>in</strong><br />
an attempt to compensate for relative legibility whereas<br />
others, <strong>in</strong>clud<strong>in</strong>g Cowan (1928) and Monoyer (1875),<br />
emphasised the importance of <strong>in</strong>dividually select<strong>in</strong>g font<br />
styles and l<strong>in</strong>ear dimensions (ie 5 × 5, 5 × 4 or 5 × 3) on a<br />
letter-by-letter basis. As suggestions concern<strong>in</strong>g letter<br />
shape and size proliferated, reverse contrast was proposed<br />
as a method of compensat<strong>in</strong>g for legibility differences<br />
(Walker 1942). Much of the orig<strong>in</strong>al work on relative<br />
legibility was undertaken by Woodruff (1947) and Coates<br />
(1935) who accumulated considerable normative data on<br />
legibility. The effect of font style on relative legibility has<br />
been reviewed by Borish (1970). Bennett (1965)<br />
illustrated how different letter design styles could affect<br />
legibility, serif letters <strong>in</strong> particular, <strong>in</strong>troduc<strong>in</strong>g<br />
characteristic identification errors. In his comprehensive<br />
review on the subject, he outl<strong>in</strong>ed the rationale used by<br />
various test chart designers for select<strong>in</strong>g letters of various<br />
styles. British Standard BS4274-1, which was published <strong>in</strong><br />
1968, recommends 10 (5 × 4) sans serif letters giv<strong>in</strong>g<br />
legibility rat<strong>in</strong>gs rang<strong>in</strong>g from 0.92 (R) to 1.10 (Z) (D E F<br />
H N P R U V Z) (BSI 4274-1 1968). The most recent<br />
version <strong>in</strong>corporates log MAR notation, recommends a<br />
5 × 5 letter grid format, a modification to row progression,<br />
and <strong>in</strong>troduces the letters C and K to the recommended<br />
range from which letters should be selected (BSI 4274-1<br />
2003). In the USA Sloan, who pioneered much of the work<br />
on standardisation, selected a sans serif style (Sloan 1951,<br />
Sloan et al. 1952). Her preference was for 10 letters <strong>in</strong> a 5<br />
× 5 grid style (S O C D K V R H N Z) (Sloan 1959). Her<br />
legibility rat<strong>in</strong>gs ranged from 0.90 (O) to 1.10 (Z).<br />
Regrettably, many currently available charts, though us<strong>in</strong>g<br />
sans serif letters, do not consider legibility rat<strong>in</strong>gs.<br />
Legibility is also affected by ‘contour <strong>in</strong>teraction’, a term<br />
co<strong>in</strong>ed by Flom to describe the effect of neighbour<strong>in</strong>g<br />
contours on the discrim<strong>in</strong>ability of detail (Flom et al.<br />
1963). Flom dist<strong>in</strong>guishes between ‘contour <strong>in</strong>teraction’,
AJ Jackson & IL Bailey<br />
which affects resolution of detail, and ‘crowd<strong>in</strong>g’, which<br />
affects assignment of attention. Both affect performance <strong>in</strong><br />
recognis<strong>in</strong>g optotypes on a visual acuity chart. Bailey<br />
studied the effects of spac<strong>in</strong>g between letters and between<br />
rows for different optotypes. Us<strong>in</strong>g British Standard<br />
letters, he found that a twofold <strong>in</strong>crease <strong>in</strong> letter spac<strong>in</strong>g<br />
changed the visual acuity score by 0.03 log units (Bailey<br />
1988). Spac<strong>in</strong>g was noted to have more of an effect when<br />
assess<strong>in</strong>g acuity with Landolt r<strong>in</strong>gs than when us<strong>in</strong>g<br />
Sloan-styled letters (Raasch & Bailey 1984). Bailey<br />
recommends letter and row spac<strong>in</strong>gs should equal letter<br />
width.<br />
Row progression<br />
Superimposed on the debate surround<strong>in</strong>g letter style has<br />
been an equally vociferous debate about chart design and<br />
row progression ratios. Both geometrical and arithmetical<br />
progressions, us<strong>in</strong>g a variety of progression rates, have<br />
been utilised over time. Snellen chose for his orig<strong>in</strong>al<br />
chart seven rows of letters which subtended 5m<strong>in</strong> of arc at<br />
distances of 6, 9, 12, 15, 21, 30 and 60m. The 1911 edition<br />
of his chart changed the size progression to 6, 8, 12, 18,<br />
24, 36 and 60-m letters. The six smaller rows approximate<br />
a geometric or logarithmic progression with a multiplier of<br />
1.4 (1.4 = √2 = 10 0.15 = 0.15 log unit). Us<strong>in</strong>g this factor, letter<br />
size doubles every second row (6, 8.5, 12, 17, 24, 34).<br />
Figure 5 illustrates the consequences of us<strong>in</strong>g three<br />
different size progression sequences. One has a geometric<br />
(logarithmic) progression with a constant multiplier ratio<br />
of 10 0.1 (6/6, 6/7.5, 6/9.5, 6/12 ...), the second uses a simple<br />
arithmetic progression <strong>in</strong> height (6/6, 6/12, 6/18, 6/24 ...)<br />
and the third uses equal steps of the reciprocal of size with<br />
0.1 <strong>in</strong>crements on the decimal scale. The sequence on the<br />
decimal scale is 1.0, 0.9, 0.8, 0.7 ... with the correspond<strong>in</strong>g<br />
Snellen sizes be<strong>in</strong>g (6/6, 6/6.7, 6/7.5, 6/8.6, 6/10 ...): the<br />
figure is scaled so that the <strong>in</strong>crements are equal on the<br />
geometric scale. Three steps correspond to a twofold<br />
change <strong>in</strong> size over the entire range. With the arithmetic<br />
scal<strong>in</strong>g sequence, three steps cover a four-times change <strong>in</strong><br />
size at the small end, and a 1.43 times change <strong>in</strong> size at<br />
the large end. For the reciprocal progression, three steps<br />
at the small end represent a 1.43 change <strong>in</strong> size, whereas<br />
at the larger end of the scale, three steps cover a four<br />
times change <strong>in</strong> size. Also shown on this figure is the<br />
‘conventional’ size series commonly used <strong>in</strong> the UK (6/4,<br />
6/5, 6/6, 6/7.5, 6/9, 6/12, 6/18, 6/24, 6/36 and 6/60). This<br />
series uses optotypes tightly spaced at the smaller sizes<br />
and more sparsely spaced at the larger sizes.<br />
Westheimer (1979) took advantage of the eye’s natural<br />
decl<strong>in</strong>e of visual acuity away from the fovea to show that<br />
the ‘probability of see<strong>in</strong>g’ function, a graph show<strong>in</strong>g<br />
58<br />
Increments on<br />
visual acuity scales<br />
Geometric<br />
Reciprocal<br />
Arithmetic<br />
‘Conventional’<br />
6/6<br />
6/60<br />
Figure 5 This figure shows the distribution of <strong>in</strong>crements<br />
on the visual acuity charts and their dependence on the<br />
mathematical system by which the size <strong>in</strong>crements are<br />
determ<strong>in</strong>ed.<br />
The diamonds illustrate <strong>in</strong>crements that follow a geometric<br />
or logarithmic size progression. There is a constant ratio<br />
between the sizes <strong>in</strong> adjacent rows. It is now widely<br />
accepted that this system is the most appropriate for visual<br />
acuity scal<strong>in</strong>g. It is the basis for the log MAR and visual<br />
acuity rat<strong>in</strong>g scales. Here, there are 10 steps between 6/6<br />
and 6/60.<br />
The open circles show the <strong>in</strong>crements on a scale that<br />
follows the reciprocal of visual angle. This is the basis of<br />
the decimal visual acuity scale. The <strong>in</strong>crements are<br />
relatively compacted at the small size and sparsely spaced<br />
at the larger size. Here there are n<strong>in</strong>e steps between 6/6 and<br />
6/60. The sequence is 1.0, 0.9, 0.8, 0.7, etc (6/6, 6/6.66,<br />
6/7.5, 6/8.57, 6/10, 6/12, 6/15, 6/30, 6/60).<br />
The open squares show the scale for an arithmetic<br />
progression. This scale has equal steps <strong>in</strong> terms of<br />
m<strong>in</strong>imum angle of resolution (1, 2, 3, 4, 5, etc <strong>in</strong> m<strong>in</strong>utes of<br />
arc) or <strong>in</strong> terms of the Snellen fraction denom<strong>in</strong>ator (6/6,<br />
6/12, 6/18, 6/24, 6/30, 6/36, 6/42, 6/48, 6/54, 6/60). The<br />
<strong>in</strong>crements are quite sparse at the smaller sizes and<br />
compacted at the larger size. Here, there are n<strong>in</strong>e steps<br />
between 6/6 and 6/60.<br />
The filled triangles illustrate the ‘conventional’ scale most<br />
widely used <strong>in</strong> the UK. The <strong>in</strong>crements are most densely<br />
packed at the smaller sizes and more sparsely spread at<br />
the larger size. There are n<strong>in</strong>e steps between 6/6 and 6/60,<br />
the sequence be<strong>in</strong>g (6/6, 6/7.5, 6/9, 6/12, 6/18, 6/24, 6/36,<br />
6/60).
percentage correct recognition as a function of size, was<br />
essentially the same for all levels of acuity, provided that<br />
visual acuity was plotted on a logarithmic scale. There is a<br />
broad acceptance that logarithmic (constant-ratio) scal<strong>in</strong>g<br />
should be used for visual acuity measurement, and the<br />
most popular scal<strong>in</strong>g ratio is now 0.1 log units (100.1 ,<br />
1.2589 or approximately 3<br />
√2). This progression, which was<br />
proposed by Green (1905) and endorsed by the American<br />
Committee on Optics and <strong>Visual</strong> Physiology (Ogle 1953;<br />
Spaeth et al. 1955), has had more recent advocates <strong>in</strong><br />
Keeler (1956), Sloan (1951) and Bailey & Lovie (1976).<br />
On this scale, 10 steps represent a 10-fold change, three a<br />
twofold change, and one step represents a change of about<br />
5/4. This sequence, based on a 6m reference, is 6, 7.5, 9.5,<br />
12, 15, 19, 24, 30, 38, 48 and 60. For 20ft, the sequence is<br />
20, 25, 32, 40, 50, 63, 80, 100, 125, 160, 200.<br />
Test distance<br />
The orig<strong>in</strong>al Snellen chart was designed for use at a test<strong>in</strong>g<br />
distance of 20 Parisian feet (6.5m). (One Parisian <strong>in</strong>ch is<br />
equivalent to 1.0658 English <strong>in</strong>ches.) By 1875, new<br />
editions of the Snellen chart were calibrated <strong>in</strong> metric<br />
units and were produced for use at 6m. Charts for use at<br />
5m test<strong>in</strong>g distances were, however, soon to become<br />
available. Both Landolt and Monoyer advocated the use of<br />
the 5m test distance (Landolt 1899, Monoyer 1875). The<br />
XI International Ophthalmologic Congress <strong>in</strong> 1901 ratified<br />
a recommended work<strong>in</strong>g distance of 5m (cited <strong>in</strong> Bennett<br />
1965). Historically, the UK has stayed with a 6m standard<br />
test distance, whereas <strong>in</strong> the USA the 20ft standard has<br />
been adopted. Given that cl<strong>in</strong>ical rooms are rarely 6m<br />
long, test distances are often achieved us<strong>in</strong>g <strong>in</strong>direct<br />
charts viewed <strong>in</strong> a mirror. The US Committee on Vision of<br />
the National Academy of Science/National Research<br />
Council recommended that 4m be the standard test<br />
distance (NAS-NRC 1980). Current British standards state<br />
that the test<strong>in</strong>g distance should not be less than 4m (BSI<br />
4274-1 2003).<br />
In low-vision work, the concept of a variable work<strong>in</strong>g<br />
distance is widely used and charts may be presented at<br />
various distances, sometimes as close as 50cm from the<br />
eye. At close distances, attention may need to be paid to<br />
the accommodation demand <strong>in</strong>duced by reduc<strong>in</strong>g the<br />
work<strong>in</strong>g distance. The dioptric depth of field of the eye<br />
provides a tolerance to small errors of focus. It is generally<br />
assumed that the refractive correction should be no more<br />
than +0.25D from the optical correction that would be<br />
optimal for the view<strong>in</strong>g distance that is be<strong>in</strong>g used. For<br />
low-vision patients with poor visual acuity, wider dioptric<br />
tolerances are often allowed. When test<strong>in</strong>g younger<br />
59<br />
<strong>Visual</strong> <strong>Acuity</strong><br />
patients, with ample accommodative reserves, attention<br />
may need to be paid to the potential for defocus <strong>in</strong>duced<br />
by proximal accommodation if the chart is at a close<br />
distance.<br />
<strong>Acuity</strong> designation<br />
Whereas visual acuity is an expression of the angular size<br />
of the smallest detail just resolvable by the eye, there are<br />
several alternative ways of specify<strong>in</strong>g the value cl<strong>in</strong>ically.<br />
The Snellen fraction expresses the angular size of the<br />
optotype as a fraction, specify<strong>in</strong>g the test distance d as the<br />
numerator and the distance at which the just-resolvable<br />
letters should be positioned <strong>in</strong> order to subtend an angle<br />
of 5m<strong>in</strong> of arc as the denom<strong>in</strong>ator D (visual acuity = d / D)<br />
(Figure 6). A benefit of express<strong>in</strong>g visual acuity <strong>in</strong> this way<br />
is that the cl<strong>in</strong>ician records the test<strong>in</strong>g distance, a factor<br />
that can be important <strong>in</strong> paediatric eye care and lowvision<br />
work. At a view<strong>in</strong>g distance of 6m, a patient with a<br />
best corrected visual acuity of 6/24 will just be able to read<br />
the 24m letter, which subtends 5m<strong>in</strong> of arc at a distance<br />
of 24m. In the USA, test distances are expressed <strong>in</strong> feet,<br />
whereas <strong>in</strong> most European and Commonwealth countries,<br />
a metric notation is used (6/6 = 20/20, 6/60 = 20/200, etc).<br />
On the European cont<strong>in</strong>ent, follow<strong>in</strong>g the notation used<br />
by Monoyer (1875), the Snellen fraction is usually<br />
reduced to a decimal notation. An acuity of 6/6 thus<br />
becomes 1.0, whereas a visual acuity of 6/60 becomes 0.1<br />
<strong>in</strong> the decimal notation. With the decimal notation,<br />
<strong>in</strong>formation on test distance is lost. Further, and more<br />
importantly, visual acuity scores <strong>in</strong> decimal notation can<br />
become confused with acuity scores expressed as log MAR.<br />
Those familiar with the task of check<strong>in</strong>g European and<br />
Eye with 6/6<br />
Eye with 6/18<br />
Angle = 5 m<strong>in</strong> of arc = 1/12 degree<br />
E<br />
6m 12m 18m<br />
E<br />
E E<br />
E<br />
6m 12m 18m<br />
Figure 6 The Snellen fraction (e.g. 6/6, 6/12, 6/18, etc.), of<br />
which the first number (numerator) <strong>in</strong>dicates the test<br />
distance <strong>in</strong> metres and the second number (denom<strong>in</strong>ator)<br />
<strong>in</strong>dicates the height of the letter. The height of the letter is<br />
<strong>in</strong>dicated by the distance at which a letter of that height will<br />
subtend a specific angle, namely, 5m<strong>in</strong> of arc = 1/12 degree.
AJ Jackson & IL Bailey<br />
North American reference articles for comparable studies<br />
will be familiar with the problems which can arise.<br />
Alternative notations have been proposed by various<br />
authorities over the years. Blaskoviscs (1924) proposed<br />
the ‘oxyoptre’, which was the reciprocal of the visual angle<br />
(<strong>in</strong> degrees) of the smallest recognisable target. Javal<br />
(1900) proposed that ‘letter height’ should be used,<br />
whereas Swa<strong>in</strong>e (1925), who co<strong>in</strong>ed the term ‘visual<br />
badness’, suggested that the Snellen fraction should be<br />
<strong>in</strong>verted.<br />
M<strong>in</strong>imum angle of resolution<br />
MAR is used to express, usually <strong>in</strong> m<strong>in</strong>utes of arc, the<br />
angular size of the critical detail with<strong>in</strong> a just-resolvable<br />
optotype. It is usually assumed that the critical detail is<br />
one-fifth of the letter height. Thus, an <strong>in</strong>dividual with a<br />
best corrected visual acuity of 6/6 can resolve critical<br />
detail, represented by a letter limb width of 1m<strong>in</strong> of arc. If<br />
the best corrected acuity were 6/60, the m<strong>in</strong>imal limb<br />
width resolvable would be 10m<strong>in</strong> of arc. The MAR is, <strong>in</strong><br />
fact, the reciprocal of the decimal acuity value. The log<br />
MAR designation was <strong>in</strong>troduced <strong>in</strong> 1976 with the<br />
Bailey–Lovie chart (Bailey & Lovie 1976). It expresses the<br />
visual acuity as the common logarithm of the MAR. On<br />
this scale, the 6/6 acuity (MAR = 1) becomes 0 on a log<br />
MAR chart (log 10 (1.0) = 0). A 6/60 acuity (MAR 10)<br />
becomes log 10 (10.0) = 1.0 (Table 2). Us<strong>in</strong>g charts with<br />
five letters per row and a 0.1 log unit progression of size, a<br />
Table 2. Comparison of different visual acuity designations.<br />
Snellen<br />
fraction<br />
(metres)<br />
Snellen<br />
fraction<br />
(feet)<br />
Decimal<br />
notation<br />
M<strong>in</strong>imum angle<br />
of resolution<br />
(MAR)<br />
Log MAR<br />
<strong>Visual</strong> acuity<br />
rat<strong>in</strong>g<br />
(VAR)<br />
60<br />
value of 0.02 log MAR units can be assigned to each letter<br />
read correctly. Other forms of acuity expression have also<br />
been advocated. Bailey (1988) suggested the use of a<br />
visual acuity rat<strong>in</strong>g (VAR), derived from log MAR acuity<br />
values (VAR = 100 – 50 log MAR). Us<strong>in</strong>g this system 6/6<br />
equates to VAR = 100, 6/60 becomes VAR = 50 and 6/600<br />
becomes VAR = 0. There is one VAR po<strong>in</strong>t per letter on a<br />
Bailey–Lovie or Early Treatment of Diabetic Ret<strong>in</strong>opathy<br />
Study (ETDRS) chart. Another designation system, visual<br />
efficiency (VE), rarely used <strong>in</strong> the UK, was proposed by<br />
Snell and Sterl<strong>in</strong>g <strong>in</strong> 1926 <strong>in</strong> an attempt to quantify visual<br />
loss for medicolegal purposes (Snell & Sterl<strong>in</strong>g 1926).<br />
They proposed the efficiency formula VE = 0.2<br />
(MAR–1) /9 . An <strong>in</strong>dividual with ‘normal’ (20/20) vision<br />
would be allocated a VE rat<strong>in</strong>g of 100%, while an <strong>in</strong>dividual<br />
with a best corrected visual acuity of 20/200 would have a<br />
VE rat<strong>in</strong>g of 20%. This method, which has been reviewed<br />
by Hofstetter (1950), was adopted by the American<br />
Medical Association <strong>in</strong> 1955 (Spaeth et al. 1955).<br />
Somewhat similar rat<strong>in</strong>gs for field loss and motility<br />
restrictions were subsequently developed and a<br />
permanent impairment <strong>in</strong>dex was <strong>in</strong>troduced <strong>in</strong> 1984<br />
(American Medical Association 1984).<br />
In many circles, with<strong>in</strong> the UK at least, it has become<br />
commonplace to record visual acuities of less than 6/60 as<br />
CF, HM, PL or NPL. CF stands for count f<strong>in</strong>gers and<br />
<strong>in</strong>dicates that the patient can recognise the number of<br />
f<strong>in</strong>gers held up by the cl<strong>in</strong>ician. This is an unnecessarily<br />
<strong>Visual</strong><br />
efficiency<br />
%<br />
Conventional<br />
Snellen Chart<br />
Keeler<br />
A chart<br />
Snellen<br />
fraction<br />
(metres (4m))<br />
Snellen<br />
fraction<br />
(feet)<br />
In the conventional Snellen and Keeler A series columns, brackets around the acuity values <strong>in</strong>dicate that the size is<br />
only a moderately close equivalent to the values <strong>in</strong> the other seven columns. For the Keeler A series, exact Snellen<br />
fraction equivalents are shown <strong>in</strong> parentheses.
crude way of estimat<strong>in</strong>g visual acuity. F<strong>in</strong>ger widths will<br />
vary from one cl<strong>in</strong>ician to another, separations between<br />
f<strong>in</strong>gers will differ from one presentation to the next and<br />
the lum<strong>in</strong>ance and complexity of the background will<br />
affect the visibility of the f<strong>in</strong>gers, so the visual task is not<br />
well-controlled. Work<strong>in</strong>g distances are often not recorded<br />
by those who choose to express visual status <strong>in</strong> terms of<br />
count<strong>in</strong>g f<strong>in</strong>gers. For patients whose visual acuity is less<br />
than 6/60, appropriate measures of visual acuity may be<br />
made by hold<strong>in</strong>g a visual acuity chart at a close distance.<br />
If a 60m letter cannot be read at a distance of, say, 50cm<br />
or even closer, then attempts at obta<strong>in</strong><strong>in</strong>g a mean<strong>in</strong>gful<br />
score of visual resolution may be abandoned.<br />
Hand movements (HM) is not a measurement of visual<br />
acuity, but rather a more basic and coarse classification of<br />
visual function. It should be reserved for those cases<br />
where the patient is unable to see any chart optotypes at<br />
any distance. With this level of vision, the observer can<br />
only detect shadows or large objects mov<strong>in</strong>g across the<br />
visual field. Perception of light (PL) <strong>in</strong>dicates an ability of<br />
the eye to detect a light source which may be a ceil<strong>in</strong>g<br />
light, or an ophthalmoscope bulb held close to the eye.<br />
Such a classification of vision should be reserved for eyes<br />
<strong>in</strong>capable of detect<strong>in</strong>g hand movements. It can be useful<br />
to ask if the direction of the light source can be identified,<br />
as an ability to judge the direction of major light sources<br />
can be functionally valuable when it comes to orientation<br />
awareness. The NPL (no perception of light) classification<br />
of vision refers to total bl<strong>in</strong>dness.<br />
Cl<strong>in</strong>icians are often required to provide visual acuity<br />
measurements <strong>in</strong> order to determ<strong>in</strong>e an <strong>in</strong>dividual’s<br />
eligibility for benefits, for privileges or for occupational<br />
assessment purposes. It can be useful to have <strong>in</strong>formation<br />
on hand on the World Health Organization classification of<br />
central visual status (World Health Organization 1979)<br />
and local def<strong>in</strong>itions that are relevant to occupational<br />
standards (Association of Optometrists 2002), driv<strong>in</strong>g<br />
(Taylor 1995) and visual impairment registration (Bunce<br />
et al. 1998, Evans 1995).<br />
Modern Test Chart Characteristics<br />
Logarithmic progressions<br />
The first of the modern logarithmically based test charts<br />
was <strong>in</strong>troduced to UK-based practitioners <strong>in</strong> 1956 by<br />
Charles Keeler. The Keeler charts were referred to as A<br />
series charts and were marketed as particularly useful for<br />
those <strong>in</strong>volved <strong>in</strong> low-vision practice (Keeler 1956). The<br />
chart layout was generally similar to that of a conventional<br />
Snellen chart. At the larger sizes, the sans serif letters had<br />
61<br />
<strong>Visual</strong> <strong>Acuity</strong><br />
stroke widths that were only one-seventh of the letter<br />
height. An important feature was that size progression was<br />
logarithmic. Successive sets of letters, mov<strong>in</strong>g up the<br />
chart, were larger, by a factor of 1.25, than their<br />
predecessors. On the orig<strong>in</strong>al chart, there were eight A1<br />
(6/6) letters and only one A20 (6/416) letter. In the USA,<br />
Sloan developed a visual acuity chart us<strong>in</strong>g her family of<br />
10 5 × 5 sans serif letters and a logarithmic size<br />
progression with a multiplier ratio = 1.2589 = 10√10 =<br />
10 0.1 (Sloan 1959). An important advance <strong>in</strong> the<br />
measurement of visual acuity came with the development<br />
and <strong>in</strong>troduction of the Bailey–Lovie design pr<strong>in</strong>ciples<br />
which were applied to new distance and near vision charts<br />
<strong>in</strong> the 1970s (Bailey & Lovie 1976). The design pr<strong>in</strong>ciples<br />
cause the visual acuity task to be standardised at each size<br />
level. Other features that comb<strong>in</strong>ed with the logarithmic<br />
size progression to standardise the task are: (1) the same<br />
number of optotypes <strong>in</strong> each row; (2) spac<strong>in</strong>gs between<br />
optotypes and between rows are proportional to the size of<br />
the optotypes; and (3) the mix of optotypes has<br />
approximately the same level of difficulty. This means size<br />
is the only significant chart variable from one size level to<br />
the next. Their design uses a geometrical progression of<br />
size and they chose a factor of 1.2589 (= 10 0.1 ) as their<br />
multiplier ratio. Bailey and Lovie <strong>in</strong>troduced the term ‘log<br />
MAR’ as a measure of visual acuity used <strong>in</strong> conjunction<br />
with a visual acuity chart. On their log MAR scale, there<br />
are 10 steps between 6/60 and 6/6, with the size<br />
progression be<strong>in</strong>g 60, 48, 38, 30, 24, 19, 15, 12, 9.5, 7.5,<br />
6. On the charts, the log MAR values are <strong>in</strong> <strong>in</strong>crements of<br />
0.1 log units: 6/60 = 1.0 log MAR, 6/48 = 0.9 log MAR, 6/38<br />
= 0.8 log MAR, and so forth (Table 2). Every third l<strong>in</strong>e on<br />
the chart sees a doubl<strong>in</strong>g, for larger letters, or a halv<strong>in</strong>g,<br />
for smaller letters, of letter size, so doubl<strong>in</strong>g or halv<strong>in</strong>g<br />
causes a change <strong>in</strong> the log MAR value by 0.3. Each l<strong>in</strong>e<br />
differs <strong>in</strong> size from the rows immediately above or below<br />
by a factor of 1.2589 (0.1 log units). On currently available<br />
charts, there is a 20-fold range of size with 14 rows of<br />
letters which, assum<strong>in</strong>g a 6m view<strong>in</strong>g distance, provide a<br />
size range from log MAR 0.8 (6/38 equivalent) to log MAR<br />
–0.5 (6/1.9 equivalent). On the Bailey–Lovie charts, there<br />
are five letters per row, with the letters selected from the<br />
group of 10 recommended <strong>in</strong> the 1968 British Standards<br />
(BSI 4274-1 1968). The spac<strong>in</strong>g between adjacent letters<br />
is equal to one letter width, and the separation between<br />
rows is equal to the width of the letters <strong>in</strong> the larger row.<br />
The comb<strong>in</strong>ation of letters on each l<strong>in</strong>e is selected to<br />
ensure about equal average difficulty from row to row.<br />
<strong>Visual</strong> acuity measurements recorded us<strong>in</strong>g Bailey–Lovie<br />
charts can be determ<strong>in</strong>ed us<strong>in</strong>g either row-by-row scor<strong>in</strong>g<br />
or letter-by-letter scor<strong>in</strong>g. Common cl<strong>in</strong>ical practice is to<br />
record the acuity as the smallest l<strong>in</strong>e on which the patient<br />
is able to identify either 50% of 80% of letters correctly.
AJ Jackson & IL Bailey<br />
This methodology is, however, too coarse to identify small<br />
or moderate changes <strong>in</strong> acuity. A small change <strong>in</strong> the<br />
number of letters read, even by one letter, can easily cause<br />
the acuity score to change by one row. A change <strong>in</strong> visual<br />
acuity score cannot be taken to be real or significant<br />
unless the change is by two rows or more (Bailey et al.<br />
1991). The row-by-row scores can be ref<strong>in</strong>ed by apply<strong>in</strong>g<br />
the plus or m<strong>in</strong>us notations, commonly used when<br />
express<strong>in</strong>g Snellen fraction measurements of acuity (6/6 ±<br />
2). Giv<strong>in</strong>g credit for every letter read improves sensitivity<br />
substantially (Figure 7). The Bailey–Lovie design<br />
pr<strong>in</strong>ciples allow each letter to be given the same value <strong>in</strong><br />
log MAR or VAR units. Every extra letter read changes the<br />
log MAR score by –0.02 and the VAR score by 1. This<br />
facilitates scor<strong>in</strong>g visual acuity letter-by-letter. With the<br />
five-letters-per-row chart, each letter can be assigned a<br />
value of 0.02 log MAR units (VAR = 1), with the result that<br />
each additional letter read on a subsequent l<strong>in</strong>e changes<br />
the log MAR score by –0.02 and the VAR by +1. The<br />
patient who reads all letters on every row down to the 0.20<br />
log MAR l<strong>in</strong>e (VAR = 90 = 20/32) and one letter on the 0.1<br />
log MAR l<strong>in</strong>e would thus be allocated a log MAR score of<br />
0.18 (VAR = 91). Another patient who reads all letters on<br />
every row down to the 0.20 log MAR row, four out of five<br />
on the 0.10 row and three out of five on the 0.00 row<br />
scores, us<strong>in</strong>g <strong>in</strong>dividual letter scor<strong>in</strong>g, a log MAR score of<br />
0.06 (0.20 – 0.08 – 0.06 = 0.06). In VAR units the<br />
equivalent score is 97 (90 + 4 + 3 = 97).<br />
When giv<strong>in</strong>g credit for every letter read us<strong>in</strong>g a<br />
Frequency<br />
By row<br />
By letter<br />
Test / retest discrepancy (letters)<br />
one row = five letters = 0.1 log unit<br />
Figure 7 Distribution of test–retest discrepancies expected<br />
when scor<strong>in</strong>g visual acuity, recorded for normally sighted<br />
subjects, on a Bailey–Lovie log MAR chart us<strong>in</strong>g<br />
letter–by–letter and row–by–row scor<strong>in</strong>g criteria. The 95%<br />
confidence limit for change us<strong>in</strong>g letter–by–letter scor<strong>in</strong>g is<br />
±5 letters. For row by row scor<strong>in</strong>g it is ± 2 rows.<br />
62<br />
Bailey–Lovie chart, a difference of five letters can usually<br />
be taken as be<strong>in</strong>g significant. That is, there is a 95%<br />
confidence that two visual acuity scores will be no more<br />
than four letters different from each other when there has<br />
been no change <strong>in</strong> vision. Thus a change of five letters can<br />
be taken as be<strong>in</strong>g a real or significant change. Confidence<br />
limits may be broader for some patient groups <strong>in</strong> whom<br />
acuity measurements are less consistent (Bailey et al.<br />
1991).<br />
The term ‘log MAR chart’ is often used to describe charts<br />
that follow the Bailey–Lovie design pr<strong>in</strong>ciples (Figure 8).<br />
The most widely used log MAR chart is the ETDRS chart<br />
designed for the Early Treatment of Diabetic Ret<strong>in</strong>opathy<br />
Study by Ferris et al. (1982). These charts, of which there<br />
are three, use a comb<strong>in</strong>ation of the 10 Sloan 5 × 5 letters<br />
rather than the 5 × 4 British standard letters and they<br />
were designed for use at 4m follow<strong>in</strong>g the<br />
recommendations of the Committee on Vision of the<br />
National Academy of Sciences National Research Council<br />
<strong>in</strong> the USA (NAS-NRC 1980). The use of standardised<br />
illum<strong>in</strong>ation is encouraged and both direct and retro<br />
illum<strong>in</strong>ation cab<strong>in</strong>ets have been designed for use with<br />
ETDRS charts (Ferris & Sperduto 1982).<br />
Strong and Woo produced the Waterloo chart, which uses<br />
a logarithmic progression, with letters <strong>in</strong> columns<br />
becom<strong>in</strong>g progressively smaller from left to right. They<br />
also added contour bars at the end of each row and<br />
Figure 8 A selection of currently available log MAR charts:<br />
a high–contrast Bailey–Lovie chart, a low–contrast Bailey-<br />
Lovie letter chart, an ETDRS chart, Glasgow <strong>Acuity</strong> cards<br />
and Kay Crowded Symbol Cards.
column, thus ensur<strong>in</strong>g that contour <strong>in</strong>teraction affected all<br />
letters equally (Strong & Woo 1985). Log MAR pr<strong>in</strong>ciples<br />
have also been applied to the development of distance<br />
visual acuity charts utilis<strong>in</strong>g Ch<strong>in</strong>ese characters (Woo &<br />
Lo 1980). Similar pr<strong>in</strong>ciples have been applied to both<br />
optotype and picture symbol acuity charts developed for<br />
the assessment of vision <strong>in</strong> young children (Hyvar<strong>in</strong>en et<br />
al. 1980, Jayatunga et al. 1995). McGraw and W<strong>in</strong>n<br />
developed the Glasgow acuity card log MAR-based system,<br />
which <strong>in</strong>corporates contour <strong>in</strong>teraction bars, for assess<strong>in</strong>g<br />
vision <strong>in</strong> preschool children (McGraw & W<strong>in</strong>n 1993).<br />
Recent studies <strong>in</strong>dicate that visual acuity results recorded<br />
us<strong>in</strong>g Kay picture, crowded symbol and crowded letter log<br />
MAR-based tests, on children with amblyopia, are<br />
comparable (Jones et al. 2003).<br />
Other Test Chart Design Features<br />
Historically, acuity charts were produced as pr<strong>in</strong>ted<br />
panels designed for use with direct illum<strong>in</strong>ation. Most<br />
were pr<strong>in</strong>ted on card and, as a result, were susceptible to<br />
discoloration and age<strong>in</strong>g. Charts pr<strong>in</strong>ted on plastic panels<br />
were more durable and could, <strong>in</strong> addition, be wiped down<br />
with a damp cloth, thus render<strong>in</strong>g them grime- and dirtfree.<br />
Given the lack of availability of 6m test<strong>in</strong>g facilities,<br />
many visual acuity charts are pr<strong>in</strong>ted <strong>in</strong> reverse format so<br />
they can be viewed via a mirror <strong>in</strong> rooms 3–4m <strong>in</strong> length.<br />
In an attempt to <strong>in</strong>troduce standardisation of test<strong>in</strong>g<br />
conditions, <strong>in</strong>ternally illum<strong>in</strong>ated acuity test<strong>in</strong>g<br />
equipment was produced, the most commonly used <strong>in</strong><br />
British hospitals be<strong>in</strong>g the rotat<strong>in</strong>g Snellen drum. Even<br />
with these units, charts are subject to age<strong>in</strong>g and care<br />
needs to be taken <strong>in</strong> the selection of background bulb<br />
<strong>in</strong>tensity. Log MAR charts are now also available as<br />
<strong>in</strong>ternally illum<strong>in</strong>ated units with <strong>in</strong>terchangeable panels<br />
to allow variation <strong>in</strong> the letter sequenc<strong>in</strong>g.<br />
An alternative to the panel chart is the projector chart.<br />
Typically their display area is relatively small <strong>in</strong> angular<br />
size and this limits the length of the rows and the number<br />
of pr<strong>in</strong>t sizes that can be presented at the same time. The<br />
angular size of the projected letters will be <strong>in</strong>dependent of<br />
view<strong>in</strong>g distance provided the projection screen is<br />
equidistant from both the projector and the patient. In<br />
short rooms, mirrors may be used to <strong>in</strong>crease the optical<br />
path length from projector to screen and from screen to<br />
patient. The magnification of the projector may be varied,<br />
allow<strong>in</strong>g precise calibration of the angular size of the<br />
letters for a given eye-to-patient distance.<br />
63<br />
Test Chart Lum<strong>in</strong>ance<br />
<strong>Visual</strong> <strong>Acuity</strong><br />
The sensitivity of the visual system is such that it is<br />
capable of respond<strong>in</strong>g to illum<strong>in</strong>ated targets over a very<br />
wide range of <strong>in</strong>tensities. The normal healthy eye can<br />
operate over a very wide range (7–8 log units) of<br />
lum<strong>in</strong>ance, encompass<strong>in</strong>g both scotopic and photophobic<br />
vision. <strong>Visual</strong> acuity does vary with changes <strong>in</strong> chart<br />
lum<strong>in</strong>ance. The British Standard recommendations are<br />
that <strong>in</strong>ternally illum<strong>in</strong>ated charts should have a m<strong>in</strong>imum<br />
background lum<strong>in</strong>ance of 120 candela per square metre<br />
(cd/m 2 ), with newly <strong>in</strong>stalled charts hav<strong>in</strong>g a m<strong>in</strong>imum<br />
background lum<strong>in</strong>ance of 150 cd/m 2 <strong>in</strong> order to allow for<br />
age<strong>in</strong>g of the system (BSI 4274-1 1968). Externally<br />
illum<strong>in</strong>ated charts should have a m<strong>in</strong>imum illum<strong>in</strong>ance of<br />
480lux, although new <strong>in</strong>stallations should measure<br />
600lux. Recommendations <strong>in</strong> the most recent British<br />
Standards rema<strong>in</strong> unchanged, although guidance on<br />
background illum<strong>in</strong>ation has been withdrawn (BSI 4274-1<br />
2003). The recommended light<strong>in</strong>g levels, for the<br />
externally illum<strong>in</strong>ated (807–1345lux) and <strong>in</strong>ternally<br />
illum<strong>in</strong>ated (343cd/m 2 ) charts advocated by Ferris, are<br />
higher than those recommended <strong>in</strong> British Standards<br />
(Ferris & Sperduto 1982). Sheedy and colleagues have<br />
reported that, when chart lum<strong>in</strong>ance is with<strong>in</strong> the<br />
moderate photopic range (40–600cd/m 2 ), doubl<strong>in</strong>g the<br />
chart lum<strong>in</strong>ance only alters the visual acuity score by a<br />
little less than 0.02 log units (Sheedy et al. 1984). They<br />
recommended that chart lum<strong>in</strong>ances be <strong>in</strong> the range<br />
80–320cd/m 2 . With<strong>in</strong> any given cl<strong>in</strong>ical environment, it<br />
has been recommended that chart lum<strong>in</strong>ance should be<br />
kept constant with a tolerance of ±15% (Bailey 1998) and<br />
that variance across a chart should not exceed 20% (BSI<br />
4274-1 2003).<br />
Test<strong>in</strong>g Protocols<br />
Many of the important pr<strong>in</strong>ciples and practices associated<br />
with acuity test<strong>in</strong>g have been outl<strong>in</strong>ed by Johnston<br />
(1991). Irrespective of the type of chart used, or the test<br />
distance selected, it is important to record both<br />
monocular and b<strong>in</strong>ocular acuities. Good cl<strong>in</strong>ical practice<br />
is to commence the assessment of visual functions by<br />
record<strong>in</strong>g habitual visual acuities with the patient<br />
wear<strong>in</strong>g his or her own distance spectacles or contact<br />
lenses. Adapt<strong>in</strong>g the practice of record<strong>in</strong>g data for the<br />
right eye (Rt/OD) first, whilst ensur<strong>in</strong>g total occlusion of<br />
the left eye, m<strong>in</strong>imises the risk of erroneously record<strong>in</strong>g<br />
laterally transposed data on the record card. Thereafter<br />
left-eye data (Lt/OS) should be recorded us<strong>in</strong>g, if possible,<br />
a separate acuity chart. This can be readily achieved us<strong>in</strong>g<br />
a Snellen rotat<strong>in</strong>g drum system, hand-held charts or<br />
alternatively by utilis<strong>in</strong>g different charts from the
AJ Jackson & IL Bailey<br />
Bailey–Lovie or ETDRS sets. Generally, b<strong>in</strong>ocular acuities<br />
(B<strong>in</strong>oc/OU) will be equal to or marg<strong>in</strong>ally better than best<br />
monocular acuity. Sometimes, such as <strong>in</strong> the case of<br />
congenital nystagmus, the difference may become as great<br />
as 0.3 log MAR units. It is often useful to record unaided<br />
acuities (Rt/Lt and B<strong>in</strong>oc), or ‘visions’, as they are often<br />
called <strong>in</strong> the UK, <strong>in</strong> order to ascerta<strong>in</strong> the extent to which<br />
the refractive correction improves visual status. In cases<br />
where an occupational report is requested, it is not<br />
uncommon for employers to request <strong>in</strong>formation on both<br />
habitual and unaided visual acuities as well as best<br />
corrected acuities. Best corrected visual acuities,<br />
recorded monocularly and thereafter b<strong>in</strong>ocularly, should<br />
be recorded after full refraction. P<strong>in</strong>hole acuities (PH) are<br />
measures of visual acuity through a 1–1.5mm p<strong>in</strong>hole.<br />
P<strong>in</strong>hole acuities should be determ<strong>in</strong>ed when the best<br />
corrected visual acuity is less than expected or where<br />
there is reason to suspect that visual impairment is<br />
predom<strong>in</strong>antly the result of medial irregularity as, for<br />
example, <strong>in</strong> keratoconus or cortical cataract.<br />
To ensure that a given patient’s threshold lies with<strong>in</strong> the<br />
range of the chart, all letters should be read at the largest<br />
size and no letters should be legible at the smallest size. If<br />
a patient correctly reads half or more of the letters <strong>in</strong> one<br />
row, he or she should be encouraged to attempt to read<br />
any letters <strong>in</strong> the follow<strong>in</strong>g row. In cl<strong>in</strong>ical research<br />
protocols, it is common practice to have all patients read<br />
from the top of the chart, even for patients with excellent<br />
visual acuity. This practice can be laborious when us<strong>in</strong>g<br />
log MAR charts where, for normally sighted subjects, the<br />
threshold size will commonly be at the 12th or 13th row<br />
on the chart. In the <strong>in</strong>terest of time, patients may be<br />
encouraged to start read<strong>in</strong>g three rows above the expected<br />
threshold. Us<strong>in</strong>g log MAR charts, care has to be taken to<br />
encourage patients with macular defects, and those with<br />
neurological impairment, as the visual task can be difficult<br />
and exhaust<strong>in</strong>g. Isolat<strong>in</strong>g letters, or sets of letters can be<br />
useful and flip charts such as the Sonksen–Silver charts<br />
may be useful <strong>in</strong> such circumstances (Sonksen & Silver<br />
1988). For more expeditious test<strong>in</strong>g, Rosser et al. designed<br />
charts with an abbreviated size range, different letter<br />
designs and fewer letters per row (Rosser et al. 2001). An<br />
alternative approach advocated by Campar<strong>in</strong>i and<br />
colleagues is to estimate the threshold region by hav<strong>in</strong>g<br />
the patient read only the first letter <strong>in</strong> each row of ETDRS<br />
charts until mistakes are made (Campar<strong>in</strong>i et al. 2001). In<br />
both cases, quicker test<strong>in</strong>g is achieved with modest<br />
reductions <strong>in</strong> reliability and validity.<br />
There is a popular belief that 20/20 vision (6/6 or log MAR<br />
= 0.0) represents ‘normal’ vision. Elliott and co-workers<br />
have shown that the average best corrected visual acuity<br />
<strong>in</strong> those under the age of 50, who show no signs of ocular<br />
64<br />
pathology, is about 6/4.8. Even <strong>in</strong> those over the age of 75<br />
years, provided the eyes are free of disease, the average<br />
visual acuity is marg<strong>in</strong>ally better than 6/6 (Elliott et al.<br />
1995).<br />
For cl<strong>in</strong>icians to monitor changes <strong>in</strong> ocular health and<br />
visual status, visual acuity measurements should be made<br />
with appropriate test charts, viewed under controlled<br />
conditions, and credit should be given to every additional<br />
letter read correctly. The significance of this statement is<br />
borne out by the publication of two British Medical<br />
Journal papers on the subject <strong>in</strong> the mid-1990s (McGraw<br />
et al. 1995, Pandit 1994). McGraw et al. concluded that<br />
doctors must be extremely cautious when assign<strong>in</strong>g<br />
cl<strong>in</strong>ical importance to changes <strong>in</strong> acuity of two l<strong>in</strong>es or<br />
less because of the <strong>in</strong>herent variability of the Snellen<br />
chart, whereas Pandit stressed the practical importance of<br />
standardis<strong>in</strong>g work<strong>in</strong>g distances and illum<strong>in</strong>ation<br />
conditions when assess<strong>in</strong>g visual acuity us<strong>in</strong>g Snellen<br />
charts <strong>in</strong> general practice.<br />
The Impact of Glare<br />
Light scatter from lenticular or corneal media haze<br />
produces veil<strong>in</strong>g lum<strong>in</strong>ance over the ret<strong>in</strong>a. This reduces<br />
the contrast of the ret<strong>in</strong>al image which produces glare<br />
disability. Substantial visual disability and glare<br />
discomfort may be encountered <strong>in</strong> certa<strong>in</strong> light<strong>in</strong>g<br />
conditions, such as when fac<strong>in</strong>g oncom<strong>in</strong>g headlights<br />
when driv<strong>in</strong>g at night, or when driv<strong>in</strong>g towards the sett<strong>in</strong>g<br />
sun. In the consult<strong>in</strong>g room, light<strong>in</strong>g conditions are rarely<br />
sufficient to <strong>in</strong>duce significant glare disability or<br />
discomfort. Sometimes, vision may, however, be reduced<br />
when read<strong>in</strong>g material pr<strong>in</strong>ted on glossy paper,<br />
illum<strong>in</strong>ated by an <strong>in</strong>appropriately positioned lum<strong>in</strong>aire. A<br />
cl<strong>in</strong>ical simulation of distance vision under glare can be<br />
achieved by us<strong>in</strong>g the brightness acuity tester. This device<br />
allows acuity to be assessed, view<strong>in</strong>g through a 12mm<br />
diameter peephole <strong>in</strong> a 60mm hemispherical lightdiffus<strong>in</strong>g<br />
bowl which can be set at three different levels of<br />
glare <strong>in</strong>tensity. Neumann et al. (1988) found the<br />
brightness acuity tester to be an accurate predictor of<br />
outdoor high-contrast acuity <strong>in</strong> cataractous patients.<br />
Glare has an even more dramatic impact on visibility<br />
when the test targets are of low contrast (Elliott &<br />
Bullimore 1993).<br />
Contrast and <strong>Acuity</strong> Charts<br />
Although a review of contrast sensitivity is outside the<br />
scope of this paper, it should be acknowledged that<br />
fundamental to vision is the eye’s ability to differentiate
lum<strong>in</strong>ance differences with<strong>in</strong> an image formed on the<br />
ret<strong>in</strong>a. The difference <strong>in</strong> lum<strong>in</strong>ance (∆L) that can just be<br />
detected is proportional to the lum<strong>in</strong>ance of the<br />
background on which the <strong>in</strong>crement is displayed. This is<br />
expressed as Weber’s law (∆L/L = constant), where L is the<br />
overall background or prevail<strong>in</strong>g lum<strong>in</strong>ance (Tunnacliffe<br />
1994). The threshold contrast ratio (or Fechner constant)<br />
is about 0.02–0.03 over the full range of photophobic<br />
lum<strong>in</strong>ance (1–1000 cd/m 2 ). Under scotopic conditions, the<br />
Fechner constant rises exponentially to 0.7 and the eye<br />
becomes less good at detect<strong>in</strong>g differences <strong>in</strong> lum<strong>in</strong>ance<br />
levels with<strong>in</strong> a target. When quantify<strong>in</strong>g the contrast<br />
<strong>in</strong>herent <strong>in</strong> a conventional black-on-white chart, it is<br />
common practice to express contrast (C) as C = ∆L/L or<br />
C = (L max – L m<strong>in</strong> )/L max . The British Standard recommendations<br />
are that conventional acuity charts should have a<br />
contrast factor of 0.9 (90%), which is close to the<br />
theoretical maximum with pr<strong>in</strong>ted charts (BSI 4274-1<br />
1968). Sloan suggested that the lowest acceptable contrast<br />
ratio for the assessment of conventional high-contrast<br />
acuity was 0.84 (84%) (Sloan 1951).<br />
In recent years, <strong>in</strong>creased understand<strong>in</strong>g about the impact<br />
of ocular and visual pathway pathology on contrast<br />
sensitivity function has resulted <strong>in</strong> the development of<br />
low-contrast acuity charts. Regan letter charts, which are<br />
visual acuity charts with eight letters on each of five l<strong>in</strong>es,<br />
are available at 96%, 7% and 4% contrast levels. They are<br />
designed for use at 3m and are scored on a letter-by-letter<br />
basis (Regan 1988). Also available is the reduced-contrast<br />
Bailey–Lovie visual acuity chart, which is identical to the<br />
high-contrast chart <strong>in</strong> design, except that the letters are<br />
pr<strong>in</strong>ted at an 18% contrast level (Bailey 1982). The Regan<br />
and Bailey–Lovie low-contrast visual acuity charts are<br />
used to determ<strong>in</strong>e the smallest letters that can be read at<br />
two or more different contrast levels. Less well-known are<br />
the low lum<strong>in</strong>ance charts (Smith-Kettlewell Institute Low<br />
Lum<strong>in</strong>ance or SKILL charts) designed by Haegerstrom-<br />
Portnoy et al. (1997). These charts utilise black letters on<br />
a dark-grey background and they have been shown to be<br />
sensitive at detect<strong>in</strong>g ret<strong>in</strong>al and optic nerve disease.<br />
A significantly different test is the Pelli–Robson lowcontrast<br />
letter chart which measures contrast threshold,<br />
not visual acuity. This chart consists of Sloan letters of<br />
equal size (49mm) but of progressively decreas<strong>in</strong>g<br />
contrast. Letters are grouped <strong>in</strong> 16 sets of three, each set<br />
decreas<strong>in</strong>g <strong>in</strong> contrast by 0.15 log units. Those at the top<br />
left-hand corner of the chart have 89% contrast whilst<br />
those at the bottom right have 0.5% contrast (Pelli et al.<br />
1988). This chart provides a contrast threshold<br />
measurement at a s<strong>in</strong>gle letter size.<br />
65<br />
<strong>Visual</strong> <strong>Acuity</strong><br />
Electronic Display Technology and Cl<strong>in</strong>ical<br />
Measurement of <strong>Visual</strong> <strong>Acuity</strong><br />
Computer-controlled displays offer some important<br />
advantages for cl<strong>in</strong>ical measurement of visual acuity and<br />
related functions. For visual acuity charts, optotype<br />
sequences may be varied, so memorisation becomes less<br />
of a problem, especially when it is necessary to take<br />
repeated measurements. Patients’ responses can be<br />
recorded onl<strong>in</strong>e and presentation protocols may be<br />
modified to enhance efficiency of test<strong>in</strong>g, reliability of<br />
results and storage of data. Systematic variations may<br />
easily be made <strong>in</strong> stimulus variables such as lum<strong>in</strong>ance,<br />
contrast, spac<strong>in</strong>g arrangements, optotype sizes, exposure<br />
time, and so forth. Until recently it had been difficult to<br />
obta<strong>in</strong> high lum<strong>in</strong>ances on electronic screens. Pixel<br />
structure imposes some limitations <strong>in</strong> that, for reasonable<br />
shape fidelity, letters need to be about 10 pixels or more<br />
<strong>in</strong> height, and the need for more pixels may be more<br />
pronounced for Landolt r<strong>in</strong>g and tumbl<strong>in</strong>g E targets with<br />
their more regular structures. The smallest letters on the<br />
chart should be just beyond resolution for normally<br />
sighted subjects.<br />
Pixellation still imposes important limitations. If the<br />
smallest letters on the chart are 10 pixels high, a row of<br />
five 5 × 5 letters would need to be 110 pixels long, allow<strong>in</strong>g<br />
for one-letter spac<strong>in</strong>g between letters, and similar spac<strong>in</strong>g<br />
at either end of the row. It would be 88 pixels for 5 × 4<br />
optotypes. For a chart cover<strong>in</strong>g a 20-fold size range (6/60<br />
to 6/3), the length of the largest row would thus need to be<br />
2200 or 1760 pixels. With the separation between rows<br />
be<strong>in</strong>g equal to the height of the letters, the height of the<br />
chart would need to be at least 187 times the height of the<br />
smallest letters for a 20-fold range of sizes. Thus, for a 6/60<br />
to 6/3 size range, a display screen would need to have <strong>in</strong><br />
the order of 2000 pixels <strong>in</strong> both directions. The pixellation<br />
constra<strong>in</strong>ts are not so restrictive <strong>in</strong> the vertical dimension<br />
because vertical scroll<strong>in</strong>g could be used to limit the<br />
display to a size range of immediate relevance.<br />
For letters to be 10 pixels high and to represent a 6/3<br />
visual acuity angle the pixels need to subtend 15 seconds<br />
of arc at the eye. This means the pixel size would need to<br />
be 0.22mm for a 3-m view<strong>in</strong>g distance, or 0.44mm for 6m.<br />
The screen width or height would thus need to be 45 or<br />
90cm. Current display screen technology is very close to<br />
be<strong>in</strong>g able to accommodate the high resolution and large<br />
area required for a log MAR acuity chart with a size range<br />
extend<strong>in</strong>g from 6/60 to 6/3. A particularly <strong>in</strong>terest<strong>in</strong>g<br />
development is the BV-1000 automated subjective<br />
refractive system, which has recently come to the market<br />
<strong>in</strong> the UK. The system utilises s<strong>in</strong>gle Landolt Cs oriented
AJ Jackson & IL Bailey<br />
randomly <strong>in</strong> one of four directions. The optotype sizes<br />
follow a logarithmic sequence and present<strong>in</strong>g visual acuity<br />
levels range from 6/60 (log MAR =1.0) to 6/3.8 (log MAR =<br />
–0.2). The s<strong>in</strong>gle optotype presentation means the results<br />
are not directly comparable to results from optotypes <strong>in</strong><br />
log MAR chart format (Dave 2003).<br />
Acknowledgements<br />
The authors wish to offer particular thanks to Miss E<br />
Elliman, Mrs J Mart<strong>in</strong> and Ms S O’Connor, whose<br />
assistance <strong>in</strong> prepar<strong>in</strong>g the manuscript was <strong>in</strong>valuable.<br />
Conclusion<br />
<strong>Visual</strong> acuity, measured with letter charts, is likely to<br />
rema<strong>in</strong> the pr<strong>in</strong>cipal test of central visual function used by<br />
cl<strong>in</strong>icians. Advances <strong>in</strong> medical and optical technology<br />
will <strong>in</strong>evitably lead to eye care practitioners be<strong>in</strong>g more<br />
<strong>in</strong>terested <strong>in</strong> accurately measur<strong>in</strong>g small changes <strong>in</strong><br />
vision. Practitioners will need better measurements to<br />
assess the outcome of sophisticated refractive surgery or<br />
the benefits achievable through us<strong>in</strong>g new designs of<br />
ophthalmic appliance. Decisions about treatments, access<br />
to funds to pay for treatment, or eligibility for certa<strong>in</strong><br />
benefits and privileges, will <strong>in</strong>creas<strong>in</strong>gly depend more on<br />
cl<strong>in</strong>ical data, and tightly specified criteria, and less on a<br />
cl<strong>in</strong>ician’s declaration of op<strong>in</strong>ion.<br />
The cl<strong>in</strong>ical community is slowly mov<strong>in</strong>g towards<br />
improv<strong>in</strong>g visual acuity measurement. There is an<br />
<strong>in</strong>creased awareness that chart design affects visual acuity<br />
scores. There is also a grow<strong>in</strong>g acceptance of the need to<br />
standardize significant chart design features such as the<br />
choice of optotype, the number of letters at each size, the<br />
layout and spac<strong>in</strong>g arrangements of the charts, and the<br />
sequence of the size progression. Scor<strong>in</strong>g visual acuity <strong>in</strong><br />
f<strong>in</strong>e steps, giv<strong>in</strong>g additional credit for each additional<br />
letter read, should become the rule rather than the<br />
exception as cl<strong>in</strong>icians become more <strong>in</strong>terested <strong>in</strong> gett<strong>in</strong>g<br />
more precise and reliable measures of vision.<br />
As with the assessment of visual fields, progress <strong>in</strong> visual<br />
acuity measurement, by real-world cl<strong>in</strong>icians, is likely to<br />
be gradual until such times as computer-based technology<br />
becomes adequate and affordable. It will not be long.<br />
When computer-based acuity measurement is made easy,<br />
and <strong>in</strong>corporated <strong>in</strong>to exam<strong>in</strong>ation rout<strong>in</strong>es, cl<strong>in</strong>icians<br />
will embrace visual acuity tests with randomly generated<br />
letter sequences, efficient automated procedures to<br />
establish threshold, and automatic register<strong>in</strong>g of precise<br />
visual acuity scores with measures of reliability. Ready<br />
66<br />
access to controll<strong>in</strong>g target characteristics, lum<strong>in</strong>ances<br />
and layouts will enable cl<strong>in</strong>icians to make more thoughtful<br />
systematic evaluations of the visual capabilities of their<br />
patients.<br />
References<br />
American Medical Association (1984) Evaluation of permanent visual<br />
impairment. In: AMA Council on Scientific Affairs (eds) Guides to the<br />
Evaluation of Permanent Impairment. AMA Physicians Desk<br />
Reference for Ophthalmology, 2nd edn, pp. 141–51. Chicago<br />
Association of Optometrists (2002) AOP Members’ Handbook 2002.<br />
Section C Vision Standards. London: Association of Optometrists<br />
Bailey IL (1982) Simplify<strong>in</strong>g contrast sensitivity test<strong>in</strong>g. Am J Optom<br />
Physiol Opt 59 (suppl.),12<br />
Bailey IL (1988) Measurement of visual acuity – towards<br />
standardisation. In: Vision Science Symposium: A Tribute to Gordon<br />
G Heath, pp. 217–30. Bloom<strong>in</strong>gton: Indiana University<br />
Bailey IL, Bullimore MA, Raasch TW, Taylor HR (1991) Cl<strong>in</strong>ical<br />
grad<strong>in</strong>g and the effects of scal<strong>in</strong>g. Invest Ophthalmol Vis Sci 32,<br />
422–32<br />
Bailey IL (1998) <strong>Visual</strong> acuity. In: Benjam<strong>in</strong> WJ, Borish IM, Lampert<br />
R (eds) Borish’s Cl<strong>in</strong>ical Refraction, ch. 10. Philadelphia: WB<br />
Saunders<br />
Bailey IL, Lovie JE (1976) New design pr<strong>in</strong>ciples for visual acuity<br />
letter charts. Am J Optom Physiol Opt 53 (11), 740–5<br />
Bennett AG (1965) Ophthalmic test types. Br J Physiol Opt 22,<br />
238–71<br />
Blaskoviscs L (1924) The new unit of visual acuity and its practical<br />
use. Arch Ophthalmol 53, 476–85<br />
Borish IM (1970) Cl<strong>in</strong>ical Refraction, <strong>Visual</strong> acuity, 3rd edn, pp.<br />
345–422. Chicago, IL: Professional Press<br />
BSI 4274–1 (1968) <strong>Visual</strong> <strong>Acuity</strong> Test Types Pt 1: Specification for<br />
Test Charts for Cl<strong>in</strong>ically Determ<strong>in</strong><strong>in</strong>g Distance <strong>Visual</strong> <strong>Acuity</strong>.<br />
London: British Standard Institute<br />
BSI 4274–1 (2003) <strong>Visual</strong> <strong>Acuity</strong> Types Pt 1: Test Charts for Cl<strong>in</strong>ical<br />
Determ<strong>in</strong>ation of Distance <strong>Visual</strong> <strong>Acuity</strong>: Specifications. London:<br />
British Standards Institute<br />
Bunce C, Evans J, Fraser S, Wormald R (1998) BD8 certification of<br />
visually impaired people. Br J Ophthalmol 82 (1), 72–76<br />
Campar<strong>in</strong>i M, Cass<strong>in</strong>ari P, Ferrigno L, Macaluso C (2001) ETDRS –<br />
fast: implement<strong>in</strong>g psychophysical adaptive methods to standardise<br />
visual acuity measurement with ETDRS charts. Invest Ophthalmol<br />
Vis Sci 42 (6), 1226–31<br />
Coates WR (1935) <strong>Visual</strong> acuity test letters. Trans Inst Ophthalm<br />
Opticians III, 1–38<br />
Cowan A (1928) Test cards for the determ<strong>in</strong>ation of visual acuity: a<br />
review. Arch Ophthalmol NY 57, 283–92<br />
Dave T (2003) Topcon BV 1000 automated subjective refraction<br />
system. Optom Today April 4th 1–6<br />
Dennett WS (1885) Test type. Trans Am Ophthalmol Soc 4, 133–9<br />
Duke-Elder SW (1937) The subjective exam<strong>in</strong>ation of the eye. In:<br />
Duke-Elder SW (ed.) Textbook of Ophthalmology, vol. II, ch. 29.<br />
London: Henry Kimpton<br />
Elliott DB, Bullimore MA (1993) Assess<strong>in</strong>g the reliability,<br />
discrim<strong>in</strong>ative ability and validity of disability glare tests. Invest<br />
Ophthalmol Vis Sci 34 (1), 108–19<br />
Elliott DB, Yang KCH, Whitaker D (1995) <strong>Visual</strong> acuity changes<br />
throughout adulthood <strong>in</strong> normal healthy eyes: see<strong>in</strong>g beyond 6/6.<br />
Optom Vis Sci 72 (3), 186–91
Evans J (1995) Causes of Bl<strong>in</strong>dness and Partial Sight <strong>in</strong> England and<br />
Wales 1990–1991. Studies on Medical Population Subjects No. 57.<br />
London: HMSO<br />
Ferris FL, Sperduto RD (1982) Standardised illum<strong>in</strong>ation for visual<br />
acuity test<strong>in</strong>g <strong>in</strong> cl<strong>in</strong>ical research. Am J Ophthalmol 94, 97–8<br />
Ferris FL, Kassoff A, Bresnick GH, Bailey IL (1982) New visual acuity<br />
charts for cl<strong>in</strong>ical research. Am J Ophthalmol 94, 91–6<br />
Flom MC, Weymouth FW, Kahneman K (1963) <strong>Visual</strong> resolution and<br />
contour <strong>in</strong>teraction. J Opt Soc Am 53 (9), 1026–32<br />
Green J (1868) On a new series of test letters for determ<strong>in</strong><strong>in</strong>g<br />
acuteness of vision. Trans Am Ophthalmol Soc 1 (3), 68–71<br />
Green J (1872) Some Improvements <strong>in</strong> Test Letters. London: IVth<br />
International Ophthalmology Congress<br />
Green J (1905) Notes on the cl<strong>in</strong>ical determ<strong>in</strong>ation of the acuteness<br />
of vision, <strong>in</strong>clud<strong>in</strong>g the construction and gradation of opto-types and<br />
on systems of notation. Trans Am Ophthalmol Soc 10 (3), 644–654<br />
Haegerstrom-Portnoy G, Brabyn J, Schneck M, Jampolsky A (1997)<br />
The SKILL card: an acuity test of reduced lum<strong>in</strong>ance and contrast.<br />
Invest Ophthalmol Vis Sci 38 (1), 207–18<br />
Hartridge H, Owen HB (1922) Test types. Br J Ophthalmol 6, 543–549<br />
Hofstetter HW (1950) The AMA method of appraisal of visual<br />
efficiency. Am J Optom Arch Am Acad Optom 27 (2), 55–63<br />
Hyvar<strong>in</strong>en L, Nasanen R, Laur<strong>in</strong>en P (1980) New visual acuity test for<br />
pre-school children. Acta Ophthalmol 58, 507–11<br />
Javal E (1900) Réforme de la notation de l’acuité visuelle. Ann Oculist<br />
124, 155–9<br />
Jayatunga R, Sonksen PM, Bhibe A, Wade A (1995) Measures of acuity<br />
<strong>in</strong> primary school children and their ability to detect m<strong>in</strong>or errors <strong>in</strong><br />
vision. Dev Med Child Neurol 37, 515<br />
Jenk<strong>in</strong>s FA, White HE (1976) Fundamentals of Optics, 4th edn, p.<br />
329. Kogakusha: McGraw–Hill<br />
Johnston AW (1991) Mak<strong>in</strong>g sense of the M, N and log MAR systems<br />
of specify<strong>in</strong>g visual acuity. Probl Optom (Lipp<strong>in</strong>cott) 3 (3), 394–407<br />
Jones D, Westall C, Averbeck K, Abdolell M (2003) <strong>Visual</strong> acuity<br />
assessment: a comparison of two tests for measur<strong>in</strong>g children’s vision.<br />
Ophthalmol Physiol Opt 23 (6), 541–6<br />
Keeler CH (1956) <strong>Visual</strong> aids for the partially sighted. Trans<br />
Ophthalmol Soc UK 76, 605–14<br />
Landolt E (1899) Nouveaux opto-types pour la déterm<strong>in</strong>ation de<br />
l’acuité visuelle. Arch Ophthalmol Paris 19, 465–471<br />
McGraw PV, W<strong>in</strong>n B (1993) Glasgow acuity cards: a new test for the<br />
measurement of letter acuity <strong>in</strong> children. Ophthalmol Physiol Opt 13<br />
(4), 400–3<br />
McGraw P, W<strong>in</strong>n B, Whitaker D (1995) Reliability of the Snellen chart.<br />
BMJ 310, 1481–2<br />
Monoyer M (1875) Echelle typographique décimale pour mésurer<br />
l’acuité de la vue. CR Hebd Séance Acad Sci Paris 80, 1137–8<br />
NAS–NRC (National Academy of Science: National Research Council<br />
Vision Committee on Vision) (1980) Recommended standard<br />
procedures for the cl<strong>in</strong>ical measurement and specification of visual<br />
acuity (report 39). Adv Ophthalmol 41, 103–48<br />
Neumann AC, McCarty GR, Locke J, Cobb B (1988) Glare disability<br />
devices for cataract: a consumer’s guide. J Cataract Refract Surg 14,<br />
212–16<br />
Ogle KN (1953) On the problem of an <strong>in</strong>ternational nomenclature for<br />
designat<strong>in</strong>g visual acuity. Am J Ophthalmol 36, 909–21<br />
Pandit JC (1994). Test<strong>in</strong>g acuity of vision <strong>in</strong> general practice: reach<strong>in</strong>g<br />
recommended standards. BMJ 309, 1408<br />
Pelli DG, Robson JG, Wilk<strong>in</strong>s AJ (1988) The design of a new letter<br />
chart for measur<strong>in</strong>g contrast sensitivity. Cl<strong>in</strong> Vision Sci 2 (3),<br />
187–200<br />
67<br />
<strong>Visual</strong> <strong>Acuity</strong><br />
Raasch T, Bailey I (1984) Choice of optotype and spac<strong>in</strong>g affect visual<br />
acuity scores. Invest Ophthalmol Vis Sci 25 (suppl. 86), 145<br />
Regan D (1988) Low contrast letter charts and s<strong>in</strong>ewave grat<strong>in</strong>g tests<br />
<strong>in</strong> ophthalmological and neurological disorders. Cl<strong>in</strong> Vision Sci 2,<br />
235–50<br />
Rosser DA, Laidlaw DAH, Murdoch IE (2001) The development of a<br />
‘reduced log MAR’ visual acuity chart for use <strong>in</strong> rout<strong>in</strong>e cl<strong>in</strong>ical<br />
practice. Br J Ophthalmol 85, 432–6<br />
Sheedy JE, Bailey IL, Raasch TW (1984) <strong>Visual</strong> acuity and chart<br />
lum<strong>in</strong>ance. Am J Optom Physiol Opt 61 (9), 595–600<br />
Sloan LL (1951). Measurement of visual acuity. AMA Arch<br />
Ophthalmol 45, 704–25<br />
Sloan LL (1959) New test charts for the measurement of visual acuity<br />
at far and near distances. Am J Ophthalmol 48 (6), 807–13<br />
Sloan LL, Rowland WM, Altman A (1952) Comparison of three types<br />
of test target for the measurement of visual acuity. Q Rev Ophthalmol<br />
8, 4–16<br />
Snell AC, Sterl<strong>in</strong>g S (1926) An experimental <strong>in</strong>vestigation to<br />
determ<strong>in</strong>e the percentage relation between macular acuity of vision<br />
and macular perception. In: Menasha G (ed.) Contributions to<br />
Ophthalmic Science, pp. 52–62. Banta<br />
Snellen H (1862) Letterproeven tot Bepal<strong>in</strong>g der Gezigtsscherpte.<br />
Utrecht: PW Vander Weijer<br />
Snellen H (1864) Test Types for the Determ<strong>in</strong>ation of the Acuteness of<br />
Vision. Official War Office edition (2nd edn). Utrecht: PW Vander<br />
Weijer<br />
Sonksen PM, Silver J (1988) The Sonksen Silver <strong>Acuity</strong> System. Test<br />
System and Instruction Manual. W<strong>in</strong>dsor: Keeler<br />
Spaeth EB, Fralick FB, Hughes WF, Scheie HG (1955) American<br />
Medical Association council on <strong>in</strong>dustrial health: special report,<br />
estimation of loss of visual efficiency. Arch Ophthalmol 54, 462–8<br />
Stiles WS, Crawford BH (1933) The lum<strong>in</strong>ous efficiency of rays<br />
enter<strong>in</strong>g the eye pupil at different po<strong>in</strong>ts. Proc R Soc (Lond) Biol 112,<br />
428–50<br />
Strong G, Woo GC (1985) A distance visual acuity chart <strong>in</strong>corporat<strong>in</strong>g<br />
some new design features. Arch Ophthalmol 103, 44–6<br />
Swa<strong>in</strong>e W (1925) The relation of visual acuity and accommodation to<br />
ametropia. Trans Opt Soc 9–27<br />
Taylor JF (ed.) (1995) Medical Aspects of Fitness to Drive. London:<br />
Medical Commission on Accident Preventions<br />
Tunnacliffe A (1994) <strong>Visual</strong> acuity updated: 4. Br J Optom Dispens 2<br />
(12), 455–8<br />
Walker JPS (1942) Test type. Br J Ophthalmol 26, 556–559<br />
Weber EH (1834) De Pulsu, Resorptione, Auditu et Tactu<br />
Annotationes Anatomicae et Physiologicae. Leipzig: CF Koehler<br />
Westheimer G (1964) Pupil size and visual resolution. Vis Res 4, 39–45<br />
Westheimer G (1979) Scal<strong>in</strong>g of visual acuity measurement. Arch<br />
Ophthalmol 97, 327–30<br />
Woo G, Lo P (1980) A Ch<strong>in</strong>ese word acuity chart with new design<br />
pr<strong>in</strong>ciples. S<strong>in</strong>gapore Med J 21, 689–92<br />
Woodruff EW (1947) <strong>Visual</strong> acuity and the selection of test letters. In:<br />
Some Recent Advances <strong>in</strong> Ophthalmic Optics, pp. 59–70. London:<br />
Hatton Press<br />
World Health Organization (1979) Guidel<strong>in</strong>es for Programmes for the<br />
Prevention of Bl<strong>in</strong>dness. Geneva: World Health Organization
AJ Jackson & IL Bailey<br />
Multiple Choice Questions<br />
This paper is reference C5333b. Four College credits are available. Please use the <strong>in</strong>serted answer sheet. Copies can be obta<strong>in</strong>ed<br />
from <strong>Optometry</strong> <strong>in</strong> <strong>Practice</strong> Adm<strong>in</strong>istration, PO Box 6, Skelmersdale, Lancashire WN8 9FW. There is only one correct answer for<br />
each question.<br />
1. The diffraction pattern of the image of a po<strong>in</strong>t source<br />
of light<br />
(a) Has a Gaussian profile.<br />
(b) Consists of a series of concentric circles.<br />
(c) Has a central disk surround by r<strong>in</strong>gs.<br />
(d) Is <strong>in</strong>dependent of wavelength.<br />
(e) Is <strong>in</strong>dependent of pupil size.<br />
2. Monochromatic light from a po<strong>in</strong>t object, focused by<br />
the optics of the eye, forms a patch of light on the<br />
ret<strong>in</strong>a. The light distribution across the patch is<br />
referred to as the<br />
(a) Ramsden disk.<br />
(b) Petzval surface.<br />
(c) Interval of Sturm.<br />
(d) Contrast sensitivity function<br />
(e) Po<strong>in</strong>t spread function.<br />
3. In a system free of aberrations or defocus, visual<br />
resolution<br />
(a) Is poorer with smaller pupils.<br />
(b) Is better with smaller pupils.<br />
(c) Is <strong>in</strong>dependent of the wavelength of light.<br />
(d) Is better when the po<strong>in</strong>t spread function is larger.<br />
(e) Is better if the areas of the foveal cones are larger.<br />
4. Under photopic conditions, the differential contrast<br />
threshold rema<strong>in</strong>s a constant ratio of approximately<br />
(a) 80%<br />
(b) 20%<br />
(c) 15%<br />
(d) 1%<br />
(e) 0.1%<br />
5. For a 3-bar target, spurious resolution<br />
(a) Causes vertical l<strong>in</strong>es to appear horizontal.<br />
(b) Causes noticeable colored fr<strong>in</strong>ges.<br />
(c) Causes a doubl<strong>in</strong>g of the spatial frequency.<br />
(d) Causes the 3 l<strong>in</strong>es to appear to be 2.<br />
(e) Causes the 3 l<strong>in</strong>es to appear to be 4.<br />
6. Hyperacuities<br />
(a) Occur only for s<strong>in</strong>usoidal grat<strong>in</strong>g targets.<br />
(b) Occur only under b<strong>in</strong>ocular view<strong>in</strong>g and bi-foveal<br />
fixation.<br />
(c) Occur because of vertical orthophoria.<br />
(d) Occur because of pool<strong>in</strong>g <strong>in</strong>formation from the two<br />
eyes.<br />
(e) Occur because of pool<strong>in</strong>g of spatial <strong>in</strong>formation<br />
across receptors.<br />
68<br />
7. Regard<strong>in</strong>g optotypes for visual acuity measurement<br />
(a) British Standard letters are all 5x4 letters with serifs.<br />
(b) Sloan letters are all 5x5 letters without serifs.<br />
(c) Keeler chart letters all have stroke widths that are<br />
20% of the letter height.<br />
(d) Landolt’s R<strong>in</strong>gs were developed before Snellen’s<br />
Letters.<br />
(e) Snellen’s orig<strong>in</strong>al letter set were all 5x5 letters.<br />
8. The term “Oxyoptre” as suggested by Blaskovics is a<br />
measure of<br />
(a) Ret<strong>in</strong>al image blur <strong>in</strong> diopters.<br />
(b) Optical defocus.<br />
(c) The reciprocal of the visual angle <strong>in</strong> degrees.<br />
(d) Spatial frequency.<br />
(e) Longitud<strong>in</strong>al chromatic aberration <strong>in</strong> diopters.<br />
9. Regard<strong>in</strong>g the designation of visual acuity<br />
(a) The Snellen fraction is a measure of letter height.<br />
(b) The MAR is the angle that the letter (or optotype)<br />
height subtends at the eye.<br />
(c) If a chart follows the Bailey-Lovie format, each letter<br />
has a value of 0.02 logMAR units.<br />
(d) LogMAR notation can only be used if there is the<br />
same number of letters on each row.<br />
(e) In decimal notation, 2.0 is equivalent to 6/12.<br />
10. Which of the follow<strong>in</strong>g is NOT true about charts that<br />
follow the Bailey Lovie pr<strong>in</strong>ciples<br />
(a) The progression of size should follow a constant<br />
ratio.<br />
(b) There should be the same number of letters (or<br />
optotypes) per row.<br />
(c) The letters (or optotypes) chosen for each row<br />
should be balanced for difficulty.<br />
(d) Between-row spac<strong>in</strong>g should be proportional to letter<br />
height.<br />
(e) Between-letter spac<strong>in</strong>g should be proportionally<br />
greater when letter sizes are smaller.<br />
11. Compar<strong>in</strong>g the merits of row-by-row and letter-byletter<br />
scor<strong>in</strong>g methods<br />
(a) If us<strong>in</strong>g letter-by-letter scor<strong>in</strong>g, you are more likely<br />
to get exactly the same score for test and retest.<br />
(b) If us<strong>in</strong>g row-by-row scor<strong>in</strong>g, you are less likely to<br />
have 1 row difference between test and retest.<br />
(c) If us<strong>in</strong>g row-by-row scor<strong>in</strong>g, you are less likely to<br />
have 2 rows difference between test and retest.<br />
(d) If us<strong>in</strong>g letter-by-letter scor<strong>in</strong>g, you ignore errors<br />
made at sizes larger than the smallest row on which<br />
more than 50% of the letters were read correctly.<br />
(e) If us<strong>in</strong>g letter-by-letter scor<strong>in</strong>g, you are substantially<br />
more able to identify changes <strong>in</strong> visual acuity.<br />
Questions for this paper are cont<strong>in</strong>ued on <strong>in</strong>side back cover