Fact sheet - DWS Managed Municipal Bond Fund - DWS Investments
Fact sheet - DWS Managed Municipal Bond Fund - DWS Investments
Fact sheet - DWS Managed Municipal Bond Fund - DWS Investments

Create successful ePaper yourself
Turn your PDF publications into a flip-book with our unique Google optimized e-Paper software.
Eligible for $250,000<br />
NAV purchase privilege †<br />
TAX-FREE INCOME FUND<br />
<strong>DWS</strong> <strong>Managed</strong> <strong>Municipal</strong> <strong>Bond</strong> <strong>Fund</strong><br />
SHARE CLASS: A I SMLAX C I SMLCX INST I SMLIX S I SCMBX<br />
The fund seeks to provide income exempt from regular federal income tax.<br />
Q 4 2 0 1 2<br />
Regardless of market conditions, fund managers use a risk-focused management style and seek to preserve principal. They don't seek additional<br />
yield if doing so would, in their opinion, put investor capital at risk. Unlike some competitors, managers don't try to predict the direction of interest<br />
rates.<br />
All data (as of 12/31/12)<br />
M O R N I N G S T A R ® R A T I N G<br />
Overall rating: Class S shares (as of 12/31/12)<br />
<br />
Source: Morningstar, Inc. Ratings are<br />
historical and do not guarantee future<br />
results. There were 220, 220, 203 and 171<br />
funds in the Muni National Long category<br />
during the Overall, three-year, five-year and<br />
10-year periods. Ratings are based on riskadjusted<br />
performance. The Overall rating for<br />
a fund is a weighted average of the ratings<br />
for the time periods indicated. Ratings are 4<br />
stars for 3-year, 5 stars for 5-year and 5 stars<br />
for the 10-year periods.<br />
M O R N I N G S T A R R A N K I N G S —<br />
C L A S S S<br />
M U N I N A T I O N A L L O N G<br />
1-year<br />
3-year<br />
5-year<br />
10-year<br />
#81 of 237 funds<br />
#107 of 220 funds<br />
#33 of 203 funds<br />
#27 of 171 funds<br />
Top 34%<br />
Top 48%<br />
Top 16%<br />
Top 16%<br />
Source: Morningstar, Inc. Rankings are<br />
historical and do not guarantee future<br />
results. Rankings are based on the fund's<br />
total returns, unadjusted for sales charges,<br />
with distributions reinvested. If sales<br />
charges had been included, rankings may<br />
have been less favorable. Rankings of other<br />
classes may vary.<br />
† If you're investing $250,000 or more, you<br />
may be eligible to purchase Class A shares<br />
of this fund without a sales charge.<br />
However, redemptions within 12 months<br />
may be subject to sales charges. See the<br />
prospectus for details<br />
Portfolio management/industry experience<br />
Philip G. Condon<br />
Ashton P. Goodfield CFA<br />
Matthew J. Caggiano CFA<br />
Michael J. Generazo<br />
Top States<br />
California<br />
Texas<br />
Illinois<br />
Florida<br />
New York<br />
Sector composition<br />
36 years<br />
26 years<br />
23 years<br />
18 years<br />
16%<br />
11%<br />
10%<br />
7%<br />
5%<br />
Portfolio characteristics<br />
Number of holdings<br />
Total net assets<br />
Effective maturity<br />
Effective duration<br />
Turnover rate (%) §<br />
Credit quality breakdown*<br />
AAA<br />
AA<br />
A<br />
BBB<br />
Not Rated<br />
Revenue bonds<br />
General obligation bonds<br />
ETM/Prerefunded<br />
Cash equivalents<br />
561<br />
$5.50 billion<br />
6.59 years<br />
6.24 years<br />
Effective maturity is the weighted average of the bonds held by the fund taking into consideration any available maturity<br />
shortening features. Effective duration is an approximate measure of the fund's sensitivity to interest rate changes<br />
taking into consideration any maturity shortening features.Turnover rate is the rate of trading activity in a fund’s portfolio<br />
of investments, equal to the lesser of purchases or sales, for a year, divided by average total assets for that year.<br />
§ Source: Morningstar, Inc.<br />
* Credit quality represents the higher rating of either Moody’s Investors Service or Standard & Poor’s<br />
and is their opinion as to the quality of the securities they rate. Credit quality does not remove market risk and is subject<br />
to change.<br />
©2013 Morningstar, Inc. All rights reserved. Morningstar, shall not be responsible for investment decisions, damages or<br />
other losses resulting from use of this rating. For each fund with at least a 3-year history, Morningstar calculates a Rating<br />
based on a risk-adjusted return measure that accounts for variation in a fund’s monthly performance (including the effects<br />
of sales charges, loads and redemption fees), placing more emphasis on downward variations and rewarding consistent<br />
performance. The top 10% of funds in a category receive 5 stars, the next 22.5% receive 4 stars, the next 35% receive 3<br />
stars, the next 22.5% receive 2 stars and the bottom 10% receive 1 star. (Each share class is counted as a fraction of one<br />
fund within this scale and rated separately, which may cause slight variations in the distribution percentages.) Loadwaived<br />
ratings for A shares should only be considered by investors who are not subject to a front end sales charge.<br />
Contact your investment professional regarding eligibility to purchase load-waived Class A shares.<br />
No bank guarantee I Not FDIC insured I May lose value<br />
Lease<br />
27.00<br />
8%<br />
33%<br />
47%<br />
9%<br />
3%<br />
70%<br />
16%<br />
7%<br />
4%<br />
3%
<strong>DWS</strong> <strong>Managed</strong> <strong>Municipal</strong> <strong>Bond</strong> <strong>Fund</strong><br />
<strong>Fund</strong> risks<br />
<strong>Bond</strong> investments are subject to interestrate<br />
and credit risks. When interest rates<br />
rise, bond prices generally fall. Credit risk<br />
refers to the ability of an issuer to make<br />
timely payments of principal and interest.<br />
<strong>Investments</strong> in lower-quality ("junk bonds")<br />
and non-rated securities present greater risk<br />
of loss than investments in higher-quality<br />
securities. The fund invests in inverse<br />
floaters, which are derivatives that involve<br />
leverage and could magnify the fund's gains<br />
or losses. Although the fund seeks income<br />
that is federally tax-free, a portion of the<br />
fund’s distributions may be subject to<br />
federal, state and local taxes, including the<br />
alternative minimum tax. See the prospectus<br />
for details.<br />
Consider the investment objective, risks,<br />
charges and expenses carefully before<br />
investing. For a summary prospectus, or<br />
prospectus that contains this and other<br />
information, download one from<br />
www.dws-investments.com or talk to your<br />
financial representative. Read the<br />
prospectus carefully before investing.<br />
<strong>DWS</strong> <strong>Investments</strong> is part of Deutsche<br />
Bank's Asset Management division and,<br />
within the US, represents the retail asset<br />
management activities of Deutsche Bank<br />
AG, Deutsche Bank Trust Company<br />
Americas, Deutsche Investment<br />
Management Americas Inc. and <strong>DWS</strong> Trust<br />
Company.<br />
<strong>DWS</strong> <strong>Investments</strong> Distributors, Inc.<br />
222 South Riverside Plaza<br />
Chicago, IL 60606-5808<br />
www.dws-investments.com<br />
service@dws.com<br />
Tel (800) 621-1148 TDD (800) 972-3006<br />
© 2013 <strong>DWS</strong> <strong>Investments</strong> Distributors, Inc.<br />
All rights reserved.<br />
(1/13) R-3071-12 DMMBF-FACT<br />
(in thousands)<br />
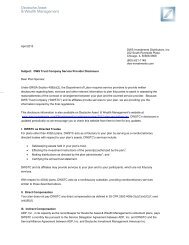
Growth of a $10,000 investment in Class S shares from 12/31/02 to 12/31/12<br />
$20<br />
$15<br />
$10<br />
$5<br />
12/02 12/04<br />
12/06<br />
12/08<br />
12/10<br />
12/12<br />
<strong>DWS</strong> <strong>Managed</strong> <strong>Municipal</strong> <strong>Bond</strong> <strong>Fund</strong> $16,598 Barclays <strong>Municipal</strong> <strong>Bond</strong> Index $16,451<br />
Source: Deutsche Asset Management.<br />
Average annual total returns (as of 12/31/12)*<br />
Share class<br />
YTD<br />
1-year<br />
Unadjusted for sales charge (would be lower if adjusted)<br />
A<br />
C<br />
Adjusted for maximum sales charge<br />
A (max 2.75% load)<br />
C (max 1.00% CDSC)<br />
Other share classes<br />
INST<br />
S<br />
Barclays <strong>Municipal</strong> <strong>Bond</strong><br />
Index 1<br />
9.52%<br />
8.68%<br />
6.51%<br />
8.68%<br />
9.78%<br />
9.70%<br />
6.78%<br />
Historical total returns (as of 12/31/12)<br />
S<br />
2012<br />
9.70%<br />
2011<br />
9.89%<br />
2010<br />
1.50%<br />
2009<br />
17.53%<br />
9.52%<br />
8.68%<br />
6.51%<br />
8.68%<br />
9.78%<br />
9.70%<br />
6.78%<br />
2008<br />
-5.72%<br />
3-year<br />
6.77%<br />
5.96%<br />
5.78%<br />
5.96%<br />
7.04%<br />
6.96%<br />
6.57%<br />
2007<br />
3.47%<br />
5-year<br />
6.08%<br />
5.28%<br />
5.49%<br />
5.28%<br />
6.34%<br />
6.28%<br />
5.91%<br />
2006<br />
5.05%<br />
10-year<br />
4.98%<br />
4.19%<br />
4.69%<br />
4.19%<br />
5.23%<br />
5.20%<br />
5.10%<br />
2005<br />
3.85%<br />
Life of fund<br />
n/a<br />
n/a<br />
n/a<br />
n/a<br />
5.27%<br />
n/a<br />
n/a<br />
2004<br />
3.10%<br />
Inception<br />
6/11/01<br />
6/11/01<br />
6/11/01<br />
6/11/01<br />
8/19/02<br />
10/14/76<br />
n/a<br />
2003<br />
5.20%<br />
Performance is historical and does not guarantee future results. Investment returns and principal fluctuate so your<br />
shares may be worth more or less when redeemed. Current performance may differ from the data shown. Please<br />
visit www.dws-investments.com for the fund’s most recent month-end performance. <strong>Fund</strong> performance includes<br />
reinvestment of all distributions. Index returns do not reflect fees or expenses and it is not possible to invest directly in an<br />
index. Not all share classes are available to all investors.<br />
*The fund's performance prior to inception reflects that of Class S. Returns prior to inception reflect the original share<br />
class performance, adjusted for higher operating expenses and/or the maximum sales charge.<br />
The gross expense ratio is 0.82% for A shares, 1.59% for C shares, 0.64% for S shares and 0.56% for INST shares. The<br />
net expense ratio is 0.82% for A shares, 1.59% for C shares, 0.64% for S shares and 0.56% for INST shares. The net<br />
expense charge for this fund does not include any fee waivers.<br />
1 Barclays <strong>Municipal</strong> <strong>Bond</strong> Index tracks the performance of investment-grade, fixed-rate municipal bonds with maturities<br />
greater than two years.