Compressive Loading Test of Corroded Gusset Plate Connection
Compressive Loading Test of Corroded Gusset Plate Connection
Compressive Loading Test of Corroded Gusset Plate Connection

Create successful ePaper yourself
Turn your PDF publications into a flip-book with our unique Google optimized e-Paper software.
COMPRESSIVE LOADING TEST OF CORRODED GUSSET PLATE<br />
CONNECTION IN STEEL TRUSS BRIDGE<br />
Jun Murakoshi 1 , Naoki Toyama 1 , Mamoru Sawada 1 , Kentaro Arimura 1 , Lu Guo 1<br />
Kuniei Nogami 2 , Teruhiko Yoda 3 , Hideyuki Kasano 3<br />
Abstract<br />
With the stock aging <strong>of</strong> the majority <strong>of</strong> highway bridges in Japan constructed<br />
during the 1950s–1970s, some serious corrosion deterioration cases <strong>of</strong> fracture critical<br />
members in steel truss bridges have been reported recently. In this paper, compressive<br />
loading test <strong>of</strong> severely-corroded gusset plate connections cut out from a demolished<br />
truss bridge were conducted in order to assess the remaining load capacity.<br />
Introduction<br />
The majority <strong>of</strong> highway bridges in Japan were constructed during the<br />
1950s–1970s which coincides with Japan’s high economic growth period, and the<br />
number <strong>of</strong> bridges over 50 years is increasing drastically. With increase <strong>of</strong> aged bridges,<br />
since these bridges are exposed to heavy traffic and severe natural environment, it is<br />
highly probable that the deterioration and damage will increase rapidly. Improvement<br />
<strong>of</strong> technologies related to inspection, diagnosis, repair, and rehabilitation needed.<br />
Concerning steel bridges, some serious deterioration cases <strong>of</strong> FCMs on steel truss<br />
bridges have been reported recently. A tension diagonal member <strong>of</strong> steel truss<br />
embedded inside the deck concrete fractured in the Kiso River Bridge and Honjo<br />
Bridge on the National Route because <strong>of</strong> corrosion that invisibly progressed inside the<br />
concrete in 2007. Fracture <strong>of</strong> diagonal members or gusset plate connections <strong>of</strong> truss<br />
bridge is likely to lead to fatal damage <strong>of</strong> whole bridge. On the other hands, there was<br />
no effective measure to evaluate remaining strength <strong>of</strong> such deteriorated components<br />
and the whole bridge system with the uncertain section loss from corrosion.<br />
The authors initiated research project in order to identify the remaining load<br />
capacity and to investigate how to evaluate the remaining strength <strong>of</strong> deteriorated<br />
diagonal members and riveted gusset plate connections subjected to severe corrosion.<br />
In this research project, several corroded specimens are going to be tested within a few<br />
years. These specimens consist <strong>of</strong> diagonals and gusset plate connections which were<br />
cut out from demolished steel bridges which were in service about 50 years near<br />
coastal area.<br />
This paper reports the preliminary results from <strong>of</strong> compressive loading test <strong>of</strong><br />
the first one specimen conducted in September, 2011, and discusses compressive<br />
behavior and the ultimate strength for severely-corroded gusset plate connection.<br />
1 Center for Advanced Engineering Structural Assessment and Research(CAESAR),<br />
Public Works Research Institute(PWRI)<br />
2 Department <strong>of</strong> Civil and Environmental Engineering, Tokyo Metropolitan University<br />
3 Department <strong>of</strong> Civil and Environmental Engineering, Waseda University
Before the test, section loss was measured using laser measurement equipment, and the<br />
effect <strong>of</strong> the section loss on failure behavior and the ultimate strength were examined<br />
by Finite Element analyses to complement experimental results. Then the authors<br />
compare experimental results with analysis results and strength equations in gusset<br />
plate connections.<br />
Bridge Description<br />
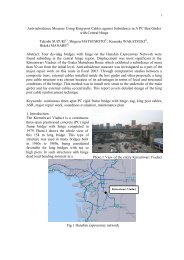
Figure 1 shows a bridge utilized in this project, which is called Choshi Bridge.<br />
It was built in 1962 across Tone River, called Choshi Bridge. It was 5-span steel<br />
through truss bridge with total length <strong>of</strong> 407.4m. Figure 2 shows general and section<br />
view <strong>of</strong> the bridge. The average daily traffic is about 20,000 with 10% <strong>of</strong> heavy<br />
vehicles. It was located in river mouth and had suffered from salt damage by airborne<br />
salt and heavily corroded. Although repainting, strengthening and partial replacement<br />
<strong>of</strong> severely corroded members were conducted several times through its service life, it<br />
was finally replaced in 2009 at 47 years old, because the corrosion was unlikely to stop<br />
and it is considered to be impossible to assess remaining strength and remaining<br />
service life.<br />
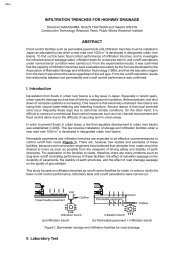
Figure 3 shows corrosion damage focusing on main members and gusset plate<br />
connection that influence safety <strong>of</strong> the whole bridge. Steel members <strong>of</strong> this bridge have<br />
been repainted by the thick fluorine coating material, so section loss was not able to be<br />
observed exactly by visual inspection. Corrosion <strong>of</strong> gusset plate connections are shown<br />
in Figure 3(a) (b). Several connections and diagonals were strengthened with steel<br />
plate bonding (see Figure 3(c) ). Intense corrosion <strong>of</strong> diagonal joint is shown in Figure<br />
3(d). Pitting <strong>of</strong> diagonal was observed in Figure 3(e). Concerning floor beams, Figure<br />
3 (f) shows typical area <strong>of</strong> deterioration <strong>of</strong> floor beam with debris accumulation.<br />
Compression Load <strong>Test</strong><br />
Specimen Description and Experimental Setup<br />
After demolished, several connection parts and diagonal members were cut out<br />
as experimental specimens, and carried to our laboratory after the coating was removed.<br />
For the present, we are planning to conduct the loading test for 4 specimens which have<br />
different gusset configurations. Figure 4 shows the first one test specimen, which was<br />
cut out from upper chord connection P25d near intermediate support. The diagonal is<br />
square box type section with flange <strong>of</strong> 500mm width and 10 and 12 mm thickness at the<br />
connection, and thickness <strong>of</strong> gusset plate is 12mm. Design axial force/stress <strong>of</strong> the<br />
diagonal members are listed in Table 1. Steel grade is SM40 (400MPa nominal tensile<br />
strength), the yield strength is 284MPa by tensile material test <strong>of</strong> the diagonal member.<br />
Section loss at the outer and inner surface <strong>of</strong> the specimen was measured using<br />
laser surface measurement equipment (see Figure 5). The measurement interval was set<br />
to 1mm to understand the mechanical behavior for uneven surface. As it was difficult<br />
to measure the inner surface directly, the surface shape was taken using plaster, and<br />
then it was measured. Figure 6 shows contours <strong>of</strong> corrosion areas. Red area means
large section loss, and yellow color means non-corrosion areas. Severe section loss was<br />
observed at connection parts <strong>of</strong> diagonal and gusset plate. As for the gusset plates,<br />
severe sections loss on the outer surface was not be seen except the rivets areas. Severe<br />
section was observed on the inner surface, where humidity seems high and airborne salt<br />
is likely to accumulate. As for the compression diagonal, large section loss on the outer<br />
surface was hardly found except the edge <strong>of</strong> flange, however, large section loss was<br />
shown on the inner surface around the gusset plate boundary. The maximum corrosion<br />
depth on the inner surface <strong>of</strong> the compression diagonal is 8.0mm (thickness <strong>of</strong> the<br />
diagonal flange: 12mm), the average corrosion depth is 3.4mm. The maximum and the<br />
average corrosion depths on the inner surface <strong>of</strong> the gusset plate are 9.0mm and 4.0mm<br />
respectively. The average corrosion depth at the plate area underneath the diagonal is<br />
6.7mm. The average remaining thickness <strong>of</strong> the gusset plate is 8.0mm. The average<br />
reduction area ratio is 19% for the compression diagonal and 33% for the gusset plate.<br />
Comparing the measured section loss distribution with FE analysis results, it was<br />
found that severe corrosion part generally corresponded to the part where large stress<br />
appears. As a result, gusset plate connections may be structural weakpoint.<br />
Figure 7 shows outline <strong>of</strong> specimen and loading frame. Figure 8 shows<br />
experimental setup. The compression and the tension axial loads were applied to the<br />
diagonal members at the same load increment step, because the absolute values <strong>of</strong> the<br />
design axial forces <strong>of</strong> both diagonals are almost equal. However, by the restrictioin <strong>of</strong><br />
capacity <strong>of</strong> tension jack, tensile load was fixed to 2000kN. 30MN testing machine for<br />
compression and loading frame with jacks for tension were used for bi-axial loading.<br />
Analysis Method<br />
FE analyses were carried out to investigate the effect <strong>of</strong> section loss on<br />
compressive behavior by using a model shown in Figure 9. The analysis model<br />
simulated test condition. In modeling, 4 nodes shell elements were used for gusset<br />
plates and diagonals. Rivet fasteners were modeled by spring elements. The<br />
stress-strain relation <strong>of</strong> steel was assumed to be bi-linear, with a second modulus <strong>of</strong><br />
E/100(E=2×10 5 MPa). Upper chord was restrained with the loading frame at<br />
connection part. The displacement along the loading direction at the loading point is<br />
free, and the displacements <strong>of</strong> two other directions are fixed. In this analysis, the initial<br />
imperfection is not considered.<br />
Analyses were conducted for two cases <strong>of</strong> non-corroded and corroded model<br />
simulating test specimen. Figure 10 shows assumed plate thickness <strong>of</strong> corroded model<br />
which reflects the measured data. Average thickness reductions were 2.0mm for the<br />
diagonal flange, 3.0mm for the diagonal web and 4.0mm for the gusset plate,<br />
respectively.<br />
Experimental and Analysis Results<br />
Figure 11 shows the curves <strong>of</strong> load versus vertical displacement at the loading<br />
head. The analytical ultimate strengths were 4953kN for the un-corroded model and<br />
3346kN for the corroded model. The ratio <strong>of</strong> the strengths is about 2/3, which is similar
to average thickness loss <strong>of</strong> the gusset plate. The measured ultimate strength was<br />
3598kN, that is about 1.1 times the analytical value for the corroded model. Linear<br />
behavior was observed until the out-<strong>of</strong>-plane deformation <strong>of</strong> gusset plate become large.<br />
After that, the load reached maximum load gradually and fell down moderately. The<br />
measured value and analytical value show generally the same curves and ultimate<br />
loads.<br />
Figure 12 shows failed specimen after the test. The failure mode <strong>of</strong> the<br />
specimens was plate local buckling <strong>of</strong> the gusset. Figure 13 shows out-<strong>of</strong>-plane<br />
deformation and relations between load and the deformation <strong>of</strong> the both side <strong>of</strong> gusset<br />
plates at major points. With increase <strong>of</strong> vertical load, deformation <strong>of</strong> one side <strong>of</strong> the<br />
gusset plate preceded with the other side <strong>of</strong> the gusset. As a result, the buckling shape <strong>of</strong><br />
unsupported edge shows unsymmetry. As for the analytical results <strong>of</strong> the corroded<br />
model, Von Mises stress contours and yielded area at the peak load are shown in Figure<br />
14 and Figure 15, respectively. The local buckling occurred at the plate area<br />
underneath the diagonals and free edges <strong>of</strong> the gusset plate. Figure 16 compares the<br />
out-<strong>of</strong>-plane deformation at major points where large deformations were measured and<br />
shows good agreement. For reference, analytical out-<strong>of</strong>-plane deformation contours <strong>of</strong><br />
the corroded model are also shown in this figure. The results in these figures provide<br />
verification <strong>of</strong> the corroded model using shell element to evaluate compressive<br />
behavior <strong>of</strong> the corroded gusset plate connection. About the modeling <strong>of</strong> the corrosion,<br />
the use <strong>of</strong> average reduction thickness <strong>of</strong> gusset plate seems reasonable to evaluate the<br />
behavior <strong>of</strong> the gusset plate in this specimen, however detailed investigation is required.<br />
Figure 17 shows the out-<strong>of</strong>-plane displacement along the line parallel to the centerline<br />
<strong>of</strong> the compression diagonal.<br />
Strength Estimation Equations <strong>of</strong> Truss <strong>Gusset</strong> <strong>Plate</strong> <strong>Connection</strong>s<br />
Strength Equations<br />
After the collapse <strong>of</strong> I-35W Bridge, “Load Rating Guidance and Examples for<br />
Bolted and Riveted <strong>Gusset</strong> <strong>Plate</strong>s in Truss Bridges” [2] was issued by FHWA in 2009.<br />
By referencing the Guidance and previous experimental research results [3]- [7], limit<br />
state <strong>of</strong> gusset plate and diagonal members are assumed as follows as shown in Figure<br />
18,<br />
a) Strength <strong>of</strong> fasteners in compression and tension<br />
b) Cross section yielding or net section fracture strength <strong>of</strong> gusset plate<br />
c) Block shear rupture strength in tension<br />
d) Cross section yielding or net section fracture strength <strong>of</strong> diagonal member<br />
e) <strong>Compressive</strong> strength<br />
f) Shear fracture strength<br />
This paper only discusses compressive strengths <strong>of</strong> b), d) and e). The resistance<br />
factors are1.0 in this study.
Cross section yielding strength <strong>of</strong> gusset plate in compression<br />
The Whitmore effective width[3] is used for estimating yielding <strong>of</strong> the gusset<br />
plate. The effective width is bound on either side by the closer <strong>of</strong> the nearest adjacent<br />
plate edges or lines constructed starting from the external fasteners within the first row<br />
and extending from these fasteners at an angle <strong>of</strong> 30 degrees with respect to the line <strong>of</strong><br />
action <strong>of</strong> the axial force (see Figure 19). The cross section yielding is taken as:<br />
P gy = f y A<br />
(1)<br />
e<br />
where:<br />
Ae:gross cross-sectional area <strong>of</strong> Whitmore effective width <strong>of</strong> the plate, Ae=Let(mm 2 )<br />
fy: yield strength <strong>of</strong> the plate (N/mm 2 )<br />
Le:Whitmore effective width (see Figure 19)(mm)<br />
t: thickness <strong>of</strong> the plate (mm)<br />
Cross section yielding <strong>of</strong> diagonal member<br />
The smallest sectional area <strong>of</strong> the diagonal members near the gusset plate<br />
boundary is assumed to be yielded. The cross section yielding strength is expressed by:<br />
P dy = f y Ag<br />
(2)<br />
where:<br />
fy: yield strength <strong>of</strong> the diagonal (N/mm 2 )<br />
Ag: gross cross-sectional area <strong>of</strong> the diagonal (mm 2 )<br />
Local buckling at the plate area underneath the splice member <strong>of</strong> diagonals<br />
The Whitmore effective width and an unbraced gusset plate length which is<br />
average <strong>of</strong> the three lengths was used for estimating buckling strength. Standard<br />
buckling equations specified in Japanese Design code (JSHB) was used. Ignoring any<br />
lateral constraint to the gusset plate, the effective length factor, β (β=1.2) was used for<br />
unbraced gusset plate assuming the buckled shape as shown in Figure 20. The local<br />
buckling equation is taken as:<br />
P = f A<br />
(λ ―<br />
≦0.2) (3a)<br />
gcr<br />
gcr<br />
y<br />
g<br />
P = ( 1.<br />
109−<br />
0.<br />
545λ<br />
) f<br />
where:<br />
fy: yield strength <strong>of</strong> the plates (N/mm 2 )<br />
Ag: gross cross-sectional area (mm 2 )<br />
gcr<br />
y<br />
y<br />
A<br />
g<br />
g<br />
(0.2
The column slenderness ratio λ ―<br />
is given by:<br />
1 f βL<br />
λ ・<br />
y c<br />
= ・<br />
(4)<br />
π E rs<br />
where:<br />
E: Young’s modulus <strong>of</strong> plate (N/mm 2 )<br />
β: effective length factor (=1.2)<br />
Lc: Lc = (L1+L2+L3)/3<br />
L1, L2, L3: distance from center or each end <strong>of</strong> the Whitmore width to the edge in the<br />
closest adjacent member, measured parallel to the line <strong>of</strong> action <strong>of</strong> the compressive<br />
axial force (see Figure 19).<br />
rs: radius <strong>of</strong> gyration about the plane <strong>of</strong> buckling, r s = I g / A (mm)<br />
g<br />
Ig : moment <strong>of</strong> inertia (mm 4 )<br />
Comparison <strong>of</strong> Analysis Results and Calculation Results<br />
Table 2 outlines the comparison <strong>of</strong> the experimental results, FE analysis results<br />
and the calculation results for the specimen. The ratio means the calculated or<br />
measured value to the analytical value. The calculated yield strength by the Whitmore<br />
effective width was to some extent close to the analytical ultimate strength with ratios<br />
<strong>of</strong> 0.97 (un-corroded model) and 0.95 (corroded model). On the other hand, the<br />
calculated yield strength <strong>of</strong> the diagonal was larger than the analytical value with ratios<br />
<strong>of</strong> 1.23 and 1.39. It is indicated that the gusset plate failure preceded with yielding <strong>of</strong><br />
the diagonal. Strength equation for local buckling gives conservative estimates with<br />
strength ratio <strong>of</strong> 0.59 (un-corroded model) and 0.36 (corroded model), much below 1.0.<br />
Regarding the compressive strength <strong>of</strong> the gusset plate connection, the results<br />
in this study were compared with experimental results[4]-[8]. Figure 21 shows<br />
comparison <strong>of</strong> the measured ultimate loads and the calculated values for local buckling<br />
and yielding respectively. Figure 22 shows relations <strong>of</strong> ultimate strength and<br />
slenderness ratio. Calculated values are also conservative for the experimental data,<br />
and the correlation is not good. Then, we are investigating more accurate estimation <strong>of</strong><br />
ultimate strength <strong>of</strong> the gusset plate. According to the failure mode, the ultimate<br />
strength is likely to depend on the buckling strength <strong>of</strong> the compressive unbraced area<br />
parts and the strength <strong>of</strong> its surrounding plate area. As one <strong>of</strong> our ideas, we are trying<br />
to evaluate the compressive strength by the summation <strong>of</strong> following strength equations<br />
<strong>of</strong> gusset plate divided into 3 areas as shown in Figure 23.<br />
P +<br />
gcr = Pgcr1<br />
+ Pgcr2<br />
Pgsy<br />
(5)
Pgcr1 is expressed by:<br />
P = ≦1.0) (6a)<br />
1<br />
=<br />
λ<br />
f y Ag<br />
(1.0
Conclusions<br />
<strong>Compressive</strong> loading test <strong>of</strong> the corroded gusset plate connection specimen<br />
from decommissioned truss bridge was performed, and the FE analyses were<br />
conducted to complement experimental results. As for compressive strength estimation<br />
<strong>of</strong> gusset plate connection, from practical viewpoint, application <strong>of</strong> strength equations<br />
were discussed with use <strong>of</strong> previous experimental research results. The major findings<br />
are summarized as follows.<br />
1) Based on thickness loss measurement <strong>of</strong> gusset plate connection, advanced<br />
corrosion <strong>of</strong> diagonals and gusset plate was observed around the connection<br />
parts. Severe corrosion part generally corresponded to the part where large<br />
stresses appear.<br />
2) The effect <strong>of</strong> the section loss on the compressive strength <strong>of</strong> the gusset plate was<br />
evaluated by experimental and analytical results. <strong>Compressive</strong> behavior <strong>of</strong> the<br />
gusset plate was properly evaluated by shell element model in consideration <strong>of</strong><br />
the average thickness reduction.<br />
3) Local buckling strengths by the Whitmore effective width provided conservative<br />
estimates to the experimental ultimate strength. Taking the buckling strength <strong>of</strong><br />
the compressive area and the strength <strong>of</strong> its surrounding plate area into<br />
consideration gave more proper prediction.<br />
Acknowledgment<br />
This research was undertaken as part <strong>of</strong> the collaborative research project<br />
between Public Works Research Institute; Tokyo Metropolitan University; and<br />
Waseda University, and funded by the Ministry <strong>of</strong> Land, Infrastructure, Transport and<br />
Tourism based on the Construction Technology Research and Development Subsidy<br />
Program. Finally, the authors express appreciation to Choshi Public Works Office,<br />
Chiba Prefecture for their cooperation.<br />
References<br />
[1] Japan Road Association (JRA), “Specification for Highway Bridges, Part II Steel<br />
Bridge”, 2002.(in Japanese)<br />
[2] Federal Highway Administration, “Load Rating Guidance and Examples For<br />
Bolted and Riveted <strong>Gusset</strong> <strong>Plate</strong>s In Truss Bridges”, Publication<br />
No.FHWA-IF-09-014, 2009.<br />
[3] Whitmore, R.E., “Experimental Investigation <strong>of</strong> Stresses in <strong>Gusset</strong> <strong>Plate</strong>s, Bulletin<br />
No.16, Engineering Experiment Station”, University <strong>of</strong> Tennessee,1952.<br />
[4] Yam, M. and Cheng, J., “Experimental Investigation <strong>of</strong> the <strong>Compressive</strong> Behavior<br />
<strong>of</strong> <strong>Gusset</strong> <strong>Plate</strong> <strong>Connection</strong>s”, Structural Engineering Report No.194, Dept. <strong>of</strong><br />
Civil Engineering, University <strong>of</strong> Alberta,1993.
[5] Ocel, J. M., Hartman, J.L., Zobel, R.,White, D. and Leon, R., “ Inspection and<br />
Rating <strong>of</strong> <strong>Gusset</strong> <strong>Plate</strong>s - A Response to the I-35W Bridge Collapse”, Proceedings<br />
<strong>of</strong> the 26th US-Japan Bridge Engineering Workshop, pp.11-23, 2010.<br />
[6] Matsuhisa, S., Yamamoto, K. and Okumura, T., “<strong>Loading</strong> Experiment <strong>of</strong> Truss<br />
<strong>Gusset</strong> <strong>Plate</strong> <strong>Connection</strong>s”, Proceedings <strong>of</strong> the 31st Annual Conference <strong>of</strong> Japan<br />
Society <strong>of</strong> Civil Engineers, pp.297-298, 1976. (in Japanese)<br />
[7] Matsuhisa, S., Yamamoto, K. and Okumura, T., “<strong>Loading</strong> Experiment <strong>of</strong> Truss<br />
<strong>Gusset</strong> <strong>Plate</strong> <strong>Connection</strong>s”, Proceedings <strong>of</strong> the 32nd Annual Conference <strong>of</strong> Japan<br />
Society <strong>of</strong> Civil Engineers, pp.631-632, 1978.(in Japanese)<br />
[8] Kasano, H., Yoda, T., Nogami, K., Murakoshi, J., Toyama, N., Sawada, M.,<br />
Arimura, K. and Guo, L., “Study on Failure modes <strong>of</strong> Steel Truss Bridge <strong>Gusset</strong><br />
<strong>Plate</strong>s Related to Compression and Shear Block Failure”, Proceedings <strong>of</strong> the 66th<br />
Annual Conference <strong>of</strong> Japan Society <strong>of</strong> Civil Engineers, pp.149-150, 2011. (in<br />
Japanese)
P12<br />
Figure 1 Old Bridge and New Bridge (cable-stayed bridge)<br />
5-span steel through truss bridge<br />
Before demolition<br />
P13 P14 P15 P16 P17<br />
Figure 2 General View <strong>of</strong> Choshi Bridge<br />
a) Lower chord connection b) Upper chord connection c) <strong>Plate</strong> bonding <strong>of</strong><br />
lower chord connection<br />
d) Diagonal joint e) Pitting <strong>of</strong> diagonal f) Section loss <strong>of</strong><br />
end floor beam<br />
Figure 3 Corrosion Damage <strong>of</strong> Main Members
P24d<br />
P25d<br />
D24<br />
(Tension)<br />
D25<br />
(Compression)<br />
P14<br />
350<br />
a)The test Specimen<br />
1,080<br />
1,050<br />
378×350×11×10<br />
b) The edge <strong>of</strong> flange c) Inside gusset plate connection<br />
Figure 4 P25d <strong>Connection</strong> Cut Out as Specimen<br />
Design load<br />
378<br />
625<br />
3,625<br />
1,500<br />
Table 1 Design Axial Force and Design Stress<br />
D24(Compression) D25(Tension)<br />
Axial force(kN) Stress(MPa) Axial force (kN) Stress(MPa)<br />
1,050<br />
378<br />
1,045<br />
360<br />
378×360×14×12<br />
Notes<br />
Dead load 1,027 69 -973 -52<br />
Live load 785 53 -742 -40 TL-20<br />
Total (Ratio) 1,812(-1.06) 112 -1,715(1.0) -92<br />
Allowable stress ― 128 ― -93 SM40<br />
Figure 5 Thickness Loss Measurement by Laser Measurement Epuipment<br />
a) Outside gusset plate b) Inside gusset plate<br />
Figure 6 Thickness Reduction <strong>of</strong> <strong>Corroded</strong> Specimen<br />
Depth<br />
(mm)
1915<br />
1557<br />
400<br />
18 18<br />
12 380 12<br />
404<br />
12<br />
378<br />
354<br />
12<br />
400<br />
14 14<br />
360<br />
2149<br />
360<br />
2000<br />
378<br />
10 358 10<br />
11 11<br />
350<br />
400<br />
350<br />
3280<br />
400<br />
10 380 10<br />
10 10<br />
400<br />
Figure 7 Outline <strong>of</strong> Specimen<br />
and <strong>Loading</strong> Frame<br />
Compression load<br />
Support for tension load<br />
Figure 9 Analysis Model<br />
Load (kN)<br />
6000<br />
5000<br />
4000<br />
3000<br />
2000<br />
1000<br />
Compression load<br />
0<br />
Tension load<br />
Specime<br />
n<br />
Setting frame<br />
Rigid element<br />
Tension load<br />
Specimen<br />
Setting frame<br />
3598kN<br />
4953kN<br />
30MN testing<br />
machine<br />
t=10→7mm<br />
Upper chord t=12→8mm<br />
t=22→16mm t=28→22mm<br />
t=11→9mm<br />
Figure 8 <strong>Test</strong> Setup <strong>of</strong> P25d<br />
<strong>Connection</strong><br />
Diagonal<br />
(Tension)<br />
3346kN<br />
Increase <strong>of</strong> out- <strong>of</strong>-plane disp.<br />
t=10→3mm<br />
Diagonal<br />
(Compression)<br />
t=12→9mm<br />
t=14→12mm<br />
Figure 10 <strong>Plate</strong> Thickness Reduction<br />
<strong>of</strong> <strong>Corroded</strong> Model<br />
Analytical value(Uncorroded)<br />
Analytical value(<strong>Corroded</strong>)<br />
Experimental value<br />
0 2 4 6 8 10<br />
Vertical displacement (mm)<br />
Setting frame<br />
Figure 11 Compression Load vs. Vertical Displacement Curves<br />
Specime<br />
n
Load (kN)<br />
Free edge<br />
<strong>of</strong> gusset<br />
4000<br />
3000<br />
2000<br />
1000<br />
0<br />
Sea side<br />
Experimental<br />
value(Road side)<br />
Experimental<br />
value(Sea side)<br />
Unbraced area<br />
<strong>of</strong> gusset<br />
Figure 12 Failed Specimen after the <strong>Test</strong><br />
Road side<br />
Bowing <strong>of</strong> free edge Buckling<br />
Peak load(3598kN)<br />
Position<br />
0 1 2 3 4 5 6 7 8<br />
Out-<strong>of</strong>-plane disp. <strong>of</strong> gtusset plate (mm)<br />
Load (kN)<br />
4000<br />
3000<br />
2000<br />
1000<br />
0<br />
Peak load(3598kN)<br />
Experimental<br />
value(Road side)<br />
Experimental<br />
value(Sea side)<br />
Peak load(3598kN)<br />
Position<br />
-4 -3 -2 -1 0 1 2 3 4<br />
Out-<strong>of</strong>-plane disp. <strong>of</strong> gusset plate (mm)<br />
a) Free edge <strong>of</strong> gusset b) Unbraced area <strong>of</strong> gusset<br />
Figure 13 Compression Load vs. Out-<strong>of</strong>-displacement <strong>of</strong> gusset plate Curves
<strong>Gusset</strong> buckling precede<br />
load to failure<br />
Compression load<br />
Tension load<br />
(3000kN)<br />
Local buckling <strong>of</strong><br />
diagonal flange<br />
Local buckling<br />
<strong>of</strong> gusset<br />
Figure 14 Von Mises Stress Contour <strong>of</strong> <strong>Corroded</strong> Model <strong>Gusset</strong> at Peak Load<br />
a<br />
b<br />
a<br />
a-a b-b<br />
a) Outside surface <strong>of</strong> gusset b) Outside surface <strong>of</strong> diagonal<br />
A<br />
Figure 15 Yield Strain Distribution <strong>of</strong> Outside Web at Peak Load<br />
B<br />
b<br />
A<br />
B
Load (kN)<br />
4000<br />
3500<br />
3000<br />
2500<br />
2000<br />
1500<br />
1000<br />
500<br />
0<br />
Distance from upper chord<br />
boundary(mm)<br />
Experimental<br />
value(Road side)<br />
Experimental<br />
value(Sea side)<br />
Analytical<br />
value(Road side)<br />
Analytical<br />
value(Sea side)<br />
200<br />
150<br />
100<br />
50<br />
Sea side<br />
0<br />
●Measured<br />
-4 -2 0 2 4<br />
Out-<strong>of</strong>-plane disp.(mm)<br />
Peak load(3598kN)<br />
Position<br />
-10 -8 -6 -4 -2 0 2 4 6 8 10<br />
Out-<strong>of</strong>-plane disp. <strong>of</strong> gusset plate (mm)<br />
First row rivet line<br />
Diagonal boundary<br />
Upper chord boundary<br />
Load (kN)<br />
4000<br />
3500<br />
3000<br />
2500<br />
2000<br />
1500<br />
1000<br />
200<br />
150<br />
100<br />
50<br />
0<br />
Road side<br />
-4 -2 0 2 4<br />
Out-<strong>of</strong>-plane disp. (mm)<br />
Figure 17 Deflected Mode <strong>of</strong> Unbraced Area<br />
500<br />
0<br />
Peak load(3598kN)<br />
Experimental<br />
value(Road side)<br />
Experimental<br />
value(Sea side)<br />
Analytical<br />
value(Road side)<br />
Analytical<br />
value(Sea side)<br />
Position<br />
-10 -8 -6 -4 -2 0 2 4 6 8 10<br />
Out-<strong>of</strong>-plane disp. <strong>of</strong> diagonal (mm)<br />
a) Unbraced area <strong>of</strong> gusset b) Free edge <strong>of</strong> diagonal<br />
Figure 16 Load vs. Out-<strong>of</strong>-plane Displacement Curves<br />
<strong>Gusset</strong><br />
First row<br />
rivet<br />
Diagonal<br />
Upper<br />
chord
Calculated<br />
Value<br />
b) Cross section yielding or net section<br />
fracture resistance <strong>of</strong> gusset plate<br />
c) Block shear rupture<br />
strength in tension<br />
L3<br />
Whitmore<br />
width<br />
Tension<br />
diagonal<br />
30°<br />
L2<br />
Compression<br />
diagonal<br />
Upper Chord<br />
f) Shear fracture strength<br />
e) <strong>Compressive</strong> strength<br />
d) Cross section yielding or net section<br />
fracture strength <strong>of</strong> diagonal member<br />
a) Strength <strong>of</strong> fasteners in<br />
compression and tension<br />
Figure 18 Limit State <strong>of</strong> <strong>Gusset</strong> <strong>Plate</strong> <strong>Connection</strong><br />
L1<br />
30°<br />
Section<br />
Compression<br />
diagonal<br />
a)Yielding or local buckling b) Yielding <strong>of</strong> diagonal<br />
<strong>of</strong> gusset plate<br />
Figure 19 Strength Equations for Compression<br />
d)<br />
Compression<br />
diagonal<br />
Figure 20<br />
Effective length<br />
Factor (β=1.2)<br />
Table 2 The Comparison <strong>of</strong> the Ultimate Strength<br />
<strong>Compressive</strong> ultimate strength Uncorroded model <strong>Corroded</strong> model<br />
Analysis Value (Ultimate Load) kN (ratio) 4,953 (1.00) 3,346 (1.00)<br />
b) Cross section yielding <strong>of</strong> gusset plate kN (ratio) 4,792 (0.97) 3,194 (0.95)<br />
d) Cross section yielding <strong>of</strong> diagonal member kN (ratio) 6,087 (1.23) 4,666 (1.39)<br />
e) <strong>Compressive</strong> strength kN (ratio) 2,948 (0.59) 1,220 (0.36)<br />
Experimental Value (Ultimate Load) kN (ratio) ― 3,598 (1.08)
Calculated strength (kN)<br />
6000<br />
5000<br />
4000<br />
3000<br />
2000<br />
1000<br />
0<br />
Yam,M. at al.(1993)-GP<br />
Yam,M. at al.(1993)-SP<br />
Yam,M. at al.(1993)-AP<br />
Ocel,J.M. at al.(2010)<br />
Okumura,T. et al.(1978)-No.1-4<br />
Okumura,T. et al.(1978)-No.5<br />
Kasano,H. et al.(2011)-analysis result<br />
P25d test result<br />
P25d analysis result(Uncorroded)<br />
P25d analysis result(<strong>Corroded</strong>)<br />
0 1000 2000 3000 4000 5000 6000<br />
Experimental strength (kN)<br />
a) Yielding b) Local buckling<br />
Figure 21 Comparison <strong>of</strong> the Experimental Ultimate Strength<br />
and the Calculated Strength<br />
Local buckling , ultimate strength /Yielding strength<br />
3.0<br />
2.5<br />
2.0<br />
1.5<br />
1.0<br />
0.5<br />
0.0<br />
Yam,M. at al.(1993)-GP<br />
Yam,M. at al.(1993)-SP<br />
Yam,M. at al.(1993)-AP<br />
Ocel,J.M. at al.(2010)<br />
Okumura,T. et al.(1978)-No.1-4<br />
Okumura,T. et al.(1978)-No.5<br />
Kasano,H. et al.(2011)-analysis result<br />
P25d test result<br />
P25d analysis result(Uncorroded)<br />
P25d analysis result(<strong>Corroded</strong>)<br />
Standard buckling strength (JSHB)<br />
Euler buckling curve<br />
0.0 0.5 1.0 1.5 2.0 2.5 3.0<br />
Slenderness ratio<br />
Figure 22 Relations <strong>of</strong> Strength and Slenderness Ratio
L3 L2 L1<br />
Pgcr1<br />
h3<br />
Pgsy<br />
θ2<br />
b1<br />
θ2<br />
θ1<br />
b2<br />
Compression<br />
diagonal<br />
Pgcr2<br />
h1<br />
h2<br />
θ1<br />
Figure 23 Model for Estimating Compression Ultimate Strength <strong>of</strong> <strong>Gusset</strong> <strong>Plate</strong><br />
Calculated strength (kN)<br />
6000<br />
5000<br />
4000<br />
3000<br />
2000<br />
1000<br />
0<br />
h3<br />
Yam,M. at al.(1993)-GP<br />
Yam,M. at al.(1993)-SP<br />
Yam,M. at al.(1993)-AP<br />
Ocel,J.M. at al.(2010)<br />
Okumura,T. et al.(1978)-No.1-4<br />
Okumura,T. et al.(1978)-No.5<br />
Kasano,H. et al.(2011)-analysis result<br />
P25d test result<br />
P25d analysis result(Uncorroded)<br />
P25d analysis result(<strong>Corroded</strong>)<br />
3<br />
a) Shear<br />
yielding:<br />
Pgsy<br />
f y<br />
hc<br />
βLc<br />
0 1000 2000 3000 4000 5000 6000<br />
Experimental strength (kN)<br />
Figure 24 Comparison <strong>of</strong> the Experimental Strength and the Calculated Strength<br />
b1<br />
b) Local buckling at<br />
unbraced area<br />
underneath diagonals<br />
(β=0.65): Pgcr1<br />
F.S.<br />
F.S. Free<br />
F.S.<br />
b2<br />
F.S. : Fixed support<br />
c) Local<br />
buckling <strong>of</strong><br />
free edge area:<br />
Pgcr2<br />
Note : θ1 is angle between diagonal axis and line b2.<br />
θ2 is angle between diagonal axis and line h3.