Intrinsic Wavelength Standard Absorption Bands in Holmium Oxide ...
Intrinsic Wavelength Standard Absorption Bands in Holmium Oxide ...
Intrinsic Wavelength Standard Absorption Bands in Holmium Oxide ...

You also want an ePaper? Increase the reach of your titles
YUMPU automatically turns print PDFs into web optimized ePapers that Google loves.
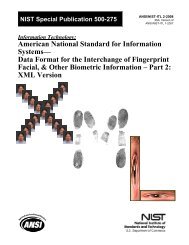
FIG. 4. Summary of temperature dependence data at an SSW of 1.0 nm.<br />
Each data po<strong>in</strong>t represents the average of four shifts of the position of a<br />
s<strong>in</strong>gle band from the position determ<strong>in</strong>ed at 25 °C to the position at 30, 35,<br />
40, and 45 °C. The bar represents the range of these four temperature shifts.<br />
The solid symbols represent bands certified <strong>in</strong> SRM 2034 and the open<br />
symbols represent additional bands reported here.<br />
3.4. Band Shape and Location Uncerta<strong>in</strong>ty<br />
The two greatest residuals <strong>in</strong> Fig. 2, for features d and u at<br />
the 3 nm SSW, are not outliers but are illustrative of some of<br />
the larger prediction <strong>in</strong>tervals of Table 3. Comparison of the<br />
band positions found by participant peak location algorithms<br />
with those found by the NIST/CSTL algorithm confirms the<br />
previous f<strong>in</strong>d<strong>in</strong>g 9 that the algorithm is not responsible for the<br />
relatively large dispersion of results for particular bands.<br />
Rather, the fault lies <strong>in</strong> the shape and structure of these bands<br />
and on the possibility that false local m<strong>in</strong>ima may result<br />
from noise superimposed on relatively flat-tipped bands, as<br />
may be <strong>in</strong>ferred from Fig. 3 of Ref. 9.<br />
3.5. Effect of Temperature<br />
The results of the temperature study at an SBW of 1.0 nm<br />
and over the temperature range of 25– 45 °C are summarized<br />
<strong>in</strong> Fig. 4. At each wavelength, the data po<strong>in</strong>t is the average<br />
departure of the band location at the four other temperatures<br />
30, 35, 40, and 45 °C from the band location at 25 °C. The<br />
bars <strong>in</strong>dicate the maximum and m<strong>in</strong>imum deviations from<br />
the 25 °C band location. The dispersion implied by these<br />
bars is generally not dist<strong>in</strong>guishable from the reproducibility<br />
of locat<strong>in</strong>g the bands for replicate measurements at the same<br />
temperature on a s<strong>in</strong>gle <strong>in</strong>strument. The few maximum or<br />
m<strong>in</strong>imum excursions exceed<strong>in</strong>g 0.05 nm <strong>in</strong> magnitude are<br />
found to represent apparent wavelength shifts result<strong>in</strong>g from<br />
temperature-dependent amplitudes of adjacent features. For<br />
this reason it is prudent to restrict the temperature range for<br />
normal use to 255 °C as orig<strong>in</strong>ally recommended by<br />
Weidner et al. 1,2 for SRM 2034.<br />
HOLMIUM OXIDE SOLUTION<br />
3.6. Variation Across Solution Preparations<br />
Example spectra from one sample of SRM 2034 prepared<br />
<strong>in</strong> each of the 12 batches prepared at NIST revealed m<strong>in</strong>or<br />
differences <strong>in</strong> the basel<strong>in</strong>e and absorption amplitude. Basel<strong>in</strong>e<br />
effects have been attributed to the purity of the holmium<br />
oxide powder, 1 to organic impurities <strong>in</strong> the acid or water<br />
used, or to cuvette-specific effects result<strong>in</strong>g from local contam<strong>in</strong>ation<br />
and/or differences <strong>in</strong> cuvette w<strong>in</strong>dows. Amplitude<br />
differences result from m<strong>in</strong>or concentration variations. Shifts<br />
<strong>in</strong> the apparent positions of the shortest-wavelength certified<br />
bands caused by basel<strong>in</strong>e effects are trivial with respect to<br />
the uncerta<strong>in</strong>ties given <strong>in</strong> Table 3. The prior batches of SRM<br />
2034 were prepared by the same <strong>in</strong>dividual us<strong>in</strong>g the same<br />
stock of holmium oxide powder, but with several variations<br />
of acid, water, and cuvette manufacturer.<br />
Two of the holmium oxide preparations shown <strong>in</strong> Table 2<br />
gave experimental evidence of be<strong>in</strong>g prepared at mass concentrations<br />
other than 40 g/L, and one yielded a significant<br />
basel<strong>in</strong>e effect <strong>in</strong> the UV portion of the spectrum. In spite of<br />
these differences, band positions obta<strong>in</strong>ed from spectra of all<br />
of these samples are well with<strong>in</strong> the stated uncerta<strong>in</strong>ties of<br />
those reported here for NIST SRM 2034 Series 02. However,<br />
a dist<strong>in</strong>guishable mass concentration effect for certa<strong>in</strong><br />
bands led to the study reported below.<br />
3.7. Effect of Concentration<br />
Figure 5 illustrates a slight concentration dependence <strong>in</strong><br />
the spectral position of the m<strong>in</strong>imum of Band 1. In the lower<br />
plot, data for 10, 20, and 60 g/L concentrations at 1 nm SSW<br />
have been normalized <strong>in</strong> absorbance space to overlay with<br />
the 40 g/L data to visualize the effect. The absolute wavelength<br />
excursion across this concentration range for <strong>Bands</strong> 1<br />
and 4 is 0.05 nm. The m<strong>in</strong>ima for <strong>Bands</strong> 9, 13, and 14 also<br />
systematically shift with concentration but by less than 0.03<br />
nm. This f<strong>in</strong>d<strong>in</strong>g contradicts the orig<strong>in</strong>al reports 1,2 and supports<br />
adherence to the nom<strong>in</strong>al 40 g/L solution for the <strong>in</strong>tr<strong>in</strong>sic<br />
standard.<br />
3.8. <strong>Intr<strong>in</strong>sic</strong> Spectrum<br />
49<br />
The <strong>in</strong>tr<strong>in</strong>sic spectrum is proposed here as a means of<br />
verify<strong>in</strong>g that a preparation of holmium oxide solution is<br />
qualified to convey traceability through the certified band<br />
positions of Table 3.<br />
The spectrum presented <strong>in</strong> Fig. 1 is wavelength calibrated<br />
to the consensus scale with<strong>in</strong> 0.1 nm for all of the bands<br />
given <strong>in</strong> Table 3. The spectrum will be made available electronically<br />
through the NIST web site 28 for overlay with experimental<br />
spectra of candidate materials acquired with 0.1<br />
nm SBWs and 0.1 nm data spac<strong>in</strong>g. While the wavelength<br />
axes of these overlaid spectra may not co<strong>in</strong>cide exactly, visual<br />
observation should verify that no additional features are<br />
present contam<strong>in</strong>ation and that the known features of holmium<br />
oxide solution are present <strong>in</strong> the desired proportions.<br />
Variation <strong>in</strong> the basel<strong>in</strong>e from about 230 to 275 nm results<br />
from differences <strong>in</strong> cuvettes or contam<strong>in</strong>ation <strong>in</strong> the cuvette<br />
J. Phys. Chem. Ref. Data, Vol. 34, No. 1, 2005