4. description of the environment - Gujarat Pollution Control Board
4. description of the environment - Gujarat Pollution Control Board
4. description of the environment - Gujarat Pollution Control Board

You also want an ePaper? Increase the reach of your titles
YUMPU automatically turns print PDFs into web optimized ePapers that Google loves.
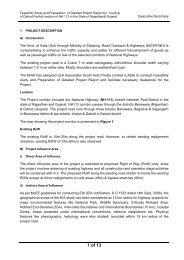
Final Feasibility Report<br />
Preparation <strong>of</strong> Feasibility– cum-Preliminary Design for 4/6 Laning<br />
<strong>of</strong> Jetpur-Somnath section <strong>of</strong> NH 8D, Package No:<br />
NHAI/DBFOII/DPR/02<br />
VOLUME III:<br />
ENVIRONMENTAL IMPACT ASSESSMENT<br />
Table 4-6: Mean Wind Speed (Kmph)<br />
Station<br />
Jan Feb Mar Apr May<br />
Months<br />
Jun July Aug Sept Oct Nov Dec<br />
Keshod 11.54 11.42 13.35 12.6 17.03 - - - - - - -<br />
Veraval 12.16 13.49 15.15 1<strong>4.</strong>5 15.2 20.3 25.15 19.64 10.8 11.68 9.9 13.795<br />
Based on IMD Observation from 2007<br />
CLIMATIC CONDITIONS<br />
RAINFALL<br />
(in mm)<br />
Above 600<br />
500 - 600<br />
Below 500<br />
Sea<br />
Project Corridor<br />
Mean Maximum temperature Summer<br />
Mean Minimum temperature Winter<br />
Taluka Boundry<br />
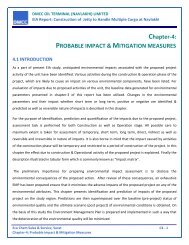
<strong>4.</strong><strong>4.</strong>2 Air Quality<br />
Porbandar<br />
Buffer Zone (Upto 15 km from corridor)<br />
5 0 5 10 15<br />
Kilometre<br />
Ranavav<br />
40 C<br />
O<br />
Arabian Sea<br />
Upleta<br />
Manavadar Vanthli<br />
Mangrol<br />
40 C<br />
O<br />
Jam Kandorna<br />
Dhoraji<br />
10 C<br />
chorwad<br />
O<br />
Somnath<br />
12.5 C<br />
Malia<br />
Miyana<br />
O<br />
40 C<br />
Padadhari Rajkot<br />
Junagarh<br />
Maliya<br />
Figure 4-5: Climate <strong>of</strong> <strong>the</strong> Project Area<br />
Jetpur<br />
O<br />
Wankaner<br />
Lodhika<br />
Kotda Sangani<br />
The air polluting sources in <strong>the</strong> project region primarily consist <strong>of</strong> industries and <strong>the</strong> vehicles<br />
plying on <strong>the</strong> roads. A total <strong>of</strong> ten (10) ambient air monitoring stations were identified based on<br />
<strong>the</strong> different existing land use pattern to study <strong>the</strong> ambient air quality along <strong>the</strong> project corridor.<br />
The ambient air quality in <strong>the</strong> corridor was found to be in compliance with <strong>the</strong> ambient air quality<br />
norms stipulated by CPCB/GPCB. The ambient air quality monitoring stations have been<br />
depicted in Figure 4-6.<br />
Talala<br />
Morbi<br />
Gondal<br />
Una<br />
Jasdan<br />
4-9