4. description of the environment - Gujarat Pollution Control Board
4. description of the environment - Gujarat Pollution Control Board 4. description of the environment - Gujarat Pollution Control Board
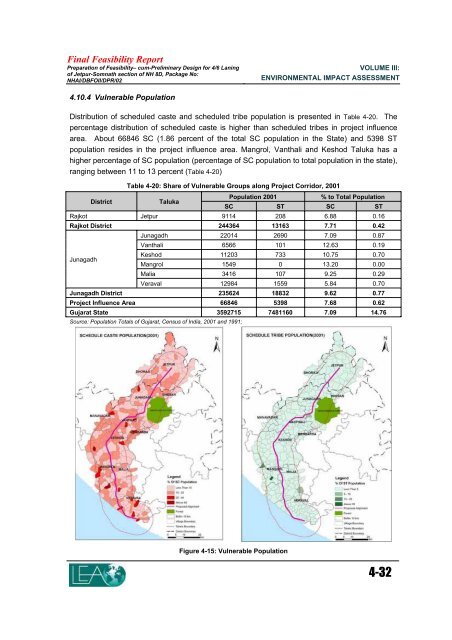
Final Feasibility Report Preparation of Feasibility– cum-Preliminary Design for 4/6 Laning of Jetpur-Somnath section of NH 8D, Package No: NHAI/DBFOII/DPR/02 4.10.4 Vulnerable Population VOLUME III: ENVIRONMENTAL IMPACT ASSESSMENT Distribution of scheduled caste and scheduled tribe population is presented in Table 4-20. The percentage distribution of scheduled caste is higher than scheduled tribes in project influence area. About 66846 SC (1.86 percent of the total SC population in the State) and 5398 ST population resides in the project influence area. Mangrol, Vanthali and Keshod Taluka has a higher percentage of SC population (percentage of SC population to total population in the state), ranging between 11 to 13 percent (Table 4-20) Table 4-20: Share of Vulnerable Groups along Project Corridor, 2001 District Taluka Population 2001 SC ST % to Total Population SC ST Rajkot Jetpur 9114 208 6.88 0.16 Rajkot District 244364 13163 7.71 0.42 Junagadh Junagadh 22014 2690 7.09 0.87 Vanthali 6566 101 12.63 0.19 Keshod 11203 733 10.75 0.70 Mangrol 1549 0 13.20 0.00 Malia 3416 107 9.25 0.29 Veraval 12984 1559 5.84 0.70 Junagadh District 235624 18832 9.62 0.77 Project Influence Area 66846 5398 7.68 0.62 Gujarat State 3592715 7481160 7.09 14.76 Source: Population Totals of Gujarat, Census of India, 2001 and 1991; Figure 4-15: Vulnerable Population 4-32
Final Feasibility Report Preparation of Feasibility– cum-Preliminary Design for 4/6 Laning of Jetpur-Somnath section of NH 8D, Package No: NHAI/DBFOII/DPR/02 4.10.5 Literacy Rate VOLUME III: ENVIRONMENTAL IMPACT ASSESSMENT As per the Census estimates (2001), 69 percent of the population are literate in the State, where as the average literate rate is lower (67 percent) in the project influence area. Within the project influence area, Junagadh taluka has the highest literacy rate (73 percent) followed by Jetpur (70 percent) and Keshod (68 percent). The lowest literacy rate was observed in Malia (55 percent) and Veraval (59 percent) (Table 4-21). Table 4-21: Literacy Rate along Project Corridor, 2001 District Taluka Literates 1991 2001 Literacy Rate (%) 1991 2001 Rajkot Jetpur 74341 92772 61 70 Rajkot district 1419681 2033946 56 74 Junagadh Junagadh 133075 225781 66 73 Vanthali 23501 32498 56 63 Keshod 55200 70421 61 68 Mangrol 5359 7180 55 61 Malia 13758 20292 45 55 Veraval 69441 130359 49 59 Junagadh District 1217725 1408878 51 68 Project Influence Area 374675 579303 59 67 Gujarat State 21131400 29827750 51 69 Source: Census of India, 2001 4-33
- Page 1 and 2: 4. DESCRIPTION OF THE ENVIRONMENT T
- Page 3 and 4: Final Feasibility Report Preparatio
- Page 5 and 6: Final Feasibility Report Preparatio
- Page 7 and 8: Final Feasibility Report Preparatio
- Page 9 and 10: Final Feasibility Report Preparatio
- Page 11 and 12: Final Feasibility Report Preparatio
- Page 13 and 14: Final Feasibility Report Preparatio
- Page 15 and 16: Final Feasibility Report Preparatio
- Page 17 and 18: Final Feasibility Report Preparatio
- Page 19 and 20: Final Feasibility Report Preparatio
- Page 21 and 22: Final Feasibility Report Preparatio
- Page 23 and 24: Final Feasibility Report Preparatio
- Page 25 and 26: Final Feasibility Report Preparatio
- Page 27 and 28: Final Feasibility Report Preparatio
- Page 29 and 30: Final Feasibility Report Preparatio
- Page 31: Final Feasibility Report Preparatio
- Page 35 and 36: Final Feasibility Report Preparatio
- Page 37 and 38: Final Feasibility Report Preparatio
- Page 39 and 40: 5. PUBLIC CONSULTATION Public consu
- Page 41 and 42: Final Feasibility Report Preparatio
- Page 43 and 44: Final Feasibility Report Preparatio
- Page 45 and 46: Final Feasibility Report Preparatio
- Page 47 and 48: Final Feasibility Report Preparatio
- Page 49 and 50: Final Feasibility Report Preparatio
Final Feasibility Report<br />
Preparation <strong>of</strong> Feasibility– cum-Preliminary Design for 4/6 Laning<br />
<strong>of</strong> Jetpur-Somnath section <strong>of</strong> NH 8D, Package No:<br />
NHAI/DBFOII/DPR/02<br />
<strong>4.</strong>10.4 Vulnerable Population<br />
VOLUME III:<br />
ENVIRONMENTAL IMPACT ASSESSMENT<br />
Distribution <strong>of</strong> scheduled caste and scheduled tribe population is presented in Table 4-20. The<br />
percentage distribution <strong>of</strong> scheduled caste is higher than scheduled tribes in project influence<br />
area. About 66846 SC (1.86 percent <strong>of</strong> <strong>the</strong> total SC population in <strong>the</strong> State) and 5398 ST<br />
population resides in <strong>the</strong> project influence area. Mangrol, Vanthali and Keshod Taluka has a<br />
higher percentage <strong>of</strong> SC population (percentage <strong>of</strong> SC population to total population in <strong>the</strong> state),<br />
ranging between 11 to 13 percent (Table 4-20)<br />
Table 4-20: Share <strong>of</strong> Vulnerable Groups along Project Corridor, 2001<br />
District Taluka<br />
Population 2001<br />
SC ST<br />
% to Total Population<br />
SC ST<br />
Rajkot Jetpur 9114 208 6.88 0.16<br />
Rajkot District 244364 13163 7.71 0.42<br />
Junagadh<br />
Junagadh 22014 2690 7.09 0.87<br />
Vanthali 6566 101 12.63 0.19<br />
Keshod 11203 733 10.75 0.70<br />
Mangrol 1549 0 13.20 0.00<br />
Malia 3416 107 9.25 0.29<br />
Veraval 12984 1559 5.84 0.70<br />
Junagadh District 235624 18832 9.62 0.77<br />
Project Influence Area 66846 5398 7.68 0.62<br />
<strong>Gujarat</strong> State 3592715 7481160 7.09 1<strong>4.</strong>76<br />
Source: Population Totals <strong>of</strong> <strong>Gujarat</strong>, Census <strong>of</strong> India, 2001 and 1991;<br />
Figure 4-15: Vulnerable Population<br />
4-32


