Brno 2007 + Košice 2008 - TUKE
Brno 2007 + Košice 2008 - TUKE Brno 2007 + Košice 2008 - TUKE
Preface This special issue contains contributions from already 4 th (2007) and 5 th (2008) years of the seminar Local Mechanical Properties (Lokálne Mechanické Vlastnosti, LMV). Its tradition was established in 2004 when it was organized as Slovak-Czech seminar. At these days, the seminar developed into a regular international conference covering a wide range of nano/ micromechanics and other local phenomena and attracting researchers from wide geographical regions. The knowledge of local mechanical properties is a prerequisite for the proper knowledge of other local phenomena and natural relations of small scale objects. Through this knowledge one is able to model and predict global macroscopic properties of the bulk material or a structure. Availability of the measurements comes with the development of experimental techniques, computers, software and most importantly with the development of nanosciences. An important role between the experimental techniques is played by nanoindentation. This technique has encountered tremendous evolution and its abilities are still expanding. The LMV seminar was found in 2004 as one of the results of the Slovak-Czech bilateral project proceeded in the frame of intergovernmental scientific collaboration and conducted by the Department of Materials Science, Faculty of Metallurgy, Technical University of Ko ice (L. Pe ek) and the Department of Material Science and Technology, Faculty of Mechanical Engineering, University of West Bohemia in Plze (O. Bláhová). The project coordinators aimed to establish a platform for research presentations from the area which underwent a large expansion. And such a platform was missing at these days. In 2004, the 1 st Slovak Czech seminar Lokálne mechanické vlastnosti LMV´04 was held in Ko ice (December 1-2, 2004) themed Instrumented indentation and its application . It was attended by 22 participants from Slovak and Czech Republic, 16 papers were presented. In 2005, the 2 nd year of LMV 05 was held in Her any near Ko ice (November 14-15, 2005), themed Relation of instrumented indentation with other hardness tests and properties . It was attended by 25 attendees from Slovak and Czech Republic, 12 papers were presented. Both first two years were organized by L. Pe ek and Department of Materials Science, Faculty of Metallurgy, Technical University of Ko ice. In 2006, the 3 rd year LMV´06 themed Applicability of indentation measurements was held in Ne tiny near Plze (November 8-10, 2006). It was attended by 40 participants from Czech and Slovak Republic, 30 papers were presented. The main organizer became O. Bláhová and the Department of Material Science and Technology, Faculty of Mechanical Engineering, University of West Bohemia in Plze . Proceedings of the 1 st to 3 rd years were published on CD-ROM and/or printed (ISBN 80-8073-235-3, ISBN 80-8073-405-4, ISBN 80-7043-512-7). Contributions covered problems of indentation measurements, experimental techniques, instruments, possibilities of measurements, evaluation of results, layered materials, substrates, bulk materials and thin films. Always, the seminar was complemented with an excursion and exhibition of experimental instruments. In 2006, the scope of the seminar was enlarged with themes covering non-contact local deformation imaging techniques and small punch test. In 2007, the 4 th LMV´07 was held in Brno- lapanice (November 7- 9, 2007) organized by Masaryk University in Brno. It was attended by 40 attendees, 28 papers were presented. Excursion to the laboratories of Institute of Physical Electronics took place. The seminar was organized by V. Bur íková and her team from Institute of Physical Electronics, Faculty of Science, Masaryk University Brno. Proceedings of the LMV´07 were published also on CD-ROM under ISBN 978-80-210-4688-7. In 2008, the 5 th LMV 08 was held in Her any near Ko ice (November 3-5, 2008), organized by Department of Materials Science, Faculty of Metallurgy, Technical University of Ko ice. It was attended by 22 participants from Czech and Slovak Republic and Poland, 21 papers were presented. The topics of last two seminars were similarly to previous years focused on experimental techniques, instrumentation, evaluation of results on layers, thin films, particles and it covered materials like metals, alloyed systems, polymers. New areas as multi-scale modeling, models based on neural networks, properties of composite polymers, CNTs, DLCs, construction materials like cement and concrete and wood were touched. Problems solved by presented contributions were viewed from different perspectives (physical, chemical, engineering, technological). It was decided to focus preferably on small-scale mechanical properties in the next years with the clear connection either to microstructure or to the macro-scale. All information on the seminar (also for the next years) can be tracked on http://www.tuke.sk/lmp . The 2007 and 2008 are the first years of the seminar for which the reviewed full-length papers are published within the special issue of Chemické listy journal. Ladislav Pe ek Scientific guarantor and co-chairman of the LMV 2007 and 2008 seminars s93 Department of Materials Science Faculty of Metallurgy Technical University of Ko ice
- Page 2 and 3: Editors prof. Ing. Ladislav Pe ek,
- Page 4 and 5: R. Bidulský, M. A. Grande, M. Kab
- Page 6 and 7: Chem. Listy 105, s98 s101 (2011) LM
- Page 8 and 9: Chem. Listy 105, s98 s101 (2011) LM
- Page 10 and 11: Chem. Listy 105, s102 s104 (2011) L
- Page 12 and 13: Chem. Listy 105, s102 s104 (2011) L
- Page 14 and 15: Chem. Listy 105, s105 s108 (2011) L
- Page 16 and 17: Chem. Listy 105, s105 s108 (2011) L
- Page 18 and 19: Chem. Listy 105, s109 s111 (2011) L
- Page 20 and 21: Chem. Listy 105, s112 s114 (2011) L
- Page 22 and 23: Chem. Listy 105, s112 s114 (2011) L
- Page 24 and 25: Chem. Listy 105, s115 s119 (2011) L
- Page 26 and 27: Chem. Listy 105, s115 s119 (2011) L
- Page 28 and 29: Chem. Listy 105, s120 s122 (2011) L
- Page 30 and 31: Chem. Listy 105, s120 s122 (2011) L
- Page 32 and 33: Chem. Listy 105, s123 s124 (2011) L
- Page 34 and 35: Chem. Listy 105, s125 s128 (2011) L
- Page 36 and 37: Chem. Listy 105, s125 s128 (2011) L
- Page 38 and 39: Chem. Listy 105, s129 s131 (2011) L
- Page 40 and 41: Chem. Listy 105, s136 s138 (2011) L
- Page 42 and 43: Chem. Listy 105, s136 s138 (2011) L
- Page 44 and 45: Chem. Listy 105, s140 s142 (2011) L
- Page 46 and 47: Chem. Listy 105, s140 s142 (2011) L
- Page 48 and 49: Chem. Listy 105, s143 s145 (2011) L
- Page 50 and 51: Chem. Listy 105, s146 s149 (2011) L
Preface<br />
This special issue contains contributions from already 4 th (<strong>2007</strong>) and 5 th (<strong>2008</strong>) years of the seminar Local Mechanical<br />
Properties (Lokálne Mechanické Vlastnosti, LMV). Its tradition was established in 2004 when it was organized as Slovak-Czech<br />
seminar. At these days, the seminar developed into a regular international conference covering a wide range of nano/<br />
micromechanics and other local phenomena and attracting researchers from wide geographical regions.<br />
The knowledge of local mechanical properties is a prerequisite for the proper knowledge of other local phenomena and<br />
natural relations of small scale objects. Through this knowledge one is able to model and predict global macroscopic properties<br />
of the bulk material or a structure. Availability of the measurements comes with the development of experimental techniques,<br />
computers, software and most importantly with the development of nanosciences. An important role between the experimental<br />
techniques is played by nanoindentation. This technique has encountered tremendous evolution and its abilities are still expanding.<br />
The LMV seminar was found in 2004 as one of the results of the Slovak-Czech bilateral project proceeded in the frame of<br />
intergovernmental scientific collaboration and conducted by the Department of Materials Science, Faculty of Metallurgy, Technical<br />
University of Ko ice (L. Pe ek) and the Department of Material Science and Technology, Faculty of Mechanical Engineering,<br />
University of West Bohemia in Plze (O. Bláhová). The project coordinators aimed to establish a platform for research presentations<br />
from the area which underwent a large expansion. And such a platform was missing at these days.<br />
In 2004, the 1 st Slovak Czech seminar Lokálne mechanické vlastnosti LMV´04 was held in Ko ice (December 1-2, 2004)<br />
themed Instrumented indentation and its application . It was attended by 22 participants from Slovak and Czech Republic,<br />
16 papers were presented.<br />
In 2005, the 2 nd year of LMV 05 was held in Her any near Ko ice (November 14-15, 2005), themed Relation of instrumented<br />
indentation with other hardness tests and properties . It was attended by 25 attendees from Slovak and Czech Republic,<br />
12 papers were presented. Both first two years were organized by L. Pe ek and Department of Materials Science, Faculty of Metallurgy,<br />
Technical University of Ko ice.<br />
In 2006, the 3 rd year LMV´06 themed Applicability of indentation measurements was held in Ne tiny near Plze<br />
(November 8-10, 2006). It was attended by 40 participants from Czech and Slovak Republic, 30 papers were presented. The main<br />
organizer became O. Bláhová and the Department of Material Science and Technology, Faculty of Mechanical Engineering, University<br />
of West Bohemia in Plze .<br />
Proceedings of the 1 st to 3 rd years were published on CD-ROM and/or printed (ISBN 80-8073-235-3, ISBN 80-8073-405-4,<br />
ISBN 80-7043-512-7). Contributions covered problems of indentation measurements, experimental techniques, instruments, possibilities<br />
of measurements, evaluation of results, layered materials, substrates, bulk materials and thin films. Always, the seminar<br />
was complemented with an excursion and exhibition of experimental instruments. In 2006, the scope of the seminar was enlarged<br />
with themes covering non-contact local deformation imaging techniques and small punch test.<br />
In <strong>2007</strong>, the 4 th LMV´07 was held in <strong>Brno</strong>- lapanice (November 7- 9, <strong>2007</strong>) organized by Masaryk University in <strong>Brno</strong>. It was<br />
attended by 40 attendees, 28 papers were presented. Excursion to the laboratories of Institute of Physical Electronics took place.<br />
The seminar was organized by V. Bur íková and her team from Institute of Physical Electronics, Faculty of Science, Masaryk<br />
University <strong>Brno</strong>. Proceedings of the LMV´07 were published also on CD-ROM under ISBN 978-80-210-4688-7.<br />
In <strong>2008</strong>, the 5 th LMV 08 was held in Her any near Ko ice (November 3-5, <strong>2008</strong>), organized by Department of Materials<br />
Science, Faculty of Metallurgy, Technical University of Ko ice. It was attended by 22 participants from Czech and Slovak Republic<br />
and Poland, 21 papers were presented. The topics of last two seminars were similarly to previous years focused on experimental<br />
techniques, instrumentation, evaluation of results on layers, thin films, particles and it covered materials like metals, alloyed<br />
systems, polymers. New areas as multi-scale modeling, models based on neural networks, properties of composite polymers,<br />
CNTs, DLCs, construction materials like cement and concrete and wood were touched. Problems solved by presented contributions<br />
were viewed from different perspectives (physical, chemical, engineering, technological). It was decided to focus preferably<br />
on small-scale mechanical properties in the next years with the clear connection either to microstructure or to the macro-scale.<br />
All information on the seminar (also for the next years) can be tracked on http://www.tuke.sk/lmp . The <strong>2007</strong> and <strong>2008</strong> are<br />
the first years of the seminar for which the reviewed full-length papers are published within the special issue of Chemické listy<br />
journal.<br />
Ladislav Pe ek<br />
Scientific guarantor and co-chairman of the LMV <strong>2007</strong> and <strong>2008</strong> seminars<br />
s93<br />
Department of Materials Science<br />
Faculty of Metallurgy<br />
Technical University of Ko ice
Editors<br />
prof. Ing. Ladislav Pe ek, CSc. (TU Ko ice) edited <strong>2007</strong>, <strong>2008</strong><br />
doc. Ing. Olga Bláhová, Ph.D. (Z U Plze ) co-edited <strong>2008</strong><br />
RNDr. Vilma Bur íková Ph.D. (MU <strong>Brno</strong>) co-edited <strong>2007</strong><br />
Organizing committee<br />
<strong>2007</strong><br />
doc. Ing. Olga Bláhová, Ph.D. (Z U Plze )<br />
RNDr. Vilma Bur íková Ph.D. (MU <strong>Brno</strong>)<br />
prof. Ing. Ladislav Pe ek, CSc. (TU Ko ice)<br />
Mgr. Pavel Stratil (MU <strong>Brno</strong>)<br />
Ing. Zuzana Vadasová (TU Ko ice)<br />
Ing. Pavol Zubko (TU Ko ice)<br />
<strong>2008</strong><br />
Ing. ubomír Ambri ko (TU Ko ice)<br />
doc. Ing. Olga Bláhová, Ph.D. (Z U Plze )<br />
Ing. Mária Mihaliková, PhD. (TU Ko ice)<br />
prof. Ing. Ladislav Pe ek, CSc. (TU Ko ice)<br />
Ing. Pavol Zubko, PhD. (TU Ko ice)<br />
Scientific committee<br />
<strong>2007</strong><br />
doc. Ing. Olga Bláhová, Ph.D. (Z U Plze )<br />
RNDr. Vilma Bur íková, CSc. (MU <strong>Brno</strong>)<br />
prof. Ing. Jaroslav Men ík, CSc. (Univerzita Pardubice)<br />
prof. Ing. Ladislav Pe ek, CSc. (TU Ko ice)<br />
<strong>2008</strong><br />
doc. Ing. Olga Bláhová, Ph.D. (Z U Plze )<br />
prof. Ing. Jaroslav Men ík, CSc. (Univerzita Pardubice)<br />
prof. Ing. Ladislav Pe ek, CSc. (TU Ko ice)<br />
Co-Chairs<br />
Mr. prof. Ing. Ladislav Pe ek, CSc. (TU Ko ice)<br />
Mrs. doc. Ing. Olga Bláhová, Ph.D. (Z U Plze )<br />
Declaration<br />
All contributions included in this journal special issue were reviewed before publication by members of the scientific<br />
committee.<br />
s94
Table of Content<br />
LMV <strong>2007</strong><br />
Regular lectures<br />
V. Bur íková, O. Bláhová,<br />
M. Karásková, L. Zají ková,<br />
O. Ja ek, D. Franta, P. Klapetek,<br />
J. Bur ík<br />
T. Fo t, T. Vít , R. Novák,<br />
J. Grossman, J. Sobota, J. Vysko il<br />
M. Ka parová, . Houdková,<br />
F. Zahálka<br />
LMV <strong>2008</strong><br />
Invited lectures<br />
Regular lectures<br />
Mechanical properties of ultrananocrystalline thin films deposited using dual<br />
frequency discharges<br />
Testing of the impact load and tribological behaviour of W-C:H hard<br />
composite coatings<br />
Angle of spraying and mechanical properties of WC-Co coatings prepared<br />
by HVOF spray technology<br />
J. Kraj ovi , I. Jan u ka Determination of the optical fibre deformation by the interferogram analysis s109<br />
F. Lofaj, M. Ferdinandy, A. Juhász Nanohardness of WC/C coating as a function of preparation conditions s112<br />
J. Men ík Determination of parameters of viscoelastic materials by instrumented<br />
indentation<br />
J. N me ek Local micromechanical properties of cement pastes s120<br />
J. N me ek, K. Forstová Delayed deformation recovery after nanoindentation of cement paste s123<br />
J. Ráhe , P. S ahel, M. Odrá ková Wood surface modification by dielectric barrier discharges<br />
at atmospheric pressure<br />
P. S ahel, V. Bur íková, J. ech,<br />
Z. Navrátil, P. Kloc<br />
A. Stoica, R. Vl doiu,<br />
G. Musa, V. Ciupin , M. Contulov,<br />
V. Bur íková, O. Bláhová<br />
Z. Vadasová, L. Pe ek,<br />
M. Kollárová, O. Bláhová, P. Zubko<br />
Deposition and characterization of thin hydrophobic layers using<br />
atmospheric-pressure surface barrier discharge<br />
s95<br />
s98<br />
s102<br />
s105<br />
s115<br />
s125<br />
s129<br />
Mechanical properties of thin films deposited by TVA and G-TVA methods s132<br />
Nanoindentation measurements of the intermetallic phases in galvanneal<br />
coatings<br />
O. Bláhová, M. pírková Local mechanical properties of organic-inorganic nanocomposite layers<br />
(Lokální mechanické vlastnosti organicko-anorganických<br />
nanokompozitních povlak )<br />
J. Men ík Determination of parameters of viscoelastic materials by instrumented<br />
indentation<br />
J. N me ek, K. Forstová Micromechanical analysis of heterogeneous structural materials s146<br />
. Ambri ko, T. Kandra, L. Pe ek Hodnotenie indenta ných a deforma ných charakteristík laserových zvarov s150<br />
J. Bidulská, R. Ko i ko, T. Kva kaj,<br />
R. Bidulský, M. A. Grande<br />
s136<br />
s140<br />
s143<br />
Simulácie ECAP procesu zliatiny EN AW 2014 pomocou MKP s155
R. Bidulský, M. A. Grande,<br />
M. Kabátová<br />
Improved fatigue resistance of sintered steels via local hardening s159<br />
O. Bláhová Investigation of local mechanical properties of zirconium<br />
alloys using nanoindentation<br />
M. B ezina, . Kup a Mo nosti vyu itia systému na odber malých vzoriek z prevádzkovaných<br />
zariadení pri hodnotení vlastností materiálov<br />
V. Bur íková, Z. Ku erová,<br />
L. Zají ková, O. Ja ek, V. Kudrle,<br />
J. Mat jková, P. Synek<br />
L. Dajbychová, O. Bláhová,<br />
M. pírková<br />
s96<br />
s163<br />
s167<br />
Measurement of mechanical properties of composite materials s171<br />
The influence of additives on mechanical properties of organic-inorganic<br />
coatings<br />
L. Heged sová, J. Dusza Contact strength measurements and cone crack formation of Si3N4 and SiC<br />
based ceramics<br />
. Houdková, F. Zahálka,<br />
M. Ka parová, O. Bláhová<br />
s175<br />
s178<br />
Nanoindenta ní m ení HVOF st íkaných povlak s182<br />
M. Garbiak, R. Chyli ska Microhardness of phase constituents present in creep-resistant cast steel s187<br />
A. Koval íková, J. Dusza Thermal shock resistance of SiC+Si3N4 composites evaluated<br />
by indentation technique<br />
J. Kraj ovi , I. Jan u ka Holografická metóda ur enia Youngovho modulu pru nosti s195<br />
F. Lofaj Localized viscous flow in the oxide and oxynitride glasses<br />
by indentation creep<br />
R. Medlín, J. íha, O. Bláhová Microstructure and local mechanical characteristics of Zr1Nb alloy<br />
after hardening<br />
M. Mihaliková, . Ambri ko Stanovenie ve kosti plastickej zóny videoextenzometrickou<br />
metódou<br />
J. íha, O. Bláhová, P. utta Fázové zm ny slitiny Zr-1Nb a jejich vliv na lokální mechanické vlastnosti s210<br />
J. Savková, O. Bláhová Scratch resistance of TiAlSiN coatings s214<br />
J. paková, F. Dor áková, J. Dusza Indentation load/size effect of structural ceramic materials s218<br />
P. Zimov ák, O. Milkovi , P. Zubko,<br />
M. Vojtko<br />
P. Zubko, B. Ballóková, L. Pe ek,<br />
O. Bláhová<br />
s191<br />
s198<br />
s202<br />
s206<br />
Vplyv fosforu na lokálne mechanické vlastnosti a vývoj truktúry IF ocelí s223<br />
Determination of mechanical properties of MoSi2 composites<br />
by nanoindentation<br />
s227
Papers presented at<br />
the 4 th International Seminar on<br />
LOCAL MECHANICAL PROPERTIES <strong>2007</strong><br />
LOKÁLNÍ MECHANICKÉ VLASTNOSTI <strong>2007</strong><br />
November 7 th to 9 th , <strong>2007</strong><br />
<strong>Brno</strong>- lapanice, Czech Republic<br />
Organized by the Masaryk University <strong>Brno</strong><br />
in cooperation with<br />
Technical University of Ko ice<br />
and<br />
University of West Bohemia in Plze<br />
<strong>2007</strong><br />
s97
Chem. Listy 105, s98 s101 (2011) LMV <strong>2007</strong> Regular Lectures<br />
MECHANICAL PROPERTIES OF ULTRANANOCRYSTALLINE THIN FILMS<br />
DEPOSITED USING DUAL FREQUENCY DISCHARGES<br />
VILMA BUR ÍKOVÁ a *, OLGA<br />
BLÁHOVÁ b , MONIKA KARÁSKOVÁ a ,<br />
LENKA ZAJÍ KOVÁ a , OND EJ<br />
JA EK a , DANIEL FRANTA a , PETR<br />
KLAPETEK c , and JI Í BUR ÍK d<br />
a Department of Physical Electronics, Masaryk University,<br />
Kotlá ská 2, 611 37 <strong>Brno</strong>, b University of West Bohemia<br />
Plze , c Metrologic Institute, <strong>Brno</strong>, d Institute of Physics of<br />
Materials, Academy of Sciences of the Czech Republic, i kova<br />
22, 616 62 <strong>Brno</strong>, Czech Republic<br />
vilmab@physics.muni.cz<br />
Keywords: ultrananocrystalline diamond, plasma enhanced<br />
chemical vapor deposition, dual frequency discharge, local<br />
mechanical properties<br />
1. Introduction<br />
The preparation of nanostructured (nanocomposite or<br />
nanocrystalline) diamond coatings is in a centre of a great<br />
industrial interest due to their extreme mechanical hardness<br />
and wear resistance, high bulk modulus, low compressibility,<br />
high thermal conductivity, low thermal expansion coefficient,<br />
broad optical transparency from the deep ultraviolet to the far<br />
infrared, high electrical resistivity, biocompatibility, etc 1 9 .<br />
Their main advantage compared to the polycrystalline diamond<br />
film is, that they can be prepared with relatively low<br />
surface roughness. Smooth diamond films with crystallite size<br />
at nanometre scale offer the potential for manufacturing<br />
a wide variety of components and structures of technological<br />
importance, with enhanced mechanical and functional properties,<br />
which cannot be realized in conventional microstructures.<br />
The mechanical properties such as hardness, wear resistance,<br />
fracture toughness, film-substrate adhesion and thermomechanical<br />
stability of the coating-substrate system play always<br />
a crucial role for industrial applications of the coatings 10 13 .<br />
Therefore the main aim of the present work is to study the<br />
mechanical properties of ultrananocrystalline thin films using<br />
two different indentation techniques.<br />
2. Experimental<br />
The common type of microwave reactor ASTEX was<br />
used to deposit the studied films. In this reactor, microwaves<br />
are coupled into a water-cooled metal cavity through a quartz<br />
window, using an antenna, which converts the TE10 microwave<br />
mode in the wave-guide to the TM01 mode in the cavity.<br />
The inner chamber diameter is chosen so that only one microwave<br />
radial mode can be sustained in the cavity at 2.45 GHz.<br />
Substrates as large as 10 cm in diameter can be coated by<br />
s98<br />
positioning them on a heated stage beneath the plasma ball<br />
which forms immediately above it. This reactor was modified<br />
for the dual frequency application, i.e. application of RF<br />
power to a substrate holder to achieve the so-called biasenhanced<br />
nucleation (BEN). The RF power of 35 W<br />
(13.56 MHz) was capacitively coupled to the central graphite<br />
plate of the substrate holder. Due to different mobility of electrons<br />
and ions this resulted in dc self-bias accelerating the<br />
ions across the sheath adjacent to the graphite plate, i.e. the<br />
substrate, causing them to sub-plant beneath the surface and<br />
create a carbon-rich layer in the topmost few layers of the<br />
substrate. This had two important effects, the initial nucleation<br />
rate was greatly increased, and the resulting diamond film<br />
was registered with the underlying substrate lattice to a much<br />
greater extent, allowing deposition of films with a preferred<br />
orientation to be grown. The orientation of diamond crystallites<br />
was studied using XRD technique.<br />
The deposition was carried out on mirror polished (111)<br />
oriented n-doped silicon substrates in the mixture of methane<br />
(CH4) and hydrogen (H2) changing the CH4 concentration.<br />
The supplied microwave power was 850 W and pressure in<br />
the reactor was 7.5 kPa. The substrate temperature, estimated<br />
by means of a pyrometer with disappearing filament, was kept<br />
in the range from 1090 to 1120 K.<br />
A Fischerscope H100 depth sensing indentation (DSI)<br />
tester and Nano Indenter XP equipped with continuous stiffness<br />
measurement (CSM) were used to study the indentation<br />
response of ultrananocrystalline diamond films.<br />
The optical measurements were done with Horiba Jobin<br />
Yvon ellipsometer in the spectral range from 190 to 2100 nm<br />
at the incidence angles from 55° to 75° and were evaluated<br />
using a dispersion model of optical constants based on the<br />
parameterisation of densities of states (DOS) 14 .<br />
3. Results and discussion<br />
Nanostructured diamond films with different concentrations<br />
of methane (CH4) in hydrogen (H2) were studied in the<br />
present paper. According to Bachmann s 15 C-H-O gas phase<br />
concentration triangle the polycrystalline diamond can be<br />
deposited by CVD from the CH4/H2 gas mixtures, when the<br />
concentration of CH4 is in the range from 1 to 3 %.<br />
With increasing methane concentrations, the crystal sizes<br />
decrease, until above ca. 3 % CH4 in H2 the gas phase and the<br />
resulted films exhibit nanocomposite structure and may be<br />
considered to be an aggregate of diamond nanocrystals and<br />
disordered graphite. If BEN is employed as well as growth<br />
conditions, which favour one particular orientation, highly<br />
textured films can be produced which are very closely aligned<br />
with the lattice of the underlying substrate. In case of the BEN<br />
technique the monitoring the self-bias voltage provides important<br />
information about the diamond growth. At the beginning<br />
ions impinge on the almost clean silicon surface and the<br />
self-bias voltage is nearly constant. After the surface is step<br />
by step filled by diamond nuclei the measured voltage de-
Chem. Listy 105, s98 s101 (2011) LMV <strong>2007</strong> Regular Lectures<br />
Fig. 1. AFM images of the surfaces of sample D2 (2 % CH4 in the<br />
deposition mixture) and D5 (10.4 % CH4 in the deposition mixture).<br />
The analysis of AFM data yielded the RMS roughness 20.7<br />
and 8.8 nm and autocorrelation lengths of 141 and 120 nm for D2<br />
and D5, respectively<br />
creases. When the surface is completely covered the growth<br />
stage begins and the measured voltage is again constant. Sample<br />
D2 was deposited with 8.3 sccm of CH4 mixed with<br />
400 sccm of H2, i. e. equivalent to 2.0 % of CH4 in the gas<br />
phase. The nucleation stage was relatively long: it took<br />
20 minutes. Sample D5 was, on the other hand, prepared from<br />
the mixture with higher C/H, 10.4 % (flow rates of CH4 and<br />
H2 were 41.7 and 400 sccm, respectively). The nucleation<br />
stage of the film D5 prepared with highest amount of CH 4 was<br />
5 minutes.<br />
In order to prepare the films with similar thickness in<br />
these two different gas mixtures the deposition time of the D2<br />
and D5 was 28 and 15 min, respectively. AFM micrographs<br />
of the films D2 and D5 are shown in Fig. 1. They reveal<br />
a significant difference between the two films as concerns the<br />
surface topography. Especially in case of D5 the surface was<br />
relatively smooth and allowed optical measurements in the<br />
reflection mode. The analysis of AFM data yielded the RMS<br />
roughness 20.7 and 8.8 nm and autocorrelation lengths of 141<br />
and 120 nm for D2 and D5, respectively.<br />
Mechanical properties of the films D2 and D5 were studied<br />
by depth sensing indentation (DSI) test at several different<br />
final loads and by the continuous stiffness measurement<br />
(CSM) enabling the determination of the material properties<br />
continuously as the indenter moves into the surface, eliminating<br />
the need for unloading cycles. We studied not only the<br />
film hardness and elastic modulus, but also the film-substrate<br />
system indentation response in a wide range of indentation<br />
depths (20 to 3000 nm). Dependencies of the hardness and<br />
elastic modulus on the indentation depth obtained for samples<br />
D2 and D5 using these two techniques are shown in Figs. 2<br />
and 3.<br />
s99<br />
Hardness [GPa]<br />
Elastic modulus [GPa]<br />
80<br />
70<br />
60<br />
50<br />
40<br />
30<br />
20<br />
10<br />
400<br />
300<br />
200<br />
Sample D5<br />
Sample D5<br />
200 400 600 800 1000<br />
Indentation depth [nm]<br />
Fig. 2. Results of mechanical tests obtained on D5 using DSI and<br />
CSM method. The lines in hardness and elastic modulus dependences<br />
belong to the selected measurements obtained using CSM<br />
technique, the scatter graphs belong to the results obtained using<br />
DSI technique<br />
Hardness [GPa]<br />
Elastic modulus [GPa]<br />
24 Sample D2<br />
22<br />
20<br />
18<br />
16<br />
14<br />
12<br />
250<br />
200<br />
150<br />
100<br />
Sample D2<br />
200 400 600 800<br />
Indentation depth [nm]<br />
Fig. 3. Results of mechanical tests obtained on D2 using DSI and<br />
CSM methods. The lines in hardness and elastic modulus dependences<br />
belong to the selected measurements obtained using CSM<br />
technique, the scatter graphs belong to the results obtained using<br />
DSI technique
Chem. Listy 105, s98 s101 (2011) LMV <strong>2007</strong> Regular Lectures<br />
The influence of the substrate on the measured values<br />
was negligible up to 200 nm of indentation depth. With increasing<br />
indentation depth the influence of the substrate on<br />
the measured values increased. The combined effect of the<br />
film and substrate on the measured values of composite hardness<br />
Hc was modelled according to Battacharya and Nix 16 .<br />
The combined influence of the film and substrate on the<br />
measured elastic modulus was calculated according to Saha<br />
and Nix 17 . The results obtained with both DSI and CSM methods<br />
are in good agreement. The sample D2 exhibited the hardness<br />
around 20 GPa and elastic modulus of 220 GPa. Although<br />
the film D2 was deposited in "diamond yielding mixture"<br />
the low values of mechanical parameters suggest that it<br />
is rather a composite consisting of diamond crystals embedded<br />
in a disordered graphite matrix. The fact, that the results<br />
obtained by both DSI and CSM measurement were highly<br />
scattered confirm the previous assumption. The film D5 exhibited,<br />
on the other hand, relatively high hardness and elastic<br />
modulus of 65 and 375 GPa, respectively.<br />
Differential hardness [GPa]<br />
20<br />
10<br />
8<br />
6<br />
4<br />
2<br />
Sample D5<br />
500 1000 1500<br />
Indentation depth [nm]<br />
Fig. 4. Differential hardness dependence on the indentation depth<br />
obtained on D5 using the Fischerscope tester<br />
Moreover, the film D5 exhibited high fracture toughness.<br />
In Fig. 4 the differential hardness L/ (h 2 ) (here L is the load<br />
and h is the indentation depth) dependence on the indentation<br />
depth is shown for sample D5 together with the SEM image<br />
of the indentation made at maximum load of 1 N. This dependence<br />
enables to visualise the crack creation, what appears<br />
on the dependence as an abrupt jump.<br />
In case of the film D5 the ring/like through surface<br />
cracking begun (see SEM image in Fig. 5), when the indenter<br />
approached the film-substrate interface. We did not observe<br />
any cracks emanating from the indentation print corners or<br />
delamination around the indentation print even at indentation<br />
depths higher, than the film thickness.<br />
For the evaluation of optical measurements on sample<br />
D5, the Rayleigh-Rice theory for roughness 18,19 and the dispersion<br />
model of optical constants based on the parameterisation<br />
of densities of states (DOS) were taken into account. The<br />
dispersion model was similar to that presented earlier for<br />
diamond like carbon films 18,19 . The refractive index was<br />
slightly lower than that of the natural diamond. The RMS<br />
s100<br />
Fig. 5. SEM image of the indentation carried out at maximum<br />
load of 1 N<br />
roughness and autocorrelation length for D5 were 9.1 and<br />
73 nm, respectively. This is in a good agreement with the<br />
values found by AFM.<br />
4. Conclusion<br />
We have deposited a large set of diamond like carbon<br />
films with incorporation of silicon, oxygen and nitrogen. The<br />
optimum deposition conditions for deposition of smooth,<br />
hard, wear resistant thin films suitable for protection of the<br />
polycarbonate substrates were found. The film prepared under<br />
optimum conditions exhibited excellent fracture resistance<br />
and low intrinsic stress. The prepared films have all the properties<br />
needed for excellent protective coatings including high<br />
hardness, low friction coefficient, excellent chemical and<br />
thermal stability and transparency in the visible spectrum.<br />
This research has been supported by Ministry of Education,<br />
Youths and Sports of the Czech Republic under project<br />
MSM0021622411 by the grant of Czech Science Foundation<br />
No. 202/07/1669 and by Academy of Science of the Czech<br />
Republic by KAN311610701.<br />
REFERENCES<br />
1. Erdemir A., Fenske G. R., Krauss, D. M. Gruen, McCauley<br />
T., Csencsits R. T.: Surf. Coat. Technol. 120-121,<br />
565 (1999).<br />
2. Jones A. N., Ahmed W., Hassan I. U., Rego C. A., Sein<br />
H., Amar M., Jackson M. J.: J. Phys. Condens. Matter 15,<br />
S2969 (2003).<br />
3. Liu Y. K., Tzenga Y., Liu C., Tso P., Lin I. N.: Diamond<br />
Relat. Mater. 13, 1859 (2004).<br />
4. De Barros M. I., Vandenbulcke L.: Diamond Relat.<br />
Mater. 9, 1862 (2000).<br />
5. Hogmark S., Hollman O., Alahelisten A., Hedenqvist P.:<br />
Wear 200, 235 (1996).<br />
6. Yugo S., Kanai T., Kimura T., Muto T.: Appl. Phys. Lett.<br />
58, 1036 (1991).<br />
7. Seo S.-H., Lee T.-H., Park J.-S.: Diamond Relat. Mater.<br />
12, 1670 (2003).
Chem. Listy 105, s98 s101 (2011) LMV <strong>2007</strong> Regular Lectures<br />
8. Asmussen J., Reinhard D. K. (ed.): Diamond Films<br />
Handbook. Marcel Dekker, New York 2001.<br />
9. May V.: Phil. Trans. R. Soc. Lond. A (2000).<br />
10. Veprek S., He J. L.: Surf. Coat. Technol. 163-164, 374<br />
(2003).<br />
11. Musil J., Zeman H.: Mater. Sci. Eng., A 340, 281 (2003).<br />
12. Bachmann P. K., Drawl W., Knight D., Weimer R., Messier<br />
R.: Mater. Res. Soc. Symp. Proc. EA-15, 99 (1988).<br />
13. Oliver W. C., Pharr G. M.: J. Mater. Res. 7, 1564 (1992).<br />
14. Ohlídal I., Franta D., Klapetek P.: Proceedings of the 4th<br />
Seminar on Quantitative Microscopy, Braunschweig,<br />
Germany, 124 (2000).<br />
15. Bachmann P. K., Leers D., Lydtin H.: Diamond Relat.<br />
Mater. 1, 1 (1991).<br />
16. Battacharya A. K., Nix W. D.: Int. J. Solids Struct. 38,<br />
335 (2001).<br />
17. Saha R., Nix W. D.: Acta Materialia 50, 23 (2002).<br />
18. Franta D., Ohlídal I.: Opt. Commun. 248, 459 (2005).<br />
19. Franta D., Ohlídal I., Bur íková V., Zají ková L.: Thin<br />
Solid Films 455-456, 393 (2004).<br />
s101<br />
V. Bur íková a *, O. Bláhová b , M. Karásková a ,<br />
L. Zají ková a , O. Ja ek a , D. Franta a , P. Klapetek c , and<br />
J. Bur ík d ( a Department of Physical Electronics, Masaryk<br />
University, <strong>Brno</strong>, b University of West Bohemia, Plze , c Czech<br />
Metrologic Institute, <strong>Brno</strong>, d Institute of Physics of Materials,<br />
Academy of Sciences of the Czech Republic, <strong>Brno</strong>, Czech<br />
Republic): Mechanical Properties of Ultrananocrystalline<br />
Thin Films Deposited Using Dual Frequency Discharges<br />
The present paper describes the deposition of nanostructured<br />
diamond films with low surface roughness, high hardness<br />
and fracture toughness by microwave PECVD in the<br />
ASTeX type reactor from mixture of methane and hydrogen.<br />
Films were deposited on a mirror polished (111) oriented ndoped<br />
silicon substrate. The film exhibited relatively low<br />
roughness, the root mean square (RMS) of heights ranged<br />
from 20 to 9.1 nm, depending on the deposition conditions.<br />
The hardness was found to be in the range from 22 to 65 GPa<br />
and the elastic modulus ranged from 220 to 375 GPa, depending<br />
on the film structure.
Chem. Listy 105, s102 s104 (2011) LMV <strong>2007</strong> Regular Lectures<br />
TESTING OF THE IMPACT LOAD AND TRIBOLOGICAL BEHAVIOUR OF W-C:H<br />
HARD COMPOSITE COATINGS<br />
TOMÁ FO T a *, TOMÁ VÍT b ,<br />
RUDOLF NOVÁK c , JAN GROSSMAN a ,<br />
JAROSLAV SOBOTA a ,<br />
and JI Í VYSKO IL d<br />
a Institute of Scientific Instruments, Academy of Sciences of<br />
the Czech Republic, Kralovopolska 147/62, 61264 <strong>Brno</strong>,<br />
b Faculty of Transportation Sciences, Czech Technical University,<br />
Na Florenci 25, 110 00, Prague 1, c Faculty of Mechanical<br />
Engineering, Czech Technical University, Technicka<br />
4, 166 07, Prague 6, d HVM Plasma Ltd, Prague 5 Czech<br />
Republic<br />
fortt@isibrno.cz<br />
Keywords: PVD, DLC, impact test, pin-on-disc, friction coefficient<br />
1. Introduction<br />
Hard carbon based composite coatings are more and<br />
more frequently used in practical applications, such as automotive<br />
industry, where not only good adhesion and wear resistance,<br />
but also reasonable thermal stability, low wear at<br />
elevated temperatures and impact resistance are required.<br />
Diamond-like carbon coatings have a range of tribological<br />
properties that are controlled with the incorporation of additional<br />
elements such as silicon, nitrogen or metal. Considerable<br />
scientific and industrial interest is focused in nanocomposite<br />
coatings containing tungsten in the diamond-like amorphous<br />
hydrogenated carbon matrix (W-C:H). These coatings<br />
generally possess high hardness, low friction coefficients<br />
against a range of counterfaces, good wear resistance and<br />
good adhesion to a range of substrates by controlling the interlayers<br />
responsible for promoting good adhesion and control<br />
of residual stress in the coatings 1 . Numerous papers deal with<br />
the tribological behaviour and properties of DLC coatings 2,3 .<br />
Density, hardness and compressive stress of W-C:H coatings<br />
were studied as a function of composition and structure and<br />
deposition conditions 4 . The effect of slightly different hydrogen<br />
content in W-C:H coatings on microstructure, adhesion<br />
and tribological properties was studied in ref. 5 . A detailed<br />
structural characterization of W-C:H showed the existence of<br />
a submicrometer scale columnar structure and intercolumnar<br />
defects within the coating 6 . This structure could be related to<br />
failure mechanisms during tribological and wear tests. In the<br />
case of W-C:H coatings the outweighing degradation mechanism<br />
was a combination of polishing wear with micro- or<br />
nano-delamination and micro-pitting 7 . Nevertheless, no results<br />
of detailed studies of tribological parameters temperature<br />
dependency have been published yet.<br />
The dynamic impact wear tester developed in our laboratory<br />
has been used to evaluate the impact resistance of thin<br />
s102<br />
hard composite coating in dynamic loading wear applications.<br />
Impact testing of the coatings was proposed by Knotek et al in<br />
the 1990 s (ref. 8 ). During testing the specimen was cyclically<br />
loaded by tungsten carbide ball that impacts against the coating/substrate<br />
surface. After each the test, wear scars were<br />
evaluated by means of optical microscope and profilometer.<br />
Results of these tests show usability of coatings in dynamic<br />
load and enable to optimize the design of the coating/substrate<br />
system for the particular use. The test simulates a wide range<br />
of tribological systems. The impact test offers an important<br />
new method for determination of the fracture toughness of<br />
hard thin coatings.<br />
2. Experimental Details<br />
The substrates made from high speed steel were used<br />
with tempering temperature of 550 °C. They were polished<br />
with brush papers and finally with diamond pastes. The substrate<br />
hardness was 62 HRC. W-C:H coatings were deposited<br />
with combined PVD and PACVD processes. Thickness determined<br />
by calotest method was about 2 m. The dynamic impact<br />
wear tester developed in the Institute of Scientific Instruments<br />
ASCR in collaboration with <strong>Brno</strong> University of Technology<br />
has been used to evaluate modified DLC coatings.<br />
Setting of the impact tester: impact force from 200 N to<br />
600 N, number of impacts could be varied from 1 to 100 000.<br />
The tungsten carbide ball 5.00 mm in diameter with guaranteed<br />
geometry and surface roughness was used. After each<br />
test, wear scars were evaluated by means of profilometer Talystep<br />
(Taylor-Hobson) and confocal microscope<br />
LEXT OLS 3100 (Olympus). Impact tester has been used in<br />
our laboratory for more than two years to evaluate hard coatings<br />
produced in coating centres and both its hardware and<br />
software were improved to achieve minimum scattering of<br />
measured values caused by the device. Nowadays the range of<br />
values scattering on homogenous coating/sample system does<br />
not exceed several percent.<br />
The coatings hardness and Young modulus were measured<br />
with nanoindenter Fisherscope H100. The results were:<br />
indentation force F = 50 mN, universal hardness<br />
Hu = 6380±120 MPa, We/Wtot = 58 %, E = 151±4 GPa. Parameters<br />
measured with higher indentation forces (up to 1 N)<br />
did not differ substantially. In order to verify the adequate<br />
mechanical properties of W-doped a-C:H coatings, the tribological<br />
performance was studied using standardized pin-ondisc<br />
CSM Instruments measuring device. The tests were carried<br />
out in the temperature range from 20 °C (room temperature,<br />
RT) to 200 °C, thus the thermal stability could be determined.<br />
The testing conditions were set as follows 5000 cycles,<br />
normal load 5 N, linear speed 0.05 m s 1 . The testing<br />
ball-coating contact was unlubricated and the relative air humidity<br />
at room temperature was about 40±5 %. As counterparts<br />
the ceramic Al2O3 balls with diameter of 8 mm were<br />
used.<br />
The tribological performance was determined not only<br />
with respect to the friction coefficients, but from the point of
Chem. Listy 105, s102 s104 (2011) LMV <strong>2007</strong> Regular Lectures<br />
view of wear rates and free wear debris characterization as<br />
well. The coating wear rates were evaluated on the basis of<br />
cross-section wear track profile measurements, the wear rates<br />
of balls were calculated from spherical wear cap images taken<br />
from optical microscopy. The wear rates were determined as<br />
the worn volume per sliding distance and load 9 . Each tribological<br />
test was carried out three times with expected measured<br />
parameters standard deviation of about 10 %. In this<br />
paper the average values of friction coefficient and wear rates<br />
are presented. To determine the dominant wear mechanism,<br />
the wear tracks were studied using optical microscopy, scanning<br />
electron microscope JEOL JSM-6460 LA and confocal<br />
microscope. Additionally, the measurements of coating hardness<br />
were taken into account.<br />
3. Results<br />
3.1. Impact tests<br />
Fig. 1 shows crater volumes against the number of impacts<br />
plotted at three different impact forces. Volumes were<br />
calculated provided that the shape of the crater was approximated<br />
by a rotational paraboloid, by using the radius and the<br />
average depth of the crater measured by profilometer. Average<br />
values were calculated from at least five repetitive measurements<br />
carried under identical conditions. The wear rate<br />
was calculated using central part of the dependence (from 5 to<br />
50 000 impacts) as a quotient of the variation of crater volume<br />
V and the number of impacts. In the Tab. I the wear rates for<br />
three values of impact forces are summarized.<br />
In the Fig. 2 the crater volume corresponding to wear<br />
rate of coating/substrate system and bare substrate is presented.<br />
In spite of this high load the coating has beneficial<br />
effect on the system wear resistance in the whole range,<br />
namely for higher number of impacts.<br />
Table I<br />
Wear rate of the coating/substrate system in dynamical mode<br />
for the load forces 200 N, 400 N and 600 N<br />
F [N] 200 400 600<br />
V [mm 3 ] 3.4 E-8 14 E-8 23 E-8<br />
Fig. 1. Mean values of crater volume, impact force varies from<br />
200 N to 600 N<br />
s103<br />
Fig. 2. Comparison of wear rate of coating/substrate system and<br />
bare substrate at 600 N<br />
3.2. Tribological tests<br />
The tribological measurements clearly showed hightemperature<br />
coating applicability limit. The friction coefficient<br />
at 200 °C became unstable and higher values of about<br />
0.45 were obtained. The coating wear scars were very coarse<br />
with deep abrasive scratches that in many cases reached the<br />
substrate surface.<br />
The typical evolution of friction coefficient with number<br />
of cycles is showed in Fig. 3. At RT the friction process is<br />
stable, short run-in could be observed and at about 500 cycles<br />
the steady-state phase was reached with average friction coefficient<br />
of about 0.1. The testing ball exhibited almost no notable<br />
surface damage, only high coverage with compact carboncontaining<br />
wear debris interlayer was observed. Thus, third<br />
body friction occurred predominantly. The calculated coating<br />
wear rate value of about 0.43 10 6 mm 3 N 1 m 1 corresponded<br />
to the low measurability limit. The wear track appeared very<br />
smooth with very low surface damage, thus, only polishing<br />
wear mechanism occurred.<br />
At 100 °C the sliding process partially lost its stable<br />
behaviour. Up to 1500 cycles the friction coefficient exhibited<br />
unsteady evolution with higher value of about 0.5. The sliding<br />
interlayer was not compact enough and, thus, ceramic ball<br />
hard surface affected the tested coating directly. Higher<br />
amount of free wear debris were produced and this process<br />
Fig. 3. Typical friction curves of Al2O3 ball against W-C:H coating<br />
at RT, 100 °C and 200 °C
Chem. Listy 105, s102 s104 (2011) LMV <strong>2007</strong> Regular Lectures<br />
resulted in consequent friction coefficient reduction above<br />
1500 cycles. The ball wear scar was negligible, the contact<br />
surface exhibited partial coverage with free wear debris. The<br />
value of coating wear rate increased to 12 10 6 mm 3 N 1 m 1 ,<br />
maximum penetration depth was about 0.5 m that corresponded<br />
to 50 % of total coating thickness. The wear tracks<br />
were rather coarser with many scratches parallel to the contact<br />
movement and significant effect of abrasive wear mechanism<br />
was observed. At 200 °C the evolution of friction coefficient<br />
was unstable reaching high value of about 0.45. The free wear<br />
debris did not affect the ball-coating interface; no compact<br />
sliding interlayer was observed. Thus, the ceramic ball surface<br />
slid directly on the tested surface and induced very high abrasive<br />
wear of coating. The coating wear rate reached the value<br />
of about 31 10 6 mm 3 N 1 m 1 and the penetration depth exceeded<br />
in some cases the coating thickness. The failure of ball<br />
surface was negligible.<br />
4. Conclusions<br />
The impact tests demonstrated low wear rate of the coating/substrate<br />
system in a wide range of dynamical load. Coating<br />
erosion occurred and the substrate was gradually uncovered<br />
only for the highest impact force of 600 N and the number<br />
of impacts exceeding 50 000. At 100 000 impacts approximately<br />
one half of the coating was removed.<br />
The comparison of the wear rate coating/substrate system<br />
and the bare substrate clearly demonstrated that the coating<br />
significantly extended the lifetime of the tribological system<br />
even for high loads and high number of loading cycles.<br />
The results of tribological testing showed the temperature<br />
limit of about 200 °C. The increase in wear rate was<br />
probably due to lower humidity, graphitization and coating<br />
hardness reduction at elevated temperature. This phenomenon<br />
is under further investigation.<br />
This work has been supported by grant of Czech Ministry of<br />
Industry and Trade MPO 2A-1TP1/031.<br />
s104<br />
REFERENCES<br />
1. Veverkova J., Hainsworth S. V.: Wear 264, 518 (<strong>2008</strong>).<br />
2. Grill A.: Diamond Relat. Mater. 8, 428 (1999).<br />
3. Erdemir A.: Tribol. Int. 37, 1005 (2004).<br />
4. Pujada B. R., Janssen G. C. A. M.: Surf. Coat. Technol.<br />
201, 4284 (2006).<br />
5. Kao W. H.: Mater. Sci. Eng., A 432, 253 (2006).<br />
6. Jiang J. C., Meng W. J., Evans A. G., Cooper C. V.: Surf.<br />
Coat. Technol. 176, 50 (2003).<br />
7. Yonekura D., Chittenden R. J., Dearnley P. A.: Wear<br />
259, 779 (2005).<br />
8. Knotek O., Bosserhoff B., Schrey A., Leyendecker T.,<br />
Lemmer, Esser S.: Surf. Coat. Technol. 54/55, 102<br />
(1992).<br />
9. Holmberg K., Mathews A.: Coatings Tribology, Elsevier,<br />
Amsterdam 1998.<br />
T. Fo t a *, T. Vít b , R. Novák c , J. Grossman a ,<br />
J. Sobota a , and J. Vysko il d ( a Institute of Scientific Instruments,<br />
Academy of Sciences of the Czech Republic, b Faculty<br />
of Transportation Sciences, Czech Technical University, Prague,<br />
c Faculty of Mechanical Engineering, Czech Technical<br />
University, Prague, d HVM Plasma Ltd, Prague, Czech Republic):<br />
Testing of the Impact Load and Tribological Behaviour<br />
of W-C:H Hard Composite Coatings<br />
W-C:H hard composite coatings were studied. The comparison<br />
of the wear rate of the coating/substrate system and<br />
the bare substrate obtained from dynamic impact test clearly<br />
demonstrated that the coating significantly extended the lifetime<br />
of the samples even for high loads and high number of<br />
loading cycles. The obtained results will support the research<br />
and development of new metal-doped a-C:H coatings, which<br />
exhibit promising properties for future engineering applications,<br />
especially in dynamically loaded contacts.
Chem. Listy 105, s105 s108 (2011) LMV <strong>2007</strong> Regular Lectures<br />
ANGLE OF SPRAYING AND MECHANICAL PROPERTIES OF WC-Co COATINGS<br />
PREPARED BY HVOF SPRAY TECHNOLOGY<br />
MICHAELA KA PAROVÁ, ÁRKA<br />
HOUDKOVÁ, and FRANTI EK<br />
ZAHÁLKA<br />
KODA VÝZKUM Ltd., Plze , Czech Republic<br />
michaela.kasparova@skodavyzkum.cz<br />
Keywords: WC-Co, HVOF spray technology, deposition angle,<br />
IFT, microhardness<br />
1. Introduction<br />
1.1. HVOF technology<br />
Thermal spray technology encompasses a group of coating<br />
processes that provide functional surfaces to protect or<br />
improve the performance of a substrate or component. Many<br />
types and forms of materials can be thermally sprayed<br />
which is why thermal spraying is used worldwide to provide<br />
protection from corrosion, wear, and heat; to restore and repair<br />
components; and for a variety of other applications.<br />
HVOF (High Velocity Oxygen Fuel spray) spray technology<br />
uses a high velocity spraying of the flame. This method was<br />
developed most of all for spraying of the cermets coatings. It<br />
is based on the special torch design where the combustion<br />
products (oxygen and kerosene) rapidly expand in the nozzleend<br />
and consequently come to the dramatic acceleration. The<br />
powder of coated material, injected to the flame, reaches<br />
a supersonic velocity. The combustion is also accomplished<br />
by the heating for melting of the incomings powder. The<br />
melted powder particles impinge on the grit-blasting substrate<br />
and create the coating. Schematic picture of HVOF spraying<br />
is described in Fig. 1. With HVOF technology the coatings<br />
with a high adhesion, cohesion and density, with a low oxides<br />
and pores contents are created. The main advantage of HVOF<br />
technology is the deposition of cermets coatings with the<br />
hardness about 55 66 HRC that are used for the most demanding<br />
applications 2 .<br />
1.2. WC-Co coating<br />
In the WC-Co sprayed coatings there are carbides homogenously<br />
distributed in the coatings without mutual touch.<br />
That is influenced by the high part of cobalt in this sprayed<br />
system (12 17 % Co) and by the loss of the WC particles or<br />
by their dissolution in the cobalt during the spraying. In comparison<br />
with the basic powder material, the changes in the<br />
coatings composition appear due to the spraying process. The<br />
main cause is the decarburization, in other words the carbon<br />
elimination. A high flame temperature of the applied fuel<br />
increases the carbon loss during the spray process 10 . During<br />
this process one part of WC is diffusing to W2C and W while<br />
generating CO and CO2.<br />
s105<br />
Fig. 1. The scheme of HVOF spray technology<br />
After oxidation the process continues with W and C<br />
dissolution in cobalt. The particles impacting the substrate<br />
become cold very fast and the matrix solidifies in the amorphous<br />
or in the fine-grinded form like a supersaturated solid<br />
solution from which can precipitate W and other phases<br />
(brittle phases Co3W3C, Co6W6C). The decarburization and<br />
arising of the brittle phases is undesirable because they decrease<br />
the ductility of Co matrix and the cermet losses its<br />
excellent properties combination of the hard phase in the<br />
ductile basis 2,3 .<br />
For the creating of coatings with definite desired properties<br />
it is important to spray at optimal conditions. The most<br />
important spray conditions are the equivalent ratio (relation<br />
between oxygen and kerosene), the pressure in the combustion<br />
chamber, and the deposition distance. The next important<br />
spray condition is the angle of spraying. The stream of spray<br />
particles should impact the target surface as close to normal<br />
(deposition angle 90°) as possible. It is mentioned that the<br />
decreasing deposition angle is followed by the decrease of the<br />
coating properties like the bond strength and the coating cohesion<br />
and increase of the coating porosity. Particle impacting at<br />
angles of less than 90° creates a shadowing effect that results<br />
in increasing of the coating porosity 1 .<br />
2. Experiment<br />
The WC-Co powder is documented in Fig. 2. The initial<br />
powder for spraying is agglomerated and sintered with chemical<br />
composition 83 % WC and 17 % Co and its grain size is<br />
15 45 m. The powder particles are spherical and the WC<br />
grains (white areas) are uniform distributed in the cobalt<br />
phase (grey areas). Inside of the particles are visible pores, the<br />
dark areas in the SEM picture. The material of this powder<br />
was sprayed in five different deposition angles: 90°, 75°, 60°,<br />
45° and 30° on the steels substrate. The substrate material was
Chem. Listy 105, s105 s108 (2011) LMV <strong>2007</strong> Regular Lectures<br />
Fig. 2. SEM picture of the WC-Co powder, left: the powder surface,<br />
right: the powder cross section; the hell areas carbides<br />
WC, the grey areas Co matrix, dark areas pores<br />
the steel SN 11 373. The substrate surface was before spraying<br />
cleaned and roughened by grit-blasting for a good coating<br />
adhesion to the substrate. The grit-blasted medium was brown<br />
corundum in average size 1 mm.<br />
The optimized spraying parameters are the standard<br />
parameters used in KODA VÝZKUM Ltd. Plze . On such<br />
prepared samples were measured several mechanical properties.<br />
The microhardness, indentation fracture toughness (IFT)<br />
and coating microstructure were investigated.<br />
Fig. 3. Evaluation of the fracture toughness<br />
LEM theory: KIC=0,0134 (L/c 3/2 ) (E/H) 1/2 ref. 5<br />
LS theory: KIC=0,0101 L/(ac 1/2 ) ref. 6<br />
EC theory: KIC=0,0824 L/c 3/2 ref. 7<br />
LF theory: KIC=0,0515 L/(c 3/2 ) ref. 8<br />
Here is a ½ of the diagonal length [m], c fracture length<br />
+ a [m], E/H materials constant [ ], KIC fracture toughness<br />
[MPa m 1/2 ]<br />
The microhardness HV0.3 was measured on the coating<br />
cross sections by LECO DM-400A Hardness Tester. The used<br />
load was 300 g and the indentation time was 10 s. Altogether<br />
there were prepared 10 indentations. The lengths of diagonals<br />
were measured and then calculated for an average value. In<br />
the accordance with the Standard SN EN ISO 6507-4 (ref. 4 )<br />
the microhardness value was determined from the diagonal<br />
length.<br />
The indentation fracture toughness was determined by<br />
the help of the Scratch Tester Revetest in the Academy of<br />
Science in Plze . In the cross sections were prepared 10 indentations<br />
by the Vickers diamonds indenter. The load was<br />
s106<br />
selected in such manner in order to be possible to obtain<br />
cracks which start from the corners of the indents, Fig. 3.<br />
WC-Co cermet is very hard and tough therefore it was necessary<br />
to use a load of 200 N for crack creation. After these<br />
cracks were measured we determined the IFT values by using<br />
the four models below.<br />
Microhardness and fracture toughness were evaluated on<br />
the cross sections of the samples. For sections preparation was<br />
used standard method for metallography preparation of hard<br />
metals 9 .<br />
3. Results<br />
3.1. Coatings microhardness<br />
Results of microhardness testing are summarized in the<br />
Tab. I. For WC-Co coatings the typical high microhardness<br />
also corresponds to their high resistance against several wear<br />
conditions. As seen in the Tab. I and in Fig. 4, the microhardness<br />
has the tendency to decrease with lower deposition angle.<br />
For deposition angles 30° and 45° we noticed the lowest values<br />
and then it is seen an increase up to the deposition angle<br />
90° where the microhardness is the highest. The microhardness<br />
variance between deposition angles 90° and 30° is of<br />
a significant value 145 HV0.3.<br />
3.2. Indentation fracture toughness and microstructure<br />
Thermally sprayed coatings show a strong anisotropy<br />
due to their lamellar structure. Because of that the lengths of<br />
cracks differ significantly in parallel and perpendicular direction<br />
with respect to coatings surface 11 . In this experiment<br />
there were measured only parallel cracks, Fig. 5. As shown in<br />
the picture, the cracks spread parallel through the coatings<br />
from the corner of the indent.<br />
The lengths of the cracks were specific to each deposition<br />
angle. For lower deposition angles the cracks were longer<br />
and wider. Also the indents size was different for the different<br />
deposition angles. The coatings prepared with the lower depositions<br />
angles showed a lower indents size. That is among<br />
others obvious from the results of microhardness.<br />
The results of the indentation fracture toughness (IFT)<br />
for all used models are contained in Tab. II below. In Fig. 6 it<br />
is recorded an evident effect of deposition angle on IFT. The<br />
IFT values that are calculated according to models 5 8 differ<br />
significantly, but they have a similar tendency. The deposition<br />
Table I<br />
List of microhardness values<br />
Deposition angle Microhardness<br />
HV0.3<br />
Standard deviation<br />
[±]<br />
30° 1145 100<br />
45° 1134 80<br />
60° 1238 90<br />
75° 1291 70<br />
90° 1319 110
Chem. Listy 105, s105 s108 (2011) LMV <strong>2007</strong> Regular Lectures<br />
Microhardness HV0,3<br />
1,50E+03<br />
1,40E+03<br />
1,30E+03<br />
1,20E+03<br />
1,10E+03<br />
1,00E+03<br />
9,00E+02<br />
8,00E+02<br />
30° 45° 60° 75° 90°<br />
Deposition angle [ o ]<br />
Fig. 4. Dependence of the microhardness on the deposition angle<br />
a<br />
b<br />
Fig. 5. Measurements of indentation fracture toughness, a) cracks<br />
in the coating sprayed under 90°, b) cracks in the coating sprayed<br />
under 30°<br />
angle definitely influences the IFT. The trend of IFT changes<br />
is similar to the changes of microhardness. With the decreasing<br />
deposition angle decreases the indentation fracture toughness<br />
of the coatings. One disagreement in this trend of IFT<br />
measuring is only for deposition angle 60° and 75° where the<br />
IFT values are identical.<br />
The fracture strength of WC-Co cermet depends mainly<br />
on the carbides grain contents and carbide grain size in the<br />
coating and further also on the amount of Co-binder phase.<br />
For WC-Co system exists an optimal carbide grain size and<br />
free path of cobalt binder where occurs the highest fracture<br />
strength 12 . During HVOF spray process the decarburization<br />
which leads to the carbides loss might occur together probably<br />
with the carbide loss provoked by melted particle impact<br />
on the substrate. When the melted particle impinges the substrate<br />
with the high velocity it could occur a disadvantageous<br />
s107<br />
Table II<br />
Summary of IFT values<br />
[ o ] Indentation fracture toughness<br />
IFT<br />
[MPa m 1/2 ]<br />
effect of some hard WC grains ejecting from the melted cobalt<br />
matrix. This undesirable effect could be higher when the<br />
deposition angle decreases and the particles impinge on the<br />
substrate in oblique direction. This assumption could explain<br />
why the IFT value decreases with decreased deposition angle.<br />
The coatings cross sections show several differences in<br />
the microstructure. All coatings are dense without cracks and<br />
presence of oxides. The boundary between individual splats<br />
(impinged melted particles) is not identifiable and the adhesion<br />
to the substrate seems to be good. The coatings sprayed<br />
under the angles 75° and 90° show uniform carbides distribution<br />
and the pores content is low and nearly identical. The<br />
pores are small and spherical. The coatings sprayed under 60°<br />
and lowers contents more porosity in particular the coating<br />
sprayed under the angle 45°. Increase of coatings porosity can<br />
tend to decrease coating cohesion and fracture strength.<br />
4. Conclusion<br />
Standard deviation<br />
[MPa m 1/2 ]<br />
LEM LS EC LF LEM LS EC LF<br />
30 0.75 0.62 1.1 0.68 0.07 0.05 0.1 0.07<br />
45 0.87 0.72 1.3 0.78 0.30 0.10 0.4 0.20<br />
60 1.00 0.84 1.5 0.91 0.20 0.10 0.3 0.20<br />
75 0.98 0.83 1.4 0.88 0.30 0.20 0.4 0.30<br />
90 1.20 0.93 1.8 1.10 0.4 0.20 0.7 0.40<br />
Indentation fracture thoughness [MPa.m -1/2 ]<br />
2,60E+00<br />
2,40E+00<br />
2,20E+00<br />
2,00E+00<br />
1,80E+00<br />
1,60E+00<br />
1,40E+00<br />
1,20E+00<br />
1,00E+00<br />
8,00E-01<br />
6,00E-01<br />
4,00E-01<br />
LEM<br />
LS<br />
EC<br />
LF<br />
30° 45° 60° 75° 90°<br />
Deposition angle [ o ]<br />
Fig. 6. Effect of deposition angle on the indentation fracture<br />
toughness<br />
The experimental results described in this paper show<br />
that the deposition angle in the HVOF spray process plays an<br />
essential role for the resulting coating properties. The coating<br />
sprayed with 90° deposition angle shows the best mechanical<br />
properties.<br />
The coating microhardness and indentation fracture<br />
toughness decrease with the decreasing of the deposition angle.<br />
This deterioration of mechanical coatings properties is
Chem. Listy 105, s105 s108 (2011) LMV <strong>2007</strong> Regular Lectures<br />
probably affected by WC grain loss in the coatings that are<br />
sprayed by lower deposition angle than 90°. Further effect<br />
could be assigned to coatings porosity rise and to cohesion<br />
loss in the coatings that are sprayed with the lower deposition<br />
angles.<br />
The article was prepared thanks to the project of Ministry of<br />
Education, Youth and Physical Training of the Czech Republic<br />
MSM4771868401.<br />
REFERENCES<br />
1. Davis J. R. & Associates: Handbook of Thermal Spray<br />
Technology, ASM International, USA 2004.<br />
2. En l R.: Diserta ní práce, Z U, Plze 1999.<br />
3. Loveloc H. L.: J. Therm. Spray Technol. 7, 357 (1998).<br />
4. Kovové materiály - Zkou ka tvrdosti podle Vickerse -<br />
Tabulky hodnot tvrdostí, SN EN ISO 6507-4, eský<br />
normaliza ní institut, (2006).<br />
5. Lawn B. R., Evans A. G., Marshall D. B.: J. Am. Ceram.<br />
Soc. 63, 574 (1980).<br />
6. Lawn B. R., Swain M. V.: Mater. Sci. 10, 2016 (1975).<br />
7. Evans A. G., Charles E. A.: J. Am. Ceram. Soc. 59, 371<br />
(1976).<br />
8. Lawn B. R., Fuller E. R.: J. Mater. Sci. 10, 2016 (1975).<br />
9. Bjerregaard L., Geels K., Ottesen B., Ruckert M.:<br />
Metalog Guide, Struers A/S, ISBN 80-238-3488-6<br />
(1996).<br />
s108<br />
10. Schwetzke R., Kreye H.: J. Therm. Spray Technol. 8, 436<br />
(1999).<br />
11. Houdková .: Diserta ní práce, Z U, Plze 2003.<br />
12. Liu B. et al.: Mater. Chem. Phys. 62, 35 (2000).<br />
M. Ka parová, F. Zahálka, and . Houdková ( KODA<br />
VÝZKUM Ltd., Plze , Czech Republic): Angle of Spraying<br />
and Mechanical Properties of WC-Co Coatings Prepared<br />
by HVOF Spray Technology<br />
Thermal spraying is the effective technology that produces<br />
the coatings from 50 m to several millimeters in the<br />
thickness. In this paper the HVOF spray technology is discussed.<br />
This technology for its typical properties is most of all<br />
used for forming cermets coatings. WC-Co cermets coating<br />
was tested and its mechanical properties were studied. WC-<br />
Co coatings were sprayed with five different angles (90°, 75°,<br />
60°, 45° and 30°). The deposition angle is very important for<br />
resulting coating properties. The deposition angle influences<br />
most of all bond strength, coating cohesion and porosity of<br />
the coating. From this case the different properties for the five<br />
different deposition angles were expected. We directed our<br />
attention at the hardness measurements and indentation fracture<br />
toughness (IFT) measurements. The results of microhardness<br />
and IFT indicate on mechanical material properties in the<br />
influence of the deposition angle.
Chem. Listy 105, s109 s111 (2011) LMV <strong>2007</strong> Regular Lectures<br />
DETERMINATION OF THE OPTICAL FIBRE DEFORMATION<br />
BY THE INTERFEROGRAM ANALYSIS<br />
JOZEF KRAJ OVI<br />
and IGOR JAN U KA<br />
Faculty of Materials Science and Technology STU, Institute<br />
of Materials, Department of Physics, Paulínska 16, 917 24<br />
Trnava, Slovakia<br />
krajcov@mtf.stuba.sk<br />
Keywords: optical methods, deformation, holographic interferometry,<br />
regression analysis, Young's elasticity modulus<br />
1. Theoretical substance of the two-exposure<br />
holographic interferometry method and its<br />
using for the Young's elasticity modulus<br />
measurement<br />
The light waves generated by the stimulated radiation of<br />
atoms conserve not only the frequency but also the phase<br />
during the coherence time that determines the spatial coherence.<br />
Let the v is the velocity of the light wave with the wavelength<br />
from laser and this wave is divided into two waves<br />
u1, u2 with the different passed optical paths x1, x2 .<br />
u<br />
u<br />
1<br />
2<br />
a sin<br />
b sin<br />
t<br />
t<br />
x1<br />
v<br />
x2<br />
v<br />
We can observe the interference of these two waves in<br />
the place of meeting<br />
u<br />
u<br />
u<br />
1<br />
u<br />
a sin<br />
2<br />
t<br />
kx<br />
1<br />
b sin<br />
where k<br />
wave u is<br />
2<br />
is the wave number. The amplitude of the<br />
2 2 2<br />
A a b 2abcoskx x<br />
For we obtain . If a = b,<br />
then the wave disappears in the place of meeting.<br />
We can obtain the information about the object if we<br />
divide the wave from laser into two waves. The first falls on<br />
the object. This wave is reflected and dispersed by the object<br />
and falls on the holographic plate with high resolution. The<br />
second wave falls on the same plate after the reflection by the<br />
mirror. Both of the waves write the information about the<br />
object on the plate during the first exposure, see Fig. 1.<br />
If we do the second exposure with the same plate, when<br />
the object is deformed, we obtain the picture of the object<br />
with the interference fringes, that carry the information about<br />
the object deformation 1 k x1<br />
x2<br />
2n<br />
1<br />
A a b<br />
. This fact we use for the Young's<br />
t<br />
1 2<br />
kx<br />
2<br />
s109<br />
a<br />
b<br />
HP<br />
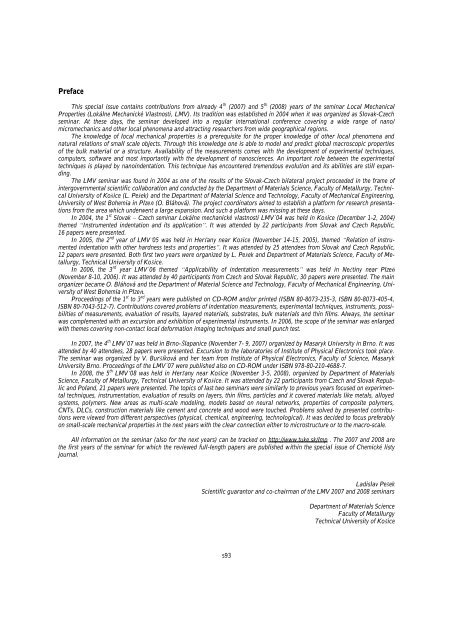
Fig. 1. An optical composition. M mirror, a, b parallel beams of<br />
coherent waves, HP holographic plate, O object<br />
elasticity modulus determination. The down end of the material<br />
is fixed and the up end is deviated by the force F action<br />
during the second exposure. We can calculate the bend y of<br />
the loose girder end by formula.<br />
y<br />
3<br />
Fl<br />
3EJ<br />
Where l is a distance between the fixed end and the point<br />
of the force activity, E is the Young´s elasticity modulus, J is<br />
the area momentum of inertia for the perpendicular crosssection<br />
of the girder, see Fig. 2.<br />
l<br />
x1<br />
Fig. 2. Deformation of the object. l the length of the object, y the<br />
bend in the point of the deforming force F action, y1 - the band in<br />
distance x1 from the fixed end<br />
The bend determination needs a high accuracy, therefore<br />
the holography method is suitable. This method can determine<br />
the bend with accuracy equal to one half of the wavelength.<br />
The bend y is determined from the number n+1 of the interference<br />
dark fringes, that rise after two exposures and developing<br />
of the holographic plate on the picture (hologram) of the<br />
object, by the formula<br />
2y 2n<br />
1<br />
2<br />
y<br />
y1<br />
F<br />
O<br />
M<br />
(1)<br />
(2)
Chem. Listy 105, s109 s111 (2011) LMV <strong>2007</strong> Regular Lectures<br />
If we substitute it into equation (1), we obtain the<br />
Young´s elasticity modulus<br />
E<br />
3<br />
4Fl<br />
3J<br />
(2n<br />
1)<br />
2. Conditions of the experiment realization<br />
We used described process of the two-exposure holographic<br />
interferometry. The round cross-section optical fibre<br />
was our researched object.<br />
The choice of the deforming force value must be so that<br />
the dark fringes are well sumable, see Fig. 3.<br />
Fig. 3. Digital picture of the hologram with the well sumable interference<br />
fringes<br />
If we substitute the area momentum J of inertia for the<br />
round cross-section with the optical fibre diameter d<br />
J<br />
into equation (3), we obtain<br />
E<br />
4<br />
d<br />
64<br />
3<br />
3<br />
256Fl<br />
4<br />
d ( 2n<br />
1)<br />
where = 632.8 nm for used laser.<br />
The values of the quantities we need for using formula<br />
(5) we obtain as follows. We read the force F straight from<br />
the forcemeter scale. The accuracy depends upon the kind of<br />
the forcemeter. We measure the length l of the optical fibre<br />
after it is fixed. We use the slide rule with error 0.05 mm, but<br />
because of uncertainties that rise by fixing of the object and<br />
by determination of the force action point, we choose the<br />
accuracy 1 mm. We measure the optical fibre diameter d by<br />
means of micrometer.<br />
We read the number of the dark fringes from hologram,<br />
see Fig. 3. It is problem to read the position of the dark fringe<br />
middle, therefore we choose accuracy of the dark fringes<br />
number 1, 0.5 or 0.25. It is depends upon specific situation.<br />
(3)<br />
(4)<br />
(5)<br />
s110<br />
3. The regression analysis using<br />
One of the sources of errors is determining the position<br />
of the dark fringes middle near the point of force action.<br />
There are cases we don´t observe the fringes near the point of<br />
force action, see Fig. 4.<br />
Fig. 4. Digital picture of the hologram with the bad sumable interference<br />
fringes near the point of force action<br />
Both of the disadvantages we may eliminate by the regression<br />
analysis using. From the theory for the girder with<br />
deforming force in one point 2 yelds, that we can use equation<br />
for computing the band y1 in distance x1 from the fixed end.<br />
We may write simply equation<br />
F<br />
Fl<br />
where we substitute a a b<br />
6EJ<br />
2EJ<br />
Because we don´t know the value of the Young´s elasticity<br />
modulus, we cannot determine constants a, b directly.<br />
We determined constants a, b by means of the least<br />
squares method for the seven pairs with regression function<br />
(6). Each pair contains the measured value of the dark fringe<br />
middle position x and the measured value of the bend y for<br />
this middle. The dependence the bend of fibre upon the position<br />
x , see Fig. 5, we saved into PC memory.<br />
4. The measured and calculated values<br />
We measured the values xi by means of suitable software<br />
in the digital picture, see Fig. 4. We determined the values yi<br />
by means of formula (2). There are the values in the Tab. I.<br />
Table I<br />
y<br />
y<br />
ax<br />
F<br />
x<br />
6EJ<br />
3<br />
bx<br />
3<br />
2<br />
Fl<br />
x<br />
2EJ<br />
2<br />
I 1 2 3 4 5 6 7<br />
xi, m 0 3580.4 7221.1 9869.0 12005.3 13299.0 15706.0<br />
yi, m 0 0.158 0.475 0.791 1.110 1.420 1.700<br />
(6)
Chem. Listy 105, s109 s111 (2011) LMV <strong>2007</strong> Regular Lectures<br />
We determined the values of constants<br />
a = 3.4429048 10 13 m 2 , b = 1.2226397 10 8 m 1 .<br />
The dependence the bend y of the optical fibre upon the position<br />
x is on Fig. 5.<br />
y<br />
2.5<br />
m<br />
2<br />
1.5<br />
1<br />
0.5<br />
0<br />
0 5000 10000 15000 20000<br />
For the known value for the distance between the fixed<br />
end and the force action point x = 20 400 m we obtain<br />
y = 2.1562269 m. This value we can substitute into equation<br />
3<br />
64Fl<br />
3 d y<br />
E 4<br />
that we obtained by substituting formula (4) into (1). We used<br />
values F = 19.13 N, l = 20.4 mm and d = 0.507 mm. The<br />
calculated value of the Young´s elasticity modulus for the<br />
optical fibre is E = 7.7086629 10 9 Pa.<br />
5. Conclusion<br />
Regression curve<br />
Measured values<br />
Fig. 5. Dependence the bend of the fibre upon the position regression<br />
curve<br />
The described method enables the complex view on the<br />
deformation field distribution in the researched object without<br />
the damage of the object.<br />
x<br />
m<br />
s111<br />
We expect the increase of the accuracy by the regression<br />
analysis using.<br />
It is positive we can obtain the result from the holograms,<br />
that don´t contain the interference fringes along the<br />
whole length of the picture.<br />
Generally we can say the method is rather sensitive and<br />
it is suitable for researching of the larger cross-section objects<br />
from the metal and ceramic materials.<br />
The Young´s elasticity modulus of the measured optical<br />
fibre is at about 25-times lesser than the Young´s elasticity<br />
modulus of steel (E = 20 10 10 Pa).<br />
REFERENCES<br />
1. Bala J., Szabó V.: Holografická interferometria<br />
v experimentálnej mechanike. VEDA, Bratislava 1986.<br />
2. Pucher O. a kol.: Pru nos a pevnos I, str. 175. SV T,<br />
Bratislava 1987.<br />
This work was supported by grant agency VEGA, Slovakia<br />
(grant project 1/2100/05).<br />
J. Kraj ovi and I. Jan u ka (Faculty of Materials<br />
Science and Technology STU, Institute of Materials, Department<br />
of Physics, Trnava, Slovakia): Determination of the<br />
Optical Fibre Deformation by the Interferogram Analysis<br />
There used the optical methods for the determination of<br />
the several solid states materials mechanical parameters. For<br />
example, we may to determine the Young's elasticity modulus<br />
by means of laser, by the two-exposure holographic interferometry<br />
method. We obtained the interferogram by means this<br />
method that contained a system of the light and dark interference<br />
fringes. Then we determined the deformation of the researched<br />
material by means of the regression analysis. We<br />
used the regression analysis for the determination of the bend<br />
in the point of the force action. Our researched material was<br />
an optical fibre of the cylinder shape.<br />
This paper contains the describing of the used method,<br />
the measured values and the calculated values of the optical<br />
fibre Young's elasticity modulus.
Chem. Listy 105, s112 s114 (2011) LMV <strong>2007</strong> Regular Lectures<br />
NANOHARDNESS OF WC/C COATING AS A FUNCTION OF PREPARATION<br />
CONDITIONS<br />
FRANTI EK LOFAJ a *, MILAN FERDI-<br />
NANDY a , and ANDRÁS JUHÁSZ b<br />
a Institute of Materials Research of SAS, Ko ice, Slovakia,<br />
b Eötvös Loránd Tudomány Egyetem, Budape , Hungary<br />
flofaj@imr.saske.sk<br />
Keywords: WC/C coatings, nanohardness, indentation<br />
modulus, compressive stresses<br />
1. Introduction<br />
Amorphous hydrogenated carbon (a-C:H) coatings, including<br />
diamond-like coatings (DLC), which are rich in sp 3<br />
content, exhibit very high hardness, low friction and other<br />
properties, which make them attractive for hard protective and<br />
wear resistant films, coatings on magnetic storage devices,<br />
micro-electromechanical systems and others 1,2 . The amorphous<br />
carbon films can be deposited by variety of methods<br />
including ion-beam deposition, sputtering technique, plasma<br />
enhanced chemical vapor deposition (PECVD), pulsed laser<br />
deposition and the magnetron sputtering. Magnetron sputtering<br />
is possibly the most common and in that case, Ar + ion<br />
bombardment of a carbon target is used and a bias voltage is<br />
applied to the substrate. However, one of the problems of<br />
such coatings is a poor adhesion of the sputtered carbon films<br />
due to high intrinsic compressive stresses. Several approaches<br />
have been developed to reduce the stresses: post-deposition<br />
annealing, formation of the multilayer films consisting of<br />
sequential rich in sp 2 and sp 3 content layers 3,4 . Metal doped<br />
carbon coatings are also an interesting group which can be<br />
tailored into nanocomposite structure with special properties.<br />
Although DLC and various metal-doped DLC nanocomposite<br />
coatings have been extensively studied, W-doped diamondlike<br />
carbon films have received comparatively little attention.<br />
WC exhibits relatively high hardness and its combination with<br />
the properties of amorphous carbon in the nanocomposite<br />
structure results in a coating with low friction coefficient and<br />
good wear resistance 5 . However, similarly as pure DLC, W<br />
based-carbon coatings some drawbacks, including a poor<br />
adhesion with common substrate materials 6 , low fracture<br />
toughness (35 J m 2 , ref. 7 ) and the effect of hydrogen in the<br />
structure on the friction behavior of sp 2 rich coating. There are<br />
only a few studies on carbon based coatings without the influence<br />
of hydrogen. Some aspects of the tribological behavior<br />
of such non-hydrogenated metal containing DLC coating<br />
studied here by Camino 8 , Yang 9,10 , Zeng 11 and Konca 12 . The<br />
hardness values ranging from 1600 HV to 3300 HV were<br />
obtained despite relatively high sp 2 content by increasing bias<br />
voltage from 20 V to 90 V (ref. 9 ) due to nanocomposite structure<br />
10 . Thus, the purpose of the work is to investigate the<br />
process of the deposition conditions on the formation and<br />
nanohardness of non-hydrogenated WC/C coatings.<br />
s112<br />
2. Experimental procedure<br />
The studied WC/C films were deposited on the polished<br />
high speed steel (HSS) and Si (100) substrates using<br />
combined PVD-PECVD techniques. The substrates were<br />
cleaned by the Ar ions prior to the deposition. In some cases,<br />
a Ti sublayer was deposited using an electron gun. Then, the<br />
vapors of the W and C from a precursor were introduced into<br />
the main chamber, they were ionized and accelerated toward<br />
the substrate with the negative bias. The main deposition parameters<br />
were total gas pressure in the chamber, bias voltage<br />
applied to the substrate and current density at the substrate<br />
surface. Four series of coatings were prepared varying these<br />
parameters to optimize the conditions. Thin Ti interlayer has<br />
been deposited on the substrate in at the beginning in several<br />
cases to achieve better adhesion with the substrate. Later, Ti<br />
layer was excluded and the WC/C film was deposited directly<br />
on the substrate. Phase composition was investigated using<br />
X-ray diffraction. Film thickness was measured and the surface<br />
morphology and structure were studied in SEM on the<br />
broken cross sections. The elastic properties of the films were<br />
conducted using a nano-indenter UMIS 2000. The hardness<br />
and the reduced elastic modulus of the films were measured<br />
with a Berkovich tip, which was forced into the coating using<br />
a coil and magnet assembly. The maximum load was up to<br />
1 mN or 5 mN in 20 steps followed by a 5 sec dwell and<br />
unloading in 10 steps. Nanohardness was determined from the<br />
penetration depth at the maximum load and the reduced elastic<br />
modulus from the unloading part of the curve according<br />
the method of Oliver and Pharr. At least 15 indentations were<br />
performed automatically for each coating and the average<br />
values were calculated.<br />
3. Results and discussion<br />
The variation in the deposition conditions and the coating<br />
thicknesses are summarized in Tab. I. At the beginning<br />
(sample designated as #13), Ar carrier gas was used which<br />
resulted in the total pressure up to 4 Pa. Ti sublayer was also<br />
deposited in this case. However, the coating delaminated from<br />
the substrate in small chips, which covered significant parts of<br />
the substrate. The repetition without Ti sublayer and without<br />
Ar revealed slightly better adhesion. Thus, subsequent coat-<br />
Table I<br />
Deposition condition for the studied WC/C coatings<br />
Sample Total<br />
pressure [Pa]<br />
Bias<br />
[kV]<br />
Beam current<br />
[mA cm 2 ]<br />
Thickness<br />
[nm]<br />
#13, Ar 4 3.8 1 300<br />
#20 1 5 1 200<br />
#24 2 5 0.8 700<br />
#21 0.8 4.5 1.2 200
Chem. Listy 105, s112 s114 (2011) LMV <strong>2007</strong> Regular Lectures<br />
ings were produced without Ar and Ti at under total pressure<br />
in the range from 0.8 2 Pa. Bias voltage was in the range<br />
from 3.8 up to 5 kV and the beam current varied from 0.8 up<br />
to 1.2 mA cm 2 .<br />
The reduction of the pressure and bias increase (#20) did<br />
not solve the delamination problem, therefore we varied the<br />
beam current and the thickness (i.e. longer deposition time) of<br />
the coating. Though not fully optimized, the best results from<br />
the viewpoint of coating stability were obtained in the case of<br />
sample #21 under the lowest total pressure and highest beam<br />
current. X-ray diffraction indicated the presence of broad<br />
diffuse peaks and indentified WC which suggests that the<br />
produced coatings are nanocomposites. The morphology of<br />
this coating #21 is illustrated in Fig. 1. In contrast to all other<br />
coatings it is very smooth and almost featureless. Preliminary<br />
AFM study showed surface relief of less than 10 nm on Si<br />
wafer and up to 25 nm on the polished steel substrate. The<br />
cross section at the broken edge of the coating in Fig. 1 shows<br />
globular features with the size of 10 20 nm, which also supports<br />
the presence of nanocomposite structure. However,<br />
more detail TEM study is necessary to reveal the structure of<br />
the coating unambiguously.<br />
Nanohardness tests were initially performed with the<br />
maximum load of 1 mN to be within the limit 10% of the film<br />
thickness and to avoid substrate effects. However, the scatter<br />
among the obtained values exceeded 100% and it was reduced<br />
to acceptable level only when the load was increased to 5 mN.<br />
Typical penetration depth under those conditions was around<br />
120 nm, which means that the obtained values are lower than<br />
they should be because of the influence of softer substrate.<br />
Fig. 2 shows several loading-unloading curves obtained on a<br />
coating #21. The scatter of the curves, though still significant,<br />
is acceptable. The absence of pop-ins indicates sufficient<br />
adhesion. The results of the measurements are summarized in<br />
Tab. II.<br />
The average nanohardness of the studied coatings is<br />
within the range from 20 GPa to 24 GPa and the reduced elastic<br />
modulus in the range from 265 GPa up to 320 GPa with<br />
significant scatter (up to 50% in some cases). Such a large scatter of the data seems to be the result of<br />
the compressive stresses developed during deposition in the<br />
layers and level of their relaxation.<br />
The obtained hardness corresponds to the values for<br />
many other coatings and the true hardness of the studied coating<br />
can be increase when measured at smaller penetration<br />
depth and without the compressive stresses. The presence of<br />
such stresses is a principal problem for the nanoindentation<br />
measurements because the level of these stresses can be in the<br />
range from 1 GPa to 6 GPa (ref. 3,4 ), which is in the same order<br />
of magnitude as the measured values. Obviously, additional<br />
investigations are the unbiased values of nanohardness from<br />
the studied coatings and to reduce the compressive stresses.<br />
Fig. 1. The morphology and the cross section of the WC/C coating<br />
on steel substrate (sample #21) by SEM<br />
s113<br />
Table II<br />
Summary of the nanoindentation tests<br />
Sample Hardness [GPa]<br />
(min. max.)<br />
#13 24.1 ± 9.5<br />
(16.9 45.8)<br />
#20 21.5 ± 3.1<br />
(18.0 25.7)<br />
#24 19.9 ± 2.1<br />
(17.7 22.9)<br />
#21 20.1 ± 11.9<br />
(7.1 38.9)<br />
Load, mN<br />
5<br />
4<br />
3<br />
2<br />
1<br />
4. Conclusions<br />
HSS 070921<br />
0.8 Pa/ 4.5 k / 1.2 mA/cm 2<br />
Elastic modulus [GPa]<br />
(min. max.)<br />
323 ± 96<br />
(203 489)<br />
318 ± 24<br />
(297 355)<br />
265 ± 12<br />
(251 277)<br />
266 ± 128<br />
(106 350)<br />
0<br />
0,00 0,02 0,04 0,06 0,08 0,10 0,12<br />
Penetration depth, m<br />
Fig. 2. Indentation curves in sample #21<br />
Current study on the nanohardness of WC/C coatings<br />
prepared by a PECVD method emphasizes the problems with<br />
delamination and nanohardness measurements resulting from<br />
the presence of large compressive stresses developed during<br />
deposition. These stresses can be slightly reduced via modification<br />
of the deposition conditions, especially total pressure
Chem. Listy 105, s112 s114 (2011) LMV <strong>2007</strong> Regular Lectures<br />
and current density. Nearly optimized conditions for WC/C<br />
coating preparation were obtained and provided nanocomposite<br />
microstructure with the nanohardness of around 20 GPa<br />
and reduced elastic modulus of 266 GPa. However, additional<br />
TEM investigations are necessary to confirm the presence of<br />
nanoparticles in the coatings and further work on the reduction<br />
of the compressive stresses and improvement of coating<br />
adhesion.<br />
REFERENCES<br />
1. Grill A.: Surf. Coat. Technol. 94 95, 507 (1997).<br />
2. Liu Y., Gubisch M. et al.: Tribology Int. 39, 1584 (2006).<br />
3. Gioti M., Logothetidis S., Chariditis C.: Appl. Phys. Lett.<br />
73, 184 (1998).<br />
4. Patsalas P., Logothetidis S., Kelires P. C.: Diamond Rel.<br />
Mat. 14, 1241 (2005).<br />
5. Liu Y., Gubisch M., Hild W., et al.: Thin Solid Films<br />
488, 140 (2005).<br />
6. Bewilogua K., Cooper C.V., Specht C., et al.: Surf. Coat.<br />
Technol. 127, 224 (2000).<br />
7. Wang J. S., Sugimura Y., Evans A. G., et al.: Thin Solid<br />
Films 325, 163 (1998).<br />
8. Camino D., Jones A. H. S., Mercs D., Teer D. G.: Vacuum<br />
52, 125 (1999).<br />
9. Yang S., Camino D., Jones A. H. S., Teer D. G.: Surf.<br />
Coat. Technol. 124, 110 (2000).<br />
10. Yang S., Li X.,. Renevier N. M, Teer D. G.: Surf. Coat.<br />
Technol. 142 144, 85 (2001).<br />
s114<br />
11. Zeng X. T., Zhang S., Ding X. Z., Teer D. G.: Thin Solid<br />
Films 420 421, 366 (2002).<br />
12. Konca E., Cheng Y.-T., Weiner A. M., et al.: Surf. Coat.<br />
Technol. 200, 3996 (2006).<br />
F. Lofaj a , M. Ferdinandy a , and A. Juhász b ( a Institute<br />
of Materials Research of SAS, Ko ice, Slovakia; b Eötvös<br />
Loránd Tudomány Egyetem, Budape , Hungary): Nanohardness<br />
of WC/C Coating as a Function of Preparation Conditions<br />
A set of thin WC/C coatings had been prepared by the<br />
PECVD technique from W and C precursors under different<br />
conditions on high speed steel and Si wafer substrates. The<br />
nanohardness and indentation modulus and microstructure of<br />
these films prepared were investigated in order to establish<br />
the correlations between the preparation conditions and mechanical<br />
properties. The main problem identified after deposition<br />
were high compressive stresses causing film delamination.<br />
The modification of the total pressure with slightly increased<br />
bias and beam current density resulted in the reduction<br />
of delamination. Very large variations in the indentation<br />
hardness and indentation modulus were also attributed to the<br />
presence of high local compressive stresses. The average<br />
hardness of the coating prepared under optimized condition<br />
was around 20 GPa and indentation modulus around 265 GPa.
Chem. Listy 105, s115 s119 (2011) LMV <strong>2007</strong> Regular Lectures<br />
DETERMINATION OF PARAMETERS OF VISCOELASTIC MATERIALS<br />
BY INSTRUMENTED INDENTATION<br />
JAROSLAV MEN ÍK<br />
University of Pardubice, Jan Perner Transport Faculty,<br />
Studentská 95 532 10 Pardubice, Czech Republic<br />
jaroslav.mencik@upce.cz<br />
Keywords: viscoelastic material, instrumented indentation,<br />
rheological models<br />
1. Introduction<br />
Instrumented indentation, called also nanoindentation if<br />
very low loads are used, provides information about mechanical<br />
properties from indenter load and depth measured during<br />
loading and unloading (Fig. 1). Today, these methods are well<br />
established for elastic-plastic materials like metals or ceramics.<br />
They can also be used for characterisation of polymeric<br />
and other materials whose response to load depends also on<br />
time. However, specific features of their behaviour must be<br />
taken into account in the test preparation and data processing.<br />
The pertinent methods are still under development. This paper<br />
gives a brief review of basic formulae for instrumented indentation<br />
into elastic-plastic materials, then it explains the load<br />
response of viscoelastic materials and presents the pertinent<br />
formulae, with emphasis on indentation testing. Also, a practical<br />
test procedure is described.<br />
Fig. 1. Load-depth curves of an inde ntation test a schematic. P<br />
indenter load, h displacement (penetration), hc contact depth<br />
2. Basic formulae for indentation testing<br />
of elastic-plastic materials<br />
In instrumented indentation, hardness H is defined as the<br />
mean contact pressure, and calculated by dividing the indenter<br />
load P by the projected contact area A:<br />
s115<br />
H<br />
The contact area is calculated from contact depth hc,<br />
which is obtained from the total indenter displacement h,<br />
indenter load P and contact stiffness S = dP/dh at the beginning<br />
of unloading (Fig. 1), usually by the formula proposed<br />
by Oliver and Pharr 1 :<br />
h c<br />
P<br />
A<br />
where is a constant ( 0.75). The stiffness S is determined<br />
from the regression function, mostly of power-law type,<br />
P = c (h hres) m (3)<br />
fitted to the upper part of unloading curve; c, m and hres are<br />
regression constants (hres corresponds to the residual depth of<br />
imprint after unloading). For Berkovich indenter (a threesided<br />
pyramid often used in nanoindentation), the contact area<br />
is approximately A = 24.5 hc 2 ; more accurate results A(hc) are<br />
obtained by indenter tip calibration.<br />
Equation (2) has proved good for elastic materials, where<br />
the ratio of the depth of permanent imprint after unloading,<br />
hres, and the total depth under load, h, is less than 0.7. For<br />
more ductile materials, with hres/h > 0.7, however, Equation<br />
(2) gives lower values hc than actual. For these cases, Bec et<br />
al. 2 have recommended the relationship<br />
h c<br />
h<br />
P<br />
S<br />
a discussion to both approaches can be found in paper 3 .<br />
In addition to hardness, also the elastic modulus can be<br />
calculated from the contact stiffness and contact area:<br />
E<br />
r<br />
1,<br />
2<br />
h<br />
P<br />
S<br />
S<br />
A<br />
Er is the reduced modulus, related with the elastic modulus E<br />
and Poisson ratio of the specimen (no subscript) a indenter<br />
(subscript i) as<br />
1<br />
E<br />
r<br />
2<br />
1<br />
E<br />
2<br />
1<br />
E<br />
i<br />
2<br />
i<br />
is a correction for the indenter tip shape (for Berkovich<br />
indenter, 1.05).<br />
(1)<br />
(2)<br />
(4)<br />
(5)<br />
(6)
Chem. Listy 105, s115 s119 (2011) LMV <strong>2007</strong> Regular Lectures<br />
3. Theoretical background for testing<br />
of viscoelastic materials<br />
The response of some materials, such as polymers, is<br />
more complex, as it depends not only on the load magnitude,<br />
but also on its duration and time course. The indenter continues<br />
penetrating into the specimen even under constant load<br />
(part D of the curve in Fig. 2). Such materials are called viscoelastic<br />
or viscoelastic-plastic. In this case, hardness (1) is<br />
no more a constant, but decreases with the time under load,<br />
H = H(t).<br />
Fig. 2. Time course of a nanoindentation test into PMMA [4]; L<br />
loading, D dwell under constant load, U unloading<br />
Moreover, due to delayed deforming, also the unloading<br />
part of the P h curve is sometimes distorted (Fig. 3); it is<br />
more convex than in elastic materials, sometimes with a bulge<br />
or even a nose at the beginning of unloading. The determination<br />
of contact stiffness by a conventional manner from the<br />
slope of the unloading curve thus could lead to an error in the<br />
determination of contact stiffness S, and thus to an error in the<br />
contact depth and area, as well as in the elastic modulus and<br />
hardness. If the time-dependent effects are not negligible,<br />
a special approach is needed. This paper will deal with procedures<br />
for viscoelastic materials and monotonic loading and<br />
unloading. The determination of viscoelastic properties under<br />
harmonic loading can be found in Men ík et al. 4 . The characterisation<br />
of viscoelastic-plastic properties, typical by the<br />
occurrence of time-independent permanent deformations, will<br />
be the topic of another paper.<br />
The delayed deforming in indentation tests can be accounted<br />
for in various ways. In order to avoid the distorsion<br />
of unloading curve (Fig. 3), it is recommended to insert<br />
a dwell (with constant load) between the loading and unloading<br />
period. According to Chudoba and Richter 5 , the influence<br />
of delayed deforming on the unloading curve may be neglected<br />
if the creep velocity has decreased so that the penetration<br />
depth at the end of dwell grows not faster than 1% per<br />
minute. Some disadvantage of this approach is that the indenter<br />
depth at the beginning of unloading (after the dwell) is<br />
larger than at the end of loading, and this results in larger<br />
contact area and lower apparent hardness.<br />
Therefore, some authors recommend to use relatively<br />
fast loading followed immediately by fast unloading, and to<br />
calculate the contact depth and elastic modulus using the ef-<br />
s116<br />
Fig. 3. Load-depth diagram for elastic and viscoelastic (v.- el.)<br />
material; note the differences between unloading curves<br />
fective contact stiffness S, defined by the following expression<br />
proposed by Ngan and Tang 6 :<br />
1 1 hd<br />
S S P<br />
app u<br />
Sapp is the apparent stiffness, obtained by the common<br />
Oliver and Pharr procedure 1 from the unloading curve, is<br />
the indenter velocity at the end of dwell, and is the load<br />
decrease rate at the beginning of unloading (Fig. 3); the units<br />
are N/m, m/s and N/s, respectively.<br />
However, the results can also be influenced by viscoelastic<br />
deforming during the load increase phase. Moreover, it is<br />
generally insufficient to characterise materials that flow permanently<br />
under load, only by means of a single value of hardness<br />
or elastic modulus. The time-dependent properties must<br />
be described in a more appropriate way. Usually, rheological<br />
models consisting of springs and dashpots are used, such as<br />
the Kelvin or Maxwell model and their combinations (Fig. 4).<br />
The parameters in these models, suitable as material characteristics,<br />
can be obtained by fitting the time course of penetration<br />
depth by a suitable creep function, depending on the material,<br />
indenter shape and loading history.<br />
The commonly used formulae are based on the approach<br />
proposed by Lee and Radok 7 , which uses the elastic solution,<br />
but replaces the elastic constants by a viscoelastic hereditary<br />
integral operator; cf. Johnson 8 or Oyen 9 h d<br />
Pu<br />
.<br />
C0, E 0<br />
Fig. 4. Standard Linear Solid<br />
C 1, E1<br />
(7)
Chem. Listy 105, s115 s119 (2011) LMV <strong>2007</strong> Regular Lectures<br />
The relationship between indenter load and depth of<br />
penetration into an elastic or viscoelastic material under<br />
monotonic loading can be expressed generally as<br />
f [h(t)] = K (P, J, t) (8)<br />
where f is some function of the indenter shape and penetration,<br />
K is a constant characterising the indenter geometry, and<br />
(P, J, t) is a function depending on the load magnitude and<br />
history, on material parameters, and on time. For spherical<br />
indenter (subscript s),<br />
fS = h 3/2 ; KS = 3 / ( 8 r ) (9)<br />
r is the indenter tip radius. For pointed indenters (conical,<br />
Berkovich or Vickers, subscript c),<br />
fC = h 2 ; KC = / ( 4 tan ) (10)<br />
is the semiangle of indenter tip or of equivalent cone (for<br />
Berkovich and Vickers indenter, 70.4°). The function<br />
for penetration of a rigid indenter into ideally elastic materials<br />
is<br />
G is the shear modulus and is Poisson ratio. The general<br />
formula for linearly-viscoelastic materials (and a rigid indenter)<br />
is<br />
(t)<br />
P<br />
G<br />
1<br />
(11)<br />
(12)<br />
where J(t) is the so-called creep compliance function, depending<br />
on the material model used, t is time, and u is a dummy<br />
variable for integration. For constant load after step change<br />
from 0 to P, the function is simply the product of load and<br />
creep compliance function J(t),<br />
(t) = P J(t) (13)<br />
However, step load is impossible to realise; there is always<br />
some period of load increase. For ramp loading with constant<br />
load rate, R = dP/dt = const, it holds<br />
(t)<br />
J ( t<br />
u)<br />
[ dP du]<br />
du<br />
The penetration under constant load P following the ramp<br />
load lasting tR can be described by the function<br />
(<br />
t)<br />
t<br />
0<br />
t<br />
R J(<br />
t u)<br />
du<br />
0<br />
tR<br />
R J(<br />
t u)<br />
du<br />
0<br />
(14)<br />
(15)<br />
where tR is the duration of load increase. Formula (15), valid<br />
for t > tR, was obtained as the sum of two loads growing with<br />
the constant rate R: the first load starts at t = 0, while the<br />
other, acting in the opposite direction, starts at time tR. Thus,<br />
for t > tR, the load is constant, P = RtR.<br />
The application of the above formulae can be illustrated<br />
on a relatively universal model, consisting of a spring connected<br />
in series with a Kelvin-Voigt unit, which is a spring in<br />
parallel with a dashpot. For this model, called Standard Linear<br />
Solid (Fig. 4), the creep compliance function is<br />
J(t) = C0 + C1 [1 exp( t / 1)] (16)<br />
s117<br />
where C0 and C1 are compliance constants, and 1 is so-called<br />
retardation time. This is a time constant of the system, related<br />
to the compliance C1 of the spring and viscosity 1 of the<br />
dashpot in the Kelvin-Voigt body as 1 = 1C1. A more complex<br />
response can be approximated using more Kelvin-Voigt<br />
units in series,<br />
J(t) = C0 + Cj [1 exp( t / j)] (17)<br />
(j = 1, 2, n). The instantaneous compliances Cj (and C0) are<br />
related to the shear moduli Gj and Poisson ratios j by<br />
Cj = (1 j)/Gj (18)<br />
The springs can also be characterised by means of tensile<br />
moduli E, related to the shear moduli as<br />
Ej = 2(1 + j) Gj (19)<br />
However, only G0 and E0 correspond to the actual<br />
(instantaneous) elastic modulus of the material. The other<br />
constants C1, C2 just characterise delayed deforming. The<br />
moduli G1, G2 or E1, E2 do not represent additional<br />
stiffnesses, but reciprocals of additional, time- dependent<br />
compliances.<br />
Indentation creep under constant load P following ramp<br />
loading (with constant load rate) lasting tR = P/R, can be described<br />
by the function derived by Oyen 9 :<br />
(t) = P { C0 + C1 [1 1 exp( t / 1)]} (20)<br />
or, for a generalised standard linear solid (15),<br />
(21)<br />
(t) = P { C0 + Cj [1 j exp( t / j)]}<br />
In expressions (20) and (21), j is so-called ramp correction<br />
factor, calculated as 9<br />
j = ( j /tR) [exp(tR / j) 1] (22)<br />
Note that the formulae (20) and (21), valid for t tR,<br />
differ from those for step loading, based on Eqs. (16) and<br />
(17), only by the factors j at the exponential terms. For fast<br />
loading, with the load increase very short compared to the<br />
retardation time, tR « j, the ramp correction factor is close to<br />
1; it attains 1.025 for tR / j = 0.05 and 1.05 for tR/ j = 0.1, and<br />
grows rapidly for higher ratios tR / j.<br />
REMARK. Creep compliance function (17) can also be<br />
written in another form 9 :<br />
where<br />
J(t) = C0´ Cj exp( t / j) (23)<br />
C0´ = C0 + Cj (24)<br />
C0´ expresses the asymptotic compliance, corresponding to<br />
very long loading (t ), in contrast to C0, which characterises<br />
the instantaneous compliance, i.e. the immediate reaction<br />
to sudden loading. [The form (23) is usual in computer programs<br />
for the finite element analysis of viscoelastic response.]<br />
Similarly, Eq. (21) can be written as follows<br />
(t) = P [C0´ Cj j exp( t / j)] (25)<br />
In the limit case with j = 1, formulae (23) and (25) reduce to<br />
equations (16) and (20) for Standard Linear Solid.
Chem. Listy 105, s115 s119 (2011) LMV <strong>2007</strong> Regular Lectures<br />
4. Practical part<br />
A suitable procedure for the determination of material<br />
parameters is as follows. The indenter is loaded quickly (with<br />
the constant load rate R) to the nominal load P, then kept<br />
under this load for a relatively long time, and unloaded<br />
quickly. From the unloading curve, the contact stiffness can<br />
be determined, either directly as S = dP/dt if the indenter velocity<br />
at the end of dwell was negligible, or using correction<br />
(7). The contact area A, necessary for the determination of<br />
instantaneous elastic modulus E0 from the unloading curve via<br />
Eqs. (5) and (6), is calculated from the contact depth hc, determined<br />
by Eq. (2) from the depth h at the beginning of unloading.<br />
The dwell under constant load is used for the determination<br />
of constants in rheological (spring and dashpot) models.<br />
Depending on the model, the function (t), defined by<br />
Eq. (20) or (21), is inserted into (8), together with the function<br />
f and constant K, chosen from Eq. (9) or (10) with respect to<br />
the indenter shape. This function f[h(t)] is then used to fit the<br />
measured h(t) data.<br />
The constants C0, C1, 1, 1, etc. can be obtained by<br />
minimising the sum of squared differences between the measured<br />
and calculated h(t) values. A suitable tool for this purpose<br />
is Solver, available in some universal computer programs,<br />
such as Excel. However, the actual procedure must be<br />
modified for the following reason. The constants Cj appear in<br />
Eqs. (20), (21) and (25) only together with the constant j (as<br />
product Cj j), or together with the constant C0 (as C0´, cf.<br />
Eq. (24)). Thus, the regression fitting of experimental data can<br />
yield the correct values of Cj j and Cj´, while the individual<br />
values of constants Cj can be wrong. The constants Cj, however,<br />
are the genuine material parameters, independent of the<br />
loading history, and must be determined accurately. Their<br />
correct values can be obtained using a simple three-step data<br />
processing, based on the verified fact that the retardation<br />
times j can be determined correctly for any mathematical<br />
form of the model (25).<br />
In the first step of the procedure, the h(t) data obtained<br />
by indentation during the constant-load part of the test are<br />
fitted by the function (25), with all constants C0´, C1, 1, 1,<br />
etc. considered as free . In this way, the retardation times j<br />
are obtained. Then, the ramp correction factors j are calculated<br />
from Eq. (22) for these times j and the duration tR of the<br />
load increase. These values j are then inserted as fixed constants<br />
into Eq. (25) or (21), and the curve fitting, now searching<br />
for the remaining constants C0, C1, 1, etc. is done again.<br />
Computer modelling has shown that this procedure yields<br />
correct results.<br />
REMARK. Due to viscoelastic deformations, the indenter<br />
depth at the end of dwell is larger than at the end of<br />
load increase, so that also the contact area is larger. This can<br />
influence the calculated value of the constant C0. For this<br />
reason (and for a check), it is recommended to determine this<br />
constant (and elastic modulus E0) using also a separate test<br />
with fast loading followed immediately by unloading.<br />
From the compliances C0, C1, etc., it is also possible to<br />
calculate the values of G0, G1, etc. for the (chosen) value of<br />
Poisson ratio . In an ideal case, the instantaneous shear<br />
modulus G0 is related to the (instantaneous) tensile modulus<br />
s118<br />
E0 from the unloading curve as G0 = E0/[2(1+ )]. If the calculated<br />
parameters do not fulfil this condition, it is an indication<br />
that a correction is necessary, e.g. for the delayed deforming<br />
during the load increase period.<br />
When looking for a suitable model, one should be aware<br />
that very complex models, with more than about 6 7 regression<br />
constants, can sometimes cause problems in the search<br />
for their accurate values, and a compromise between the<br />
model complexity, accuracy and robustness may be necessary.<br />
A similarly good fit is sometimes obtained for various<br />
arrangements of springs and dashpots. The model complexity<br />
should also respect the amount of experimental data available,<br />
especially regarding the test duration. If the measurement<br />
lasts only several tens of seconds, it is impossible to obtain<br />
accurate information about the behaviour under a load lasting<br />
several hours or more.<br />
Finally, it should by reminded that Eqs. (16), (17), (20)<br />
and (21) are only valid for reversible viscoelastic deformations,<br />
which occur under a spherical indenter (sometimes even<br />
under pointed indenter 10 ) if sufficiently low load is used. For<br />
higher loads, also plastic deformations appear. The characterisation<br />
of viscoelastic-plastic materials with permanent deformations<br />
exceeds the scope of this paper and will be the topic<br />
of another work 11 .<br />
5. Summary<br />
Mechanical properties of viscoelastic materials with<br />
time-dependent response can be determined by instrumented<br />
indentation, which continuously measures indenter load and<br />
displacement. The paper has explained the principle of the<br />
method as used for elastic-plastic materials, gave the basic<br />
formulae for expressing the load response of visco-elastic<br />
materials by means of spring-and-dashpot models, and described<br />
a procedure for the indentation testing and the determination<br />
of material parameters.<br />
This work was supported by the grant Agency of Czech Republic,<br />
project GA R No. 103/05/2066.<br />
REFERENCES<br />
1. Oliver W. C., Pharr G. M.: J. Mater. Res. 7, 1564 (1992).<br />
2. Bec S., Tonck A., Georges J.-M., Georges E., Loubet J.<br />
L.: Philos. Mag., A 74, 1061 (1996).<br />
3. Fujisawa N., Swain M. V.: J. Mater. Res. 21, 708 (2006).<br />
4. Men ík J., Rauchs G., Bardon J., Riche A.: J. Mater. Res.<br />
20, 2660 (2005).<br />
5. Chudoba T., Richter F.: Surf. Coat. Technol. 148, 191<br />
(2001).<br />
6. Ngan A. H. W., Tang B.: J. Mater. Res. 17, 2604 (2002).<br />
7. Lee E. H., Radok J. R. M.: J. Appl. Mechanics 27, 438<br />
(1960).<br />
8. Johnson K. L.: Contact Mechanics. Cambridge University<br />
Press, Cambridge 1985.<br />
9. Oyen M. L.: Philosophical Magazine 86, 5625 (2006).<br />
10. Lu H., Wang B., Ma J., Huang G., Viswanathan H.: Mechanics<br />
of Time Dependent Materials 7, 189 (2003).<br />
11. Men ík J., He L. H., Swain M. V.: J. Mech. Behav. Biomed.<br />
2, 318 (<strong>2008</strong>).
Chem. Listy 105, s115 s119 (2011) LMV <strong>2007</strong> Regular Lectures<br />
J. Men ík (University of Pardubice, Jan Perner Transport<br />
Faculty, Pardubice, Czech Republic): Determination of<br />
Parameters of Viscoelastic Materials by Instrumented<br />
Indentation<br />
Deformation of viscoelastic materials depends on the<br />
load magnitude and history. Hardness is not constant, but<br />
decreases with the time under load. Universal description of<br />
the response is possible by means of rheological models consisting<br />
of springs and dashpots. The constants in these models<br />
can be obtained from the time course of penetration of an<br />
indenter loaded by constant force. In real tests it is also necessary<br />
to respect the period of the load increase to the nominal<br />
value, and to make a correction of the contact stiffness and<br />
area, determined from the unloading curve. The paper explains<br />
the principles of instrumented indentation, brings the<br />
formulae for indenter penetration into viscoelastic material<br />
under increasing and constant load, and describes a practical<br />
procedure for measurement and data processing.<br />
s119
Chem. Listy 105, s120 s122 (2011) LMV <strong>2007</strong> Regular Lectures<br />
LOCAL MICROMECHANICAL PROPERTIES OF CEMENT PASTES<br />
JI Í N ME EK<br />
Faculty of Civil Engineering, Czech Technical University in<br />
Prague, Thákurova 7, 166 29 Praha 6, Czech Republic<br />
jiri.nemecek@fsv.cvut.cz<br />
Key words: cement paste, C-S-H gel, nanoindentation, grid<br />
indentation, ESEM<br />
1. Introduction<br />
Cement is the widespread building material whose impact<br />
to the environment is enormous. Therefore, investigation<br />
of its behavior and proper numerical modelling on all scales is<br />
desirable. The overall behavior of any material is directly<br />
dependent on the microstructure and its individual phase<br />
properties. Modern constitutive models for composite materials<br />
try to respect this fact and link the overall material response<br />
with its micro-level. The development of various experimental<br />
techniques in the past decades made possible to<br />
access mechanical properties of various materials at submicron<br />
length scales. Nanoindentation plays an important role<br />
among them. This technique is based on the direct measurement<br />
of the load-displacement relationship. The depth of<br />
penetration starts from the level of nanometers. Although,<br />
nanoindentation was originally developed and used mainly for<br />
studying homogeneous materials like metals, coatings, films,<br />
glass, and crystal materials, the evolution of this method allows<br />
us to use it also for materials like concrete and other<br />
cementitious composites. The major studies can be found 1,2,6 .<br />
However, the interpretation of measured data is more complicated<br />
due to the large heterogeneity of cementitious composites.<br />
We will focus on cement paste (which is the base material<br />
of all cementitious composites) in the following.<br />
2. Testing strategies<br />
In contrast to usual indentation on metals, for example,<br />
cement paste is much more complex and also time-dependent<br />
material. From the microstructural point of view, cement<br />
paste is a heterogeneous material with several material<br />
phases. The most important are the hydrated phases (C-S-H<br />
gels that exist in two morphologies- high and low density 2 ,<br />
Portlandite, Ettringite and other minor phases), anhydrous<br />
phases (rest of clinker minerals) and porosity. Cementitious<br />
materials exhibit also significant creep that can affect evaluation<br />
of their elastic properties using standard procedures. This<br />
difficulty can be overcome by using long dwelling periods at<br />
the peak load. The material properties in this study are assessed<br />
for hydrated phases which occupy majority of the<br />
specimen volume.<br />
s120<br />
There are basically three testing strategies to assess micromechanical<br />
properties of individual phases in a heterogeneous<br />
material:<br />
A. Producing of large number (grid) of indents that are larger<br />
than the characteristic phase dimension with subsequent<br />
statistical evaluation of overall material properties of all<br />
affected phases that were indented (phase compound).<br />
B. Statistical indentation in which indents are produced over<br />
a large area but the dimension of a single indent is smaller<br />
than the characteristic dimension of individual phase.<br />
Subsequent deconvolution techniques can be employed<br />
for assessment of the individual phase properties 3,4 .<br />
C. Pointed indentation to a specific material phase with indent<br />
dimension smaller then the characteristic dimension<br />
of the tested phase. In this case, intrinsic properties of the<br />
phase (including intrinsic phase porosity) are obtained.<br />
In this study, all three aforementioned approaches have been<br />
used and elastic properties evaluated by Oliver and Pharr<br />
method 5 compared.<br />
3. Test samples<br />
Alite (tricalcium silicate) paste samples were prepared.<br />
Water to cement ratio was 0.4. Samples were cured in water<br />
in 20 °C for 5 month. High degree of hydration can be supposed<br />
for such matured sample. Than the sample was<br />
dried and polished to achieve flat surface with the roughness<br />
10 20 nm (RMS measured by AFM over 30×30 m<br />
area).<br />
4. Results<br />
For the first approach (A), a large grid of 100 indents<br />
was produced over the hydrated phases of cement paste. Indents<br />
lying in anhydrous phases were identified in ESEM and<br />
excluded from the study. The final depth of indents was<br />
around 700 nm (Fig. 1a) which yielded in the surface dimension<br />
around 4 m. Such indents dimension affects usually<br />
more than one material phase and thus causes a physical homogenization<br />
(averaging) of properties. Overall modulus of<br />
elasticity for all the affected phases (mainly C-S-H gels and<br />
Portlandite) was measured to be 23.3 ± 3.1 GPa.<br />
For the second approach (B), 400 small indents (around<br />
200 nm in depth, Fig. 1a) were produced with mutual distances<br />
5 m in between. The total area covered by indentation<br />
was 100×100 m. The dimensions of indents was chosen to<br />
be below the characteristic phase dimension and therefore<br />
measurement provided information on (i) heterogeneity of the<br />
material properties and (ii) characteristic (intrinsic) material<br />
properties over the studied area. Results of indentation moduli<br />
are presented in the form of histogram in Fig. 1b. Several<br />
peaks defining mean values of indentation modulus for distinct<br />
phases can be found in this histogram from which it
Chem. Listy 105, s120 s122 (2011) LMV <strong>2007</strong> Regular Lectures<br />
could be possible to deconvolute it 3,4 . Comparison of the morphology<br />
taken in ESEM and the map of moduli is shown in<br />
Fig. 2. Very good correlation of the data was achieved. Areas<br />
of hard clinkers and their surroundings created by HD C-S-H<br />
can be easily recognized.<br />
For the third approach (C), small indents similar to those<br />
used in (B) were pointed into one specific cement phase that<br />
is usually referred as high-density C-S-H gel 2 . This phase<br />
appears specifically around anhydrate clinker grains and it can<br />
be recognized in optics or in ESEM like a 5 10 m rim<br />
around (Fig. 3). This pointed indentation resulted in much<br />
narrower histogram (Fig. 1b) of indentation moduli. Such<br />
a fact proves the existence of a homogeneous-like material<br />
phase within the tested length scale. The indentation modulus<br />
of this phase was 38.6 ± 2.6 GPa.<br />
5. Summary<br />
It was proved that nanoindentation can be used for assessment<br />
of intrinsic phases properties of cement paste. The<br />
direct way of pointed indentation is possible only in some<br />
cases provided the phase can be easily distinguished in the<br />
microstructure. This was achieved for high-density C-S-H gel<br />
for which the elastic indentation modulus was assessed. If the<br />
a<br />
b<br />
Fig. 1. (a) Load-depth curve for large indent (a1: Pmax=10 mN)<br />
covering all hydrated phases of the cement paste and small indent<br />
(a2: Pmax=2 mN) with the size below the characteristic phase size.<br />
(b) Histogram of indentation moduli in GPa. (b1) Measurement<br />
over 100×100 m area, (b2) pointed indentation to HD C-S-H<br />
s121<br />
Fig. 2. Map of the indentation modulus placed over the ESEM<br />
image of the same area of cement paste<br />
direct measurement is not possible, statistical grid indentation<br />
can be used and individual phase properties can be deconvoluted<br />
from histogram plotted for all phases. Peaks in the histogram<br />
can be attributed to mean properties of individual material<br />
phases. For comparison, overall properties of the phase<br />
compound can be measured using grids with large indents.<br />
Fig. 3. ESEM image of pointed indentation around clinker grain<br />
to HD C-S-H (indents are circled)<br />
Support of the Czech Grant Agency (No. 103/06/1856) and<br />
Ministry of Education of the Czech Republic<br />
(MSM 6840770003) are gratefully acknowledged.<br />
REFERENCES<br />
1. Constantinides G., Ulm F. J., Van Vliet K.: Mater. Structures<br />
36, 191 (2003).<br />
2. Constantinides G., Ulm F. J.: Cem. Concr. Res. 34, 67<br />
(2004).<br />
3. Constantinides G., Ulm F. J.: J. Mech. Phys. Solids 55,<br />
64 (<strong>2007</strong>).<br />
4. Constantinides G., Chandran K. S. R., Ulm F. J., Van<br />
Vliet K. J.: Mater. Sci. Eng., A 430, 189 (2006).<br />
5. Oliver W. C., Pharr G. M.: J. Mater. Res. 7, 1564 (1992).<br />
6. Velez K., et al.: Cem. Concr. Res. 31, 555 (2001).
Chem. Listy 105, s120 s122 (2011) LMV <strong>2007</strong> Regular Lectures<br />
J. N me ek (Faculty of Civil Engineering, Czech Technical<br />
University in Prague, Czech Republic): Local Micromechanical<br />
Properties of Cement Pastes<br />
This paper focuses on experimental investigations of<br />
cement paste and its local elastic properties. The paper shows<br />
the complexity of cement microstructure and concerns on<br />
different approaches used for investigation of such heterogeneous<br />
material in submicron length scale. Three approaches<br />
are tested and results from nanoindentation and also ESEM<br />
are compared. Intrinsic material properties are assessed for<br />
high density C-S-H phase. Grid indentation with small indents<br />
is used for evaluation of properties for this and other phases.<br />
Overall elastic properties are measured for the whole hydrated<br />
compound using grid indentation with large indents.<br />
s122
Chem. Listy 105, s123 s124 (2011) LMV <strong>2007</strong> Regular Lectures<br />
DELAYED DEFORMATION RECOVERY AFTER NANOINDENTATION<br />
OF CEMENT PASTE<br />
JI Í N ME EK*<br />
and KATE INA FORSTOVÁ<br />
Faculty of Civil Engineering, Czech Technical University in<br />
Prague, Thákurova 7, 166 29 Praha 6,, Czech Republic<br />
jiri.nemecek@fsv.cvut.cz<br />
Keywords: nanoindentation, AFM, delayed recovery, cementitious<br />
materials, time dependence<br />
1. Introduction<br />
Hardened cement paste is a heterogeneous material.<br />
Several phases can be distinguished at its microlevel. Namely,<br />
we can find products of hydration (C-S-H gels, Portlandite<br />
and others), unhydrated clinkers and pores. All of them occur<br />
at micron and submicron length scale.<br />
Generally, we can distinguish between two types of deformations<br />
reversible (e.g. elastic deformation or temperature<br />
change) and irreversible (cracking, chemical shrinkage,<br />
other inelastic deformations). All these deformations can be<br />
observed and also measured at macrolevel but for all phases<br />
compound. Slightly different situation is at microscale where<br />
some deformations, for example cracking, can be easily detected<br />
(e.g. by ESEM). Also different material phases can<br />
behave very differently. For instance, viscous deformation<br />
can be attributed almost purely to hydrated phases (mainly<br />
C-S-H gels) while clinkers are mostly elastoplastic. Avoiding<br />
some discontinuities (cracking) we can split microlevel deformations<br />
to elastic part that is fully reversible, plastic part that<br />
is irreversible and causes permanent deformation in time and<br />
viscous deformation that is time dependent. The question is<br />
how to separate them from microscopic measurements.<br />
Overall microlevel deformations can be successfully<br />
measured by nanoindenter at its tip up to full load removal<br />
whereas deformations after unloading can be scanned with<br />
atomic force microscope (AFM) or other type of scanning<br />
probe microscope (SPM). Nanoindentation is the only experimental<br />
technique that enables direct measurement of mechanical<br />
response of individual material phases at submicron<br />
scale even for such heterogeneous system like cement paste 1 .<br />
In this process a very small tip is brought to the sample surface<br />
producing an imprint. Load versus depth of penetration<br />
diagram (Fig. 1) is measured through the whole loading, holding<br />
and unloading process. Loading and holding parts of the<br />
diagram contain elastic, plastic and viscous deformations<br />
whereas the unloading part is usually supposed to be elastic<br />
and elastic constants are extracted from this part using semianalytical<br />
elastic solutions 2 .<br />
On the other hand, SPM provides exact threedimensional<br />
morphological information of the material surface,<br />
(i.e. after indentation, possible fracture surfaces, cracks,<br />
s123<br />
etc.) and can be used to construct delayed recovery of the<br />
deformation.<br />
Separation of individual types of the deformation is<br />
a difficult task even at microlevel due to complicated stress<br />
states under indenter probe during loading. However one can<br />
utilize simplified stress state after full unloading. At this<br />
stage, the delayed deformation recovery (caused mainly by<br />
viscoelastic effects) takes place.<br />
2. Test samples and measurements<br />
Cement paste sample was prepared for this study from<br />
ordinary Portland cement CEM I 42.5 with water/cement<br />
ratio 0.4. The sample was cured in water for 34 days. Before<br />
nanoindentation the sample surface was polished to achieve<br />
a flat surface with maximum roughness 10 20 nm. For the<br />
sake of comparison, additional measurements were performed<br />
on fused silica copper and polyethylene samples.<br />
3. Methods<br />
Nanoindentation was used for performing a single imprint<br />
and the final penetration depth (at load release) was<br />
taken as a base (time 0) for subsequent considerations. SPM<br />
called in-situ imaging was used for surface scanning after<br />
the load removal (Fig. 2). In-situ imaging is a patented technology<br />
of Hysitron® that uses the same tip (Berkowich in our<br />
case) for indentation as well as for surface scanning. Indents<br />
were scanned several tens of minutes after the load removal.<br />
The evolution of maximum depth was monitored and evaluated<br />
in time. Results were normalized with respect to the base<br />
depth (at time 0) for comparison purposes. Also final penetration<br />
depth was kept similar for all materials (close to 100 nm)<br />
for comparisons except for polyethylene (around 500 nm)<br />
where a smaller penetration depth was difficult to achieve.<br />
4. Results<br />
Measurements proved the existence of the delayed recovery<br />
of the deformation on all samples. As expected, the<br />
smallest recovery (almost negligible) was observed on fused<br />
silica (Fig. 3). Cement sample evolved strongly in time and<br />
the deformation had descending (approximately logarithmic)<br />
trend. Similar behavior was found on copper, although the<br />
descent was less rapid and deformations stabilized relatively<br />
soon (Fig. 3). This could be attributed to the smaller viscous<br />
deformation of copper compared to cement paste. It can be<br />
supposed that the deformation approaches to the final plastic<br />
deformation that is irreversible and that was accumulated in<br />
the sample during the whole loading process. Polyethylene<br />
was found to have the largest delayed deformation recovery.<br />
It might be caused (i) by the viscous nature of the polyethyl-
Chem. Listy 105, s123 s124 (2011) LMV <strong>2007</strong> Regular Lectures<br />
Fig. 1. Load vs. depth diagram from nanoindentation on cement<br />
paste, fused silica, copper and polyethylene<br />
ene itself and (ii) by the higher force (and corresponding<br />
stress) used for its loading.<br />
5. Summary<br />
The delayed recovery of the deformation after load removal<br />
was studied on four materials. It appears that fused<br />
silica shows a very little change in deformation and can be<br />
considered as almost non-viscous material. In contrast, cement<br />
and copper exhibit viscous behavior. For copper, the<br />
a<br />
b<br />
Fig. 2. SPM image of the imprint in time = 146 s (a) and in<br />
time = 4772 s after load removal (b) measured on cement sample<br />
s124<br />
Fig. 3. Comparison of the delayed deformation recovery for fused<br />
silica, copper, cement paste and polyethylene after load removal<br />
recovery was smaller and is in the order of minutes to an hour<br />
for the given load level. However, for cement sample the<br />
evolution of the deformation does not approach to the final<br />
value at this time period. This finding points out the higher<br />
viscosity of this material. Polyethylene sample was also studied<br />
and its behaviour was found to have similar trend like for<br />
cement paste but the deformations were more pronounced.<br />
This study is a first step to the further research on cement<br />
samples that will lead towards separation of the viscous and<br />
plastic deformations and extraction of relevant parameters of<br />
constitutive models.<br />
Support of the Czech Grant Agency (No. 103/06/1856) and<br />
Ministry of Education of the Czech Republic (MSM<br />
6840770003) are gratefully acknowledged.<br />
REFERENCES<br />
1. Constantinides G., Ulm F. J.: Mater. Structures 36, 191<br />
(2003).<br />
2. Oliver W. C., Pharr G. M.: J. Mater. Res. 7, 1564 (1992).<br />
J. N me ek and K. Forstová (Faculty of Civil Engineering,<br />
Czech Technical University in Prague, Czech Republic):<br />
Delayed Deformation Recovery After Nanoindentation of<br />
Cement Paste<br />
In this study, the delayed recovery of the deformation<br />
after unloading of indented cement paste was investigated.<br />
Comparison with different types of materials (fused silica,<br />
copper and polyethylene) was also performed. The aim of the<br />
work was to determine how the material deforms after the<br />
load release as a stepping stone for separation of viscous and<br />
plastic parts of the deformation. Such knowledge is very important<br />
for further modeling of nanoindentation and for accessing<br />
of inelastic material properties at cement microlevel.
Chem. Listy 105, s125 s128 (2011) LMV <strong>2007</strong> Regular Lectures<br />
WOOD SURFACE MODIFICATION BY DIELECTRIC BARRIER DISCHARGES<br />
AT ATMOSPHERIC PRESSURE<br />
JOZEF RÁHE a *, PAVEL S AHEL b ,<br />
and MÁRIA ODRÁ KOVÁ a<br />
a Univerzita Komenského, Mlynská dolina F2, 842 48 Bratislava,<br />
Slovak Republic, b Masarykova Univerzita, Kotlá ská 2,<br />
611 37 <strong>Brno</strong>, Czech Republic<br />
rahel@gimmel.ip.fmph.uniba.sk<br />
Keywords: dielectric barrier discharges, wood, activation,<br />
deposition, surface energy<br />
1. Introduction<br />
Like other biological materials, wood is susceptible to<br />
environmental degradation 1 . Interaction of wood with water<br />
can lead to dimensional instability and accelerated bio as well<br />
as weathering degradation. Because of this, the surface of<br />
wood has to be protected to prolong its durability. Majority of<br />
paint and wood adhesives are water based. Water wetting is<br />
an important parameter for bond formation. In general wood<br />
exhibited a good wettability by water, nevertheless some<br />
woods of high lignin content (like oak) are hard to wet.<br />
A chemical treatment of the wood surface that promotes better<br />
wettability or provides new bonding sites, should improve<br />
adhesive bond performance. The same effect can be achieved<br />
using the plasma treatment. Majority of tests have been performed<br />
at low pressure, however these processes are very cost<br />
consuming 2 . This constraint can be overcome by the treatment<br />
of plasma generated at atmospheric pressure 3 , which effect on<br />
improving the wetting and adhesion properties of various<br />
polymer materials have been extensively studied for last<br />
10 years. The surface activation was carried out using coplanar<br />
barrier discharge 5 in the ambient air to obtain wettable<br />
surface suitable for easy painting. Our results in activating the<br />
hydrophobic oak surface will be presented in this paper.<br />
By choosing a suitable composition of discharge gas, the<br />
hydrophobic surface properties of wood can be obtained too 4 .<br />
In presented study, plasma assisted deposition of hydrophobic<br />
coatings was performed directly on the surface of poplar veneer<br />
by surface barrier discharges at atmospheric pressure<br />
from the mixture of nitrogen containing HMDSO vapors. We<br />
will present these results as well.<br />
2. Experimental<br />
For hydrophobization study the samples of poplar veneer<br />
with dimension 700 130 0.5 mm were used. The sample<br />
surface was sanded by sandpaper of 150-grit.<br />
Plasma activation study (creating a hydrophilic surface)<br />
was performed on oak heartwood samples with the dimensions<br />
of 50 15 5 mm. The oak was chosen because of its<br />
s125<br />
known low surface energy (36.1 mJ m 2 ) resulting in poor<br />
water wettability.<br />
The deposition of thin hydrophobic layer was carried out<br />
by surface barrier discharge (SBD) at atmospheric pressure 6 .<br />
The surface discharge was created on the surface of the mica<br />
dielectric plate, fully covered with metal electrode on one<br />
side. The opposite side of the mica plate was in contact with<br />
metal electrode consisting of 11 connected rotating rods of<br />
9 mm. The rods were 10 cm long. The whole arrangement<br />
was placed in deposition chamber. The SBD electrodes were<br />
energized by 5 kHz sinusoidal high voltage generator<br />
LIFETECH VF 700. The poplar veneer strip was drawn with<br />
controlled speed through the chamber between the metal electrodes<br />
and the dielectric mica plate. The discharge appeared<br />
along the substrate surface in the decreasing initial electric<br />
field from the side of the rod metal electrodes. The surface<br />
power density was kept at 1.1 W cm 2 in all cases. Configuration<br />
of the reactor is shown in Fig. 1.<br />
The layers were deposited from mixture of nitrogen with<br />
different amount of hexamethyldisiloxane (HMDSO) vapors.<br />
The flow rate of nitrogen was kept at 6 l min 1 in this study<br />
and the HMDSO flow rate varied between 0.06 and 0.4 g min 1<br />
in order to optimize the coating properties. Plasma activation<br />
of wooden samples was done by the coplanar surface barrier<br />
Fig. 1. Scheme of deposition reactor based on Surface Barrier<br />
Discharge<br />
Fig. 2. Scheme of the reactor based on Coplanar Surface Barrier<br />
Discharge
Chem. Listy 105, s125 s128 (2011) LMV <strong>2007</strong> Regular Lectures<br />
discharge 5 . The coplanar surface barrier discharge electrodes<br />
consisting of 15 pairs of silver strip electrode embedded<br />
0.5 mm below the surface of 96 % Al2O3 ceramics were energized<br />
by 14 kHz sinusoidal voltage, supplied by HV generator<br />
LIFETECH VF 700. The mutual distance of the 200 mm long<br />
and 2 mm wide silver strip electrodes was 1 mm. The electrode<br />
system was mounted inside the closed reactor chamber<br />
equipped with a moving sample holder (Fig. 2).<br />
The surface of oak samples was sanded by sandpaper of<br />
150-grit before the surface energy measurement and by 100grit<br />
before the water uptake time measurement. Wood samples<br />
were mounted to the moving sample holder and conveyed<br />
to the intimate contact with the plasma generated above<br />
the ceramics surface. Plasma activation was done in ambient<br />
air with an average plasma power density 2.2 W cm 2 and<br />
exposure time of 5 s. The wood moisture content was within<br />
the range of 7 8 % in all cases.<br />
The surface properties of plasma treated and untreated<br />
wooden samples were investigated by means of the sessile<br />
drop technique using the Surface Energy Evaluation<br />
System (SEE System, http://www.seesystems.wz.cz). The<br />
contact angles were measured directly from the images of the<br />
solid/liquid meniscus of a liquid drop set on a solid surface<br />
taken with CCD camera. The value of wood total surface free<br />
energy s and its disperse s d and polar s p components was<br />
calculated by means of Owens-Wendt method 6 expressed as:<br />
were is the contact angle of the test liquid with the sample,<br />
L is total surface energy of the test liquid, L d is dispersion<br />
component and L p is polar component of the testing liquid.<br />
S p and S d are dispersive and polar components of the surface<br />
energy of the tested sample. In the case of characterization of<br />
hydrophobic coatings deposited in SBD the contact angle was<br />
measured with following testing liquids: water, glycerol, ethylene<br />
glycol, formamide, diiodomethane, -bromonaphtalene.<br />
In the case of characterization of plasma activated samples the<br />
contact angle was measured with water, diiodomethane and<br />
-bromonaphtalene. Water is a representative of polar liquid,<br />
diiodomethane and -bromonaphtalene are non-polar testing<br />
liquids. Two combinations of water + diiodomethane and<br />
water + -bromonaphtalene were used as a test liquid pairs for<br />
evaluation of surface free energy of activated samples using<br />
Owens-Wendt method.<br />
The water uptake time was measured as the time from<br />
the impact of the droplet to its complete penetration into the<br />
wood surface (no optical reflection can be seen). For this test<br />
one half of each wooden sample surface was activated by<br />
plasma while the second half was left untreated. The water<br />
droplet of 50 l was put on the plasma activated part of sample<br />
and second one on untreated part of oak surface. According<br />
to the method described 7 the uptake time was evaluated<br />
for 15 oak samples.<br />
3. Results<br />
d d p p<br />
1 cos L 2<br />
L S L S<br />
Highly hydrophobic thin layers were deposited on the<br />
s126<br />
Fig. 3. Water droplet on the surface untreated poplar veneer<br />
poplar veneer surface in order to protect it against water penetration.<br />
Organosilicon monomer (HMDSO) mixed with nitrogen<br />
was used as a working gas during the plasma deposition<br />
to create protective hydrophobic layer. Water droplet on untreated<br />
poplar veneer surface is shown in Fig. 3. After the<br />
plasma deposition the contact angle increased from 63° to<br />
120° which proves the hydrophobic nature of deposited layer<br />
(see Fig. 4). The concentration of monomer and also deposition<br />
time were varied to obtain optimal deposition conditions<br />
and also surface properties. Fig. 5 shows the total surface free<br />
energy as a function flow rate of HMDSO. Total surface free<br />
energy exponentially decreases with increasing monomer<br />
flow rate. The most hydrophobic layer were deposited when<br />
the deposition time was 120 s. Fig. 6 shows the total surface<br />
energy and its polar and dispersion part as a function flow rate<br />
of HMDSO. In this case the deposition time was 42 s. The<br />
dispersion component quickly decreases with the increasing<br />
flow rates HMDSO, however polar part remains almost constant.<br />
Similar behavior was obtained also for samples with<br />
different deposition times.<br />
The results of plasma activated oak surfaces are summarized<br />
in Tab. I. The value of total free surface energy increased<br />
from 40 to 74 mJ m 2 , mainly due to the rise of its<br />
polar component. The results of water uptake time measurement<br />
are shown in Tab. II.<br />
The uptake time reduced from 675.8 to 61.5 s after the<br />
plasma treatment, the mean relative reduction of uptake time<br />
was 88 ± 7 %. Our result is in the same order of magnitude as<br />
those declared 7 . Fig. 7 shows a plane view of the treated (left<br />
sample) and untreated (right sample) oak samples 10 s after<br />
the dropping of water droplet on sample surface. Water wets<br />
Fig. 4. Water droplet on the poplar veneer after coating
Chem. Listy 105, s125 s128 (2011) LMV <strong>2007</strong> Regular Lectures<br />
Surface energy [mJ/m 2 ]<br />
40<br />
38<br />
36<br />
34<br />
32<br />
30<br />
28<br />
26<br />
24<br />
22<br />
20<br />
18<br />
16<br />
14<br />
12<br />
10<br />
8<br />
6<br />
original sample<br />
120s<br />
42s<br />
90s<br />
30s<br />
0,0 0,1 0,2 0,3 0,4<br />
HMDSO Flow rate [g/min]<br />
Fig. 5. Total surface free energy as a function of HMDSO flow<br />
rate. Flow rate of nitrogen 6 l min 1 was kept constant in all cases<br />
Total surface energy [mJ/m 2 ]<br />
38<br />
36<br />
34<br />
32<br />
30<br />
28<br />
26<br />
24<br />
22<br />
20<br />
18<br />
16<br />
14<br />
12<br />
10<br />
8<br />
6<br />
4<br />
2<br />
0<br />
0,0 0,1 0,2 0,3 0,4<br />
HMDSO flow rate (g/min)<br />
Total surface energy<br />
dispersive component<br />
polar component<br />
Fig. 6. Total surface free energy tot and its dispersive d and polar<br />
p parts a function of HMDSO flow rate. Flow rate of nitrogen<br />
6 l min 1 was kept constant in all cases<br />
Fig. 7. Plane view on plasma treated (left) and untreated (right)<br />
oak samples 10 s after placing 50 l water droplet on the surface<br />
s127<br />
Table I<br />
Total surface free energy tot and its dispersive d and polar p<br />
parts of oak surface (in radial section) before and after the<br />
plasma treatment<br />
Testing<br />
liquid<br />
Water<br />
and diiodomethane<br />
Water and -<br />
bromonaphtalene<br />
[mJ m 2 ] original activation original activation<br />
tot 40.71 74.26 42.36 73.80<br />
d 39.56 45.40 41.40 44.43<br />
p 1.15 28.26 0.96 29.37<br />
Table II<br />
Water uptake time of plasma activated (TA) and untreated (T0)<br />
oak in radial section<br />
Untreated<br />
oak T0 [s]<br />
Treated oak<br />
TA [s]<br />
(1 TA /T0)100 %<br />
[%]<br />
1 317 56 82<br />
2 1850 90 95<br />
3 606 45 93<br />
4 231 42 82<br />
5 949 75 92<br />
6 379 61 84<br />
7 1072 90 92<br />
8 1190 41 97<br />
9 154 45 70<br />
10 1421 61 96<br />
11 1078 84 92<br />
12 333 54 84<br />
13 463 68 85<br />
14 443 47 89<br />
15 501 65 87<br />
Mean 732.6 61.5 88 ± 7<br />
preferentially in direction of the surface capillaries.<br />
Comparing the energy consumption 7 , system based on<br />
volume barrier discharge needs 0.1 kWh m 2 , however system<br />
based on DCSBD, needed only about 0.03 kWh m 2 of wood<br />
surface. The system based on DCSBD offers a considerably<br />
better efficiency. Moreover the plasma treatment in DCSBD<br />
is completely independent on the thickness and electrical<br />
conductivity of the treated wood material.<br />
Highly hydrophobic plasma polymer coatings were deposited<br />
on the wood substrate in surface barrier discharge<br />
from the mixture of HMDSO monomer with nitrogen. The<br />
total surface free energy of sample decreased from 37 mJ m 2<br />
before coating wood to about 12 17 mJ m 2 (after the plasma<br />
deposition).<br />
The plasma activation of wooden surfaces in diffuse<br />
surface barrier discharge was tested. The total surface energy<br />
increased from 40 to 74 mJ m 2 after plasma treatment.
Chem. Listy 105, s125 s128 (2011) LMV <strong>2007</strong> Regular Lectures<br />
The plasma activation of wood in DCSBD promotes<br />
a better adhesion and efficiency then competitive systems.<br />
This research has been supported by Ministry of Education,<br />
Youths and Sports of the Czech Republic under project<br />
MSM0021622411 and by Academy of Science of the Czech<br />
Republic by KAN101630651.<br />
REFERENCES<br />
1. Denes A. R., Young R. A.: Holzforschung 53, 632<br />
(1999).<br />
2. Denes A. R., Tshabala M. A., Rowell R., Denes F.,<br />
Young R. A.: Holzforschung 53, 318 (1999).<br />
3. Podgorsky L., Bousta C., Schambourg F., Maguine J.,<br />
Chevet B: Pigm. Resin Tech. 31, 33 (2001).<br />
4. Bente N., Avramidis G., Forster S., Rohwer E. G., Viol<br />
W.: Holz als roh-und werkstoff 62, 157 (2004).<br />
5. Simor M., Rahel J., Vojtek P., Cernak M.: Appl. Phys.<br />
Lett. 81, 2716 (2002).<br />
6. Rehn P., Wolkenhauer A., Bente M., Forster S., Viol W.:<br />
Surf. Coat. Technol. 174, 515 (2003).<br />
s128<br />
7. Bursikova V., Stahel P., Navratil Z., Bursik J., Janca J.:<br />
Surface energy evaluation of plasma treated materials by<br />
contact angle measurement. Masaryk University, <strong>Brno</strong><br />
2004.<br />
J. Ráhe a , P. S ahel b , and M. Odrá ková a<br />
( a Univerzita Komenského, Bratislava, Slovak Republic;<br />
b Masarykova Univerzita, <strong>Brno</strong>, Czech Republic): Wood Surface<br />
Modification by Dielectric Barrier Discharges at Atmospheric<br />
Pressure<br />
The effect of plasma treatment at atmospheric pressure<br />
on surface properties of wooden samples is investigated in<br />
this work. Plasma activation of wooden surface was studied in<br />
diffuse coplanar surface barrier discharge created in air to<br />
obtain wettable surface. Plasma deposition of hydrophobic<br />
coatings directly on the surface of wooden materials using<br />
surface barrier discharge created in pure nitrogen with small<br />
admixture of hexamethyldisiloxane was investigated too.<br />
Surface properties of plasma treated wooden samples were<br />
studied using the sessile droplet technique to identify surface<br />
free energy of treated and untreated samples.
Chem. Listy 105, s129 s131 (2011) LMV <strong>2007</strong> Regular Lectures<br />
DEPOSITION AND CHARACTERIZATION OF THIN HYDROPHOBIC LAYERS<br />
USING ATMOSPHERIC-PRESSURE SURFACE BARRIER DISCHARGE<br />
PAVEL S AHEL*, VILMA BUR ÍKOVÁ,<br />
JAN ECH, ZDEN K NAVRÁTIL, and<br />
PETR KLOC<br />
Masarykova Univerzita, Kotlá ská 2, 611 37 <strong>Brno</strong>, Czech<br />
Republic<br />
pstahel@physics.muni.cz<br />
Keywords: surface barrier discharge, hydrophobic layers<br />
1. Introduction<br />
The plasma technologies became very promising technique<br />
for surface engineering of solids. The wide spread lowpressure<br />
plasma applications 1 7 have to use expensive vacuum<br />
systems. That approach requires batch processing and inhibits<br />
the application of low-pressure plasma in larger industrial<br />
scale for treatment of low-cost materials, where in-line treatment<br />
of materials is necessary.<br />
Several advantages of the surface modification of lowcost<br />
materials provide atmospheric-pressure plasma processing.<br />
The most significant advantages are: the expensive vacuum<br />
system is not necessary, processing times are reduced,<br />
and the scalability of plasma applications towards largesurface<br />
processing is simpler than in low-pressure plasma<br />
applications.<br />
Recently, mainly atmospheric-pressure corona discharge<br />
or volume barrier discharge (VBD) devices are used for surface<br />
treatment of polymeric materials. In the case of VBD the<br />
requested plasma conditions are achieved only in smallvolume<br />
plasma channels streamers developing perpendicularly<br />
to the surface of material. In that case the plasma is<br />
in a very limited contact with the surface resulting in low<br />
processing speeds, typically in the order of 1 m min 1 . Moreover,<br />
the localized arcing may result in the formation of pinholes<br />
in the material being treated. The using of atmosphericpressure<br />
glow discharge (APGD) can surpass these disadvantages,<br />
however APGD is very sensitive to gas purity and optimization<br />
of electrode arrangement. These facts limit the applicability<br />
of APGD 8 .<br />
In this work the surface barrier discharge operated at<br />
atmospheric pressure was used for deposition of thin protective<br />
hydrophobic films on paper substrates.<br />
This work has to demonstrate good protective properties<br />
of the films deposited by means of this technique. Variation<br />
of colorimetric parameters of paper substrates such as whiteness<br />
or yellowness caused by plasma deposition and the evolution<br />
of these parameters under intensive UV irradiation is<br />
shown too.<br />
s129<br />
2. Experimental<br />
The fluorinated (Teflon-like) materials are widely used<br />
for their low surface energy and low wettability. As precursor<br />
for thin film deposition the octafluorcyclobutane C4F8 was<br />
used. The CF4 (ref. 7 ) or fluortrimethylsilane 8 are reported in<br />
the literature as precursors too. The surface barrier discharge<br />
at atmospheric pressure was used for the deposition process.<br />
The discharge was ignited on the surface of the insulating<br />
mica plate, which was fully covered with metal electrode<br />
from one side, while the opposite side of the plate was covered<br />
with moving paper sample pressed to mica with rod electrode.<br />
The rod electrode consists of nine 100 mm long rotating<br />
rods, connected together with 9 mm spacing 9 . Between<br />
each two rods of the electrode two gas inlets were placed. The<br />
whole arrangement was placed into deposition chamber. The<br />
paper strips were carried through the discharge chamber with<br />
controlled speed. The surface power density was set within<br />
the range 0 to 1.0 W cm 2 . In this study the deposition time<br />
90 s was kept constant as well as the concentration of C4F8 in<br />
nitrogen, i.e. 0.5 slpm of C4F8 in 10 slpm of pure nitrogen. As<br />
a substrate the filter paper was used. The discharge was studied<br />
by means of the optical emission spectroscopy. The discharge<br />
spectra were recorded using the Jobin-Yvon TRIAX<br />
550 monochromator, equipped with the liquid nitrogen cooled<br />
CCD detector. The total surface free energy of samples TOT<br />
and its components LW , AB , + , were investigated by<br />
means of the sessile drop technique using the Surface Energy<br />
Evaluation System (http://www.advex-instruments.cz/). The<br />
contact angles were measured directly from the CCD camera<br />
images of the solid/liquid meniscus of a sessile drop set on<br />
a solid surface. The samples surface free energy and its components<br />
were calculated according to Lifshitz-Van der Waals/<br />
acid base approach reported in 10 . UV irradiation degradation<br />
tests were performed in device equipped by high-pressure Hg<br />
lamp with 40 mW cm 2 . The temperature of samples during<br />
degradation tests was kept constant (40 °C). The wetting<br />
properties were studied by means of industrial grade permeability<br />
tests consistent with the ISO 9073-8:1995 standard.<br />
Chemical composition of deposited films was investigated by<br />
means of infrared spectroscopy.<br />
3. Results<br />
In the past we have reported on the formation of hydrophobic<br />
protective films on paper surfaces to make it resistant<br />
against water penetration 11 .<br />
A typical spectrum of the discharge created in mixture of<br />
nitrogen and C4F8 is shown in Fig. 1.<br />
The spectrum is plotted in the range 300 500 nm, because<br />
above 500 nm only the second spectral order was registered.<br />
The spectra consist of the molecular bands of second<br />
positive system of nitrogen (C 3<br />
u B 3<br />
g). In case of octafluorbutane<br />
admixture intensive bands of CN violet system
Chem. Listy 105, s129 s131 (2011) LMV <strong>2007</strong> Regular Lectures<br />
I [a.u.]<br />
2 ) at 388 nm and 422 nm were observed. The vibrational<br />
temperature was calculated from the bands of second<br />
positive system of nitrogen ( = 2, heads 0 2, 1 3 and 2 4).<br />
The vibrational temperature varied only slightly with discharge<br />
power density variation and its estimated value was at<br />
about 2100 K in all cases. Fig. 2 shows dependencies of the<br />
whiteness W and yellowness Ye of samples in their asdeposited<br />
state as a function of the discharge power density.<br />
Solid lines are used as a guide of eyes. Yellowness of the<br />
sample increases and whiteness decreases with increasing<br />
discharge power density. Sample colour slightly changes,<br />
however changes are caused no only by creation of film on<br />
the surface but also by thermal and UV degradation of substrate<br />
during the deposition process. The electrodes were<br />
heated by the discharge and were not cooled with any external<br />
cooling system. The electrode temperature was different for<br />
different power densities at higher power density the temperature<br />
of electrode was higher.<br />
( 2<br />
60000<br />
50000<br />
40000<br />
30000<br />
20000<br />
10000<br />
0<br />
N 2 0-0<br />
N 2 1-2<br />
N 2 0-1<br />
N 2 1-3<br />
N 2<br />
2-4<br />
N 2 0-2<br />
CN N<br />
2<br />
0-0 2-5<br />
N 2<br />
1-4<br />
N 2 0-3<br />
340 360 380 400 420<br />
N<br />
2<br />
1-5<br />
N<br />
2<br />
0-4<br />
Fig. 1. Emission spectrum of the surface discharge created in<br />
nitrogen with admixture of C4F8<br />
W,Ye<br />
90<br />
80<br />
70<br />
60<br />
8<br />
6<br />
4<br />
2<br />
0<br />
0.0 0.1 0.2 0.3 0.4 0.5 0.6 0.7<br />
Power density (W/cm 2 )<br />
W<br />
Ye<br />
Fig. 2. Dependence of the whiteness W and yellowness Ye of as<br />
deposited samples on the power density. Solid lines represent<br />
exponential decrease fit<br />
s130<br />
Surface energy (mJ/m 2 )<br />
100<br />
50<br />
0<br />
0,20 0,25 0,30 0,35 0,40 0,45 0,50 0,55 0,60 0,65<br />
In Fig. 3 the dependence of total surface energy TOT and<br />
its components LW , AB , + , is plotted as a function of<br />
power density. Samples deposited at higher power density<br />
then 0.35 W cm 2 show similar surface hydrophobic properties,<br />
however samples deposited at lower power density exhibit<br />
high surface energy.<br />
In these cases surface properties are more in virtue of<br />
plasma treatment than deposition of teflon-like surface layer.<br />
The untreated sample is shown as reference and it is<br />
rather different then samples after thin film deposition i.e.<br />
surface of the untreated sample and sample deposited at the<br />
lowest power density is polar, however surface of coated sample<br />
is non-polar.<br />
In Fig. 4 the variation of colorimetric parameters under<br />
UV irradiation is shown. For degradation test we used high<br />
pressure Hg lamp with 40 mW cm 2 . Whiteness of uncoated<br />
samples strongly decreases with increasing UV irradiation<br />
time. Samples coated with Teflon-like film exhibit significantly<br />
lower degradation than uncoated sample. Samples deposited<br />
at lower power densities exhibit less protective properties<br />
than samples deposited at higher power densities. Yellowness<br />
Ye shows also similar behavior.<br />
4. Conclusion<br />
Power density (W/cm 2 )<br />
tot<br />
bas<br />
acid<br />
LW<br />
AB<br />
Fig. 3. Dependence of total surface energy TOT and its components<br />
LW , AB , + , plotted as a function of power density<br />
Thin films of highly hydrophobic properties were prepared<br />
by means of atmospheric-pressure surface barrier discharge<br />
deposition technique. The films were prepared using<br />
different power densities from the mixture of octafluorcyclobutane<br />
C4F8 with nitrogen.<br />
The colorimetric parameters as whiteness and yellowness<br />
of samples in their as-deposited and UV irradiated states<br />
were studied. The coated samples exhibited considerably<br />
higher UV irradiation resistance than the uncoated ones. It is<br />
possible to use similar type of films as hydrophobic, transparent<br />
and highly effective UV irradiation protective coating on<br />
different kind of solids.
Chem. Listy 105, s129 s131 (2011) LMV <strong>2007</strong> Regular Lectures<br />
Whiteness W<br />
85<br />
80<br />
75<br />
70<br />
65<br />
60<br />
55<br />
50<br />
45<br />
40<br />
35<br />
0.615W/cm 2<br />
0.52W/cm 2<br />
0.39W/cm 2<br />
0.3W/cm 2<br />
0.236W/cm 2<br />
0.064W/cm 2<br />
uncoated<br />
0 10 20 30 40 50 60<br />
Aging time (h)<br />
Fig. 4. Aging effect of samples under UV irradiation. Samples<br />
were deposited at different discharge power densities<br />
This research has been supported by Ministry of Education,<br />
Youths and Sports of the Czech Republic under project<br />
MSM0021622411 and the Grant Agency of the Academy of<br />
Sciences of the CR under project KAN 101 63 0651.<br />
REFERENCES<br />
1. Denes A. R., Young R. A.: Holzforschung 53, 632<br />
(1999).<br />
2. Hua Z. Q., Sitaru R., Denes F., Young R. A.: Plasmas<br />
and Polymers 2, 196 (1998).<br />
3. Behnisch J.: Plasma Processing of Polymers, In: R. d'Agostino,<br />
P. Favia, F. Fracassi (ed.), Plasma Processing of<br />
Polymers, NATO ASI Series. 346, 345 (1996).<br />
4. Mahlberg R., Niemi H. E. M., Denes F., Rowell R. M.:<br />
Int. J. Adhesion 62 Adhesives 18, 283 (1998).<br />
s131<br />
5. Sahin H. T., Monolache S., Young R. A., Denes F.: Cellulose<br />
9, 171 (2002).<br />
6. Navarro F., Davalos F., Denes F., Cruz L. E., Young R.<br />
A., Ramos J.: Cellulose 10, 411 (2003).<br />
7. Belgacem M. N., Blayo A., Gandini A.: J. Colloid Interface<br />
Sci. 182, 431 (1996).<br />
8. Prat R., Koh Y. J., Babukutty Y., Kogoma M., Osakazaki<br />
S., Kodama M.: Polymer 41, 7355 (2000).<br />
9. Sahel P., Bur íková V., íra M., Navrátil Z., Kloc P.,<br />
Jan a J.: J. Adv. Oxid. Technol. 2, 228 (2006).<br />
10. Good R. J.: Contact Angle, Wettability and Adhesion (K.<br />
L. Mittal, ed.). 3 (1993).<br />
11. Bur íková V., S ahel P., Jan a J.: Czech. J. Phys. 52,<br />
D866 (2002).<br />
P. S ahel, V. Bur íková, J. ech, Z. Navrátil, and<br />
P. Kloc (Masarykova Univerzita, <strong>Brno</strong>, Czech Republic):<br />
Deposition and Characterization of Thin Hydrophobic<br />
Layers Using Atmospheric-Pressure Surface Barrier Discharge<br />
The modern technologies often require modification of<br />
solid material surfaces with keeping desired bulk properties.<br />
To control the surface properties of solids the atmosphericpressure<br />
plasma can be very useful. In this work the thin hydrophobic<br />
protective films were deposited on the paper surface<br />
using atmospheric-pressure surface barrier discharge.<br />
Films were deposited from the mixture of the nitrogen with<br />
C4F8. The plasma properties were investigated by means of<br />
optical emission spectroscopy. The properties of samples<br />
were investigated by means of colorimetric measurements<br />
such as whiteness, yellowness or brightness tests. The surface<br />
energy of the thin films was investigated by means of contact<br />
angle measurements. The sample properties were measured in<br />
as-deposited state and in UV-exposed state.
Chem. Listy 105, s136 s138 (2011) LMV <strong>2007</strong> Regular Lectures<br />
NANOINDENTATION MEASUREMENTS OF THE INTERMETALLIC PHASES<br />
IN GALVANNEAL COATINGS<br />
ZUZANA VADASOVÁ a , LADISLAV<br />
PE EK a *, MÁRIA KOLLÁROVÁ b ,<br />
OLGA BLÁHOVÁ c , and PAVOL ZUBKO a<br />
a Faculty of Metallurgy, TU of Ko ice, Park Komenského 11,<br />
042 00 Ko ice, Slovakia, b Research and Development Centre,<br />
U. S. Steel, Ko ice, Slovakia, c West Bohemian University,<br />
Plze , Czech Republic<br />
ladislav.pesek@tuke.sk<br />
Keywords: nanoindentation, intermetallic phases, galvannealing<br />
1. Introduction<br />
Galvannealed IF-HS steel sheets are presently the subject<br />
of interest in automotive as well as steel industry for higher<br />
corrosion resistance, and considerably higher strength with<br />
excellent formability 1 . These coatings may contain one or<br />
more of four possible iron-zinc phases of low thickness 2 . The<br />
mechanical properties of these phases haven t been in detail<br />
investigated. Thus the depth sensing indentation is a suitable<br />
method for measurements of mechanical properties of these<br />
phases.<br />
2. Experimental details<br />
IF steel (galvanized) was used for the experiment. One<br />
sample was prepared from this galvanized steel and next the<br />
steel was additionally annealed in the furnace at 450 and<br />
500 °C at 10 and 60 s holding times, respectively. The steel<br />
thickness was 0,85 mm and average thickness of the zinc<br />
layer was 13,5 m. We marked these samples as R456 and<br />
R501. Then cross-sectional samples were prepared via classical<br />
metallographic method. All samples were investigated via<br />
scanning electron microscopy (SEM) and energy dispersive<br />
X-ray microanalysis (EDX) to determine the composition of<br />
individual intermetallics 3 .<br />
Nano Indenter XP with Berkovich indenter was used for<br />
the hardness and indentation modulus measurement. Load<br />
control mode was chosen and the load of 10 mN was used.<br />
Firstly the galvanized sample was measured and the mechanical<br />
properties of both, steel substrate and zinc layer were<br />
evaluated. Then two galvannealed samples were measured.<br />
Twenty indentations in each intermetallic phase were performed<br />
on the samples. In the case of thin layer the load of<br />
5 mN was used because of achieving the appropriate results<br />
from smaller indents.<br />
s136<br />
3. Results and discussion<br />
Firstly the mechanical properties namely the hardness<br />
and indentation modulus of galvanized steel were measured.<br />
Twenty indentations in both, steel and zinc layer ( -phase)<br />
have been performed. The load of 10 mN was used. The<br />
measured values of the indentation hardness HIT and the elastic<br />
modulus EIT are in the Tab. I.<br />
Then two galvannealed samples were measured using<br />
load control mode. Approximately twenty indentations into<br />
each intermetallic layer were performed using the load of<br />
10 mN.<br />
Table I<br />
Hardness and modulus values of galvanized steel and zinc<br />
layer<br />
R zakl Average hardness<br />
[GPa]<br />
Average modulus<br />
[GPa]<br />
Steel substrate 2,13 200<br />
Zinc layer 0,72 102<br />
Fig. 1. Steel with visible zinc layer - illustration of marking of<br />
measured intermetallic layers<br />
We named the intermetallic phases using the numbers<br />
instead of Greek alphabet, Fe steel substrate, 1 layer, 2<br />
+ layer, 3 layer see Fig. 1 and Table II. There is a great<br />
difference between hardness of intermetallic layers of galvannealed<br />
steel when compare with zinc layer of galvanized steel.
Chem. Listy 105, s136 s138 (2011) LMV <strong>2007</strong> Regular Lectures<br />
Table II<br />
Hardness and modulus values of individual intermetallic phases for each measured sample<br />
modulus [GPa]<br />
R - zakl R 456 R 501<br />
steel zinc<br />
layer<br />
The average values of the indentation hardness and elastic<br />
modulus are in the Tab. II. The same measurement was<br />
performed for the second sample. The hardness and indentation<br />
modulus of the phases have the same trend as that for the<br />
first sample.<br />
As you can see in Fig. 1, the indents in layer are so<br />
expansive that they interfere into the base material but also<br />
into the + phase. The thickness of layer is varying from<br />
500 to 2200 nm for used temperatures of annealing and holding<br />
times moreover this layer is not continuous and there are<br />
some discontinuities 3,4 .<br />
Thus the load of 5 mN was used for reaching the appropriate<br />
properties of this thin layer. According to literature data<br />
the hardness of the layer is much greater than the hardness<br />
of the others intermetallic layers. In our experiment the values<br />
steel 1 2 3 steel 1 2 3<br />
HIT [GPa] 2,13 0,72 2,44 1,36 4,58 3,33 2,39 1,11 5,12 4,46<br />
EIT [GPa] 199,8 102,1 204,3 129,3 159,0 116,9 215,2 106,3 138,4 120,9<br />
300<br />
250<br />
200<br />
150<br />
100<br />
50<br />
0<br />
-0,5g<br />
1 2 3 4 5 6 7 8 9 10 11 12 13 14 15<br />
number of measurement<br />
steel<br />
Fig. 2. Elastic modulus measured by Nano Indenter XP sample<br />
R456<br />
-1g<br />
Table III<br />
The averages values of indentation hardness, comparison of literature 3 and measured values<br />
s137<br />
Hardness [GPa]<br />
7<br />
6<br />
5<br />
4<br />
3<br />
2<br />
1<br />
0<br />
- 5mN<br />
- 10mN<br />
1 2 3 4 5 6 7 8 9 10 11 12 13 14 15<br />
number of measurement<br />
Fig. 3. Hardness measured by Nano Indenter XP sample R501<br />
HV HIT-calculated EIT - measured HIT- measured<br />
for the layer are the lowest ones. But as can be seen in the<br />
Fig. 2 the values for the modulus of each layer are typical for<br />
Fe-Zn. More experiments with lower loads are needed for<br />
achieving the appropriate values of the mechanical properties<br />
of the layer. It is evident that the hardness of intermetallic<br />
layers decreases with the decrease of the content of the Fe in<br />
the layer, except of the layer.<br />
When the load of 10 mN was used for the measurements<br />
of the thin layer, the hardness values reach the steel hardness<br />
values. Bigger part of each indent interferes into the base<br />
material and only little area reach the layer. Also the values of<br />
the modulus are typical for the steel. But in the case of 5 mN<br />
load, the hardness and modulus values are as low as for the<br />
first sample, see Tab. II.<br />
steel<br />
450 °C/60 s 500 °C/10 s 450 °C/60 s 500 °C/10 s<br />
52 0,56 102 0,72<br />
39 0,42<br />
71 0,77<br />
208 2,25<br />
117 1,26<br />
177 1,91<br />
1 358 3,87 117 121 3,33 4,46<br />
273 2,95<br />
0 270 2,92 + 1 159 138 4,58 5,12<br />
1 505 5,46 129 106 1,36 1,11<br />
326 3,52<br />
Fe 104 1,12 Fe 204 215 2,44 2,39
Chem. Listy 105, s136 s138 (2011) LMV <strong>2007</strong> Regular Lectures<br />
250<br />
200<br />
150<br />
100<br />
50<br />
5<br />
4<br />
3<br />
2<br />
1<br />
0<br />
0<br />
When compare to the literature value for Vickers measurements<br />
using 250 mN load and conversed into HIT values<br />
and HIT values from our indentation measurements there are<br />
not great differences, see Tab. III.<br />
In the Fig. 4 it can be seen that the course of indentation<br />
hardness and indentation modulus are not in accordance with<br />
the course of the weight percentage of the iron in the intermetallic<br />
layers. Such as the layer possesses the highest percentage<br />
of the iron, low values of the hardness and modulus<br />
are measured in our experiment.<br />
4. Conclusions<br />
steel<br />
0 20 40 60 80 100<br />
wt % of iron<br />
steel<br />
0 20 40 60 80 100<br />
wt % of iron<br />
Fig. 4. Indentation hardness and indentation modulus values in<br />
dependence of the weight percentage of the iron in zinc layers,<br />
sample 456<br />
Depth sensing indentation is a suitable method for the<br />
detail experimental identification of local mechanical properties<br />
of intermetallic layers in zinc coating on galvannealed<br />
steel sheet.<br />
s138<br />
There are not great differences in the Vickers microhardness<br />
values conversed into the indentation hardness and measured<br />
values of HIT using depth sensing indentation method.<br />
The annealing has the meaningful influence on the mechanical<br />
properties of the zinc layer which is transformed into<br />
the intermetallic layers. The formation of intermetallic layer<br />
causes the increase in hardness and elastic modulus.<br />
The change in the used annealing temperatures and holding<br />
times does not have great influence on the mechanical<br />
properties of Intermetallic layers. Values for both samples are<br />
quite similar.<br />
The weight percentage of the iron in the intermetallic<br />
layers is not in accordance with the indentation hardness and<br />
indentation modulus of these layers.<br />
This work was supported by the SK-CZ project SK-132/CZ-<br />
109 and partly by the project M MT R: MSM4977751303.<br />
REFERENCES<br />
1. Bakshi S. D., Dutta M., Baudyopadhyay N., Rajesh N.:<br />
Surf. Coat. Technol. 201, 4547 (<strong>2007</strong>).<br />
2. Marder A. R.: Prog. Mater. Sci. 45, 191 (2000).<br />
3. Kollárová M.: Dizerta ná práca. Ústav materiálového<br />
výskumu SAV v Ko iciach, Ko ice 2005.<br />
4. Kollárová M., D upon M., Le ko A., Parilák .: Metalurgija<br />
46, 9 (<strong>2007</strong>).<br />
Z. Vadasová a , L. Pe ek a , M. Kollárová b , O. Bláhová c ,<br />
and P. Zubko a<br />
( a Faculty of Metallurgy, TU of<br />
Ko ice,Slovakia, b Research and Development Centre, U. S.<br />
Steel, Ko ice, Slovakia, c West Bohemian University, Plze ,<br />
Czech Republic): Nanoindentation Measurements of the<br />
Intermetallic Phases in Galvanneal Coatings<br />
The paper deals with indentation measurements of hardness<br />
of the intermetallic phases in the galvanneal coatings.<br />
Galvannealed IF-HS steel sheets are presently the subject of<br />
interest in automotive as well as steel industry for higher corrosion<br />
resistance, and considerably higher strength with excellent<br />
formability. These coatings may contain one or more of<br />
four possible iron-zinc phases of low thickness. The mechanical<br />
properties of these phases haven t been in detail investigated.<br />
Thus the depth sensing indentation is a suitable method<br />
for measurements of mechanical properties of these phases.
Papers presented at<br />
the 5 th International Seminar on<br />
LOCAL MECHANICAL PROPERTIES <strong>2008</strong><br />
LOKÁLNE MECHANICKÉ VLASTNOSTI <strong>2008</strong><br />
November 3 rd to 5 th , <strong>2008</strong><br />
Ko ice Her any, Slovak Republic<br />
organized by Technical University of Ko ice<br />
in cooperation with<br />
University of West Bohemia in Plze<br />
<strong>2008</strong><br />
s139
Chem. Listy 105, s140 s142 (2011) LMV <strong>2008</strong> Invited Lectures<br />
LOKÁLNÍ MECHNICKÉ VLASTNOSTI ORGANICKO-ANORGANICKÝCH<br />
NANOKOMPOZITNÍCH POVLAK<br />
OLGA BLÁHOVÁ a<br />
a MILENA PÍRKOVÁ b<br />
a NTC Z U, Univerzitní 8, 306 14 Plze , b ÚMCH AV R,<br />
v.v.i., Heyrovského nám. 2, 162 06 Praha 6, eská republika<br />
blahova@ntc.zcu.cz, spirkova@imc.cas.cz<br />
Klí ová slova: organicko-anorganické povlaky, nanoindentace<br />
Úvod<br />
Pou ití materiál na bázi makromolekulárních látek na<br />
mechanicky, tepeln , chemicky a elektricky namáhané strojní<br />
a elektrotechnické výrobky vy aduje dobrou znalost jejich<br />
strukturního uspo ádání, mechanických, chemických a jiných<br />
vlastností a zpracovatelských proces .<br />
Polymery se svými vlastnostmi výrazn odli ují od materiál<br />
kovových; p í inou je jejich rozdílná strukturní stavba,<br />
proto je d le ité hodnotit jejich strukturu i vlastnosti nejen<br />
v makroskopickém m ítku, ale i na submikronové úrovni. To<br />
je nezbytné p edev ím p i vývoji a hodnocení nových typ<br />
materiál , zejména ve form povlak .<br />
ízení struktury v submikronovém m ítku umo uje<br />
p ipravovat nanokompozitní materiály s ízenými vlastnosti,<br />
co je umo n no irokým výb rem organických monomer ,<br />
kovových alkoxid a rozpou t del. Z ekologického hlediska<br />
je d le ité, e rozpou t dlem m e být voda nebo její sm s<br />
s alkoholy.<br />
Organicko-anorganické (O-A) materiály nabízejí velké<br />
mno ství potenciálních nebo ji technologicky zvládnutých<br />
aplikací: pou ívají se jako optické nát ry, biomateriály, membrány,<br />
jako ochranné povlaky proti po krábání, korozi, oxidaci,<br />
apod.<br />
Praktické aplikace O-A povlak vy adují znalost hlavních<br />
materiálových charakteristik, p edev ím mechanických<br />
vlastností (pevnost, hou evnatost, mikrotvrdost, apod.). O-A<br />
materiály jsou systémy zna n slo ité, je tedy nutná multidisciplinární<br />
charakterizace, u povlak zvlá t se zetelem na<br />
povrchové vlastnosti. Mechanické vlastnosti povlak odrá ejí<br />
celou adu faktor ovliv ujících kone ný stav celého systému.<br />
Pro ur ení tvrdosti a modulu pru nosti samotného povlaku,<br />
bez vlivu substrátu, je nutno pou ít instrumentovanou<br />
zkou ku tvrdosti p i malých zatí eních. V tomto p ísp vku je<br />
hodnocen vliv druhu a mno ství plniva (p írodní, nemodifikovaný<br />
montmorillonit a koloidní oxid k emi itý).<br />
Hodnocené povlaky byly p ipravované s cílem vytvo it<br />
anti-odrazové, anti-reflexní nebo anti-statické vrstvy odolné<br />
proti vliv m okolního prost edí (vlhkost, p sobení ástic ).<br />
s140<br />
Experimentální materiál<br />
Nové typy O-A povlak jsou vyvíjeny v ÚMCH 1 .<br />
Hodnocené povlaky byly pipraveny z organok emi itého<br />
prekurzoru [3-(glycidyloxy) propyl] methyldiethoxysilanu<br />
(GMDES) a oligomerního triaminu s koncovými primárními<br />
aminoskupinami (Jeffamine T403) a pidáním siliky nebo<br />
montmorillonitu Na + . Nanokompozitní povlaky byly<br />
vytvá eny dv ma nezávislými reak ními mechanismy:<br />
anorganické struktury vznikaly tzv. sol-gel procesem<br />
zahrnujícím dva následné procesy: (kyselou) hydrolýzu<br />
alkoxyskupin a (bazickou) polykondenzaci prekurzoru<br />
GMDES.<br />
Organická polymerní sí byla vytvá ena adi ními<br />
reakcemi glycidylových skupin GMDES s aminoskupinami<br />
p íslu ného Jeffaminu T403. Reak ní prost edí tvo ila sm s<br />
voda propan-2-ol (7:3 hmotnostn ), HCl slou ila jako<br />
katalyzátor hydrolýzy sol-gel procesu, Jeffamine nejd íve<br />
p sobil jako katalyzátor polykondenzace sol-gel procesu p i<br />
laboratorní teplot , poté za zvý ené teploty jako reak ní<br />
slo ka p i tvorb organické polymerní sít . Vznikly<br />
transparentní, ve v t in p ípad bezbarvé nebo slab<br />
na loutlé produkty ve form volných nát rových film nebo<br />
povlak na skle. Tlou ka se pohybovala okolo 100 m.<br />
Anorganická sí ová výstavba (sol-gel proces):<br />
*<br />
*<br />
*<br />
Si<br />
*<br />
*<br />
Si<br />
*<br />
OR'<br />
OR<br />
+ H O 2<br />
*<br />
*<br />
Si<br />
*<br />
OH +<br />
kde R je alkyl, ROH je hydroxyl skupina nebo alkyl, * je bu<br />
(aktivní) alkoxylová nebo hydroxylová skupina nebo n jaká<br />
jiná skupina v procesu nete ná.<br />
Organická sí ová výstavba:<br />
+<br />
NH 2<br />
ROH<br />
*<br />
* *<br />
+ HO<br />
Si *<br />
* Si O Si * + R'OH<br />
*<br />
* *<br />
CH CH 2 CH 2<br />
O<br />
+<br />
O<br />
CH CH 2 CH 2<br />
N<br />
OH<br />
CH CH 2 CH 2<br />
NH<br />
CH 2 CH CH 2<br />
CH CH<br />
2 CH 2<br />
OH<br />
OH<br />
(3)<br />
(4)
Chem. Listy 105, s140 s142 (2011) LMV <strong>2008</strong> Invited Lectures<br />
Hodnocené vzorky:<br />
O-A O-A matrice<br />
(GMDES a T403)<br />
S O-A matrice se silikou 20 hm.%<br />
(GMDES, T403 a SiO2)<br />
M O-A matrice s montmorillonitem Cloisite Na +<br />
1 hm.% (GMDES, T403 a MMT Na)<br />
S1-S8 O-A matrice se silikou 0 40 hm.%<br />
(GMDES, T403 a SiO2)<br />
Experimentální metody<br />
V ÚMCH je proces vzniku a struktura pipravených<br />
povlak hodnocena vyu itím spektroskopie NMR (nukleární<br />
magnetická rezonance) 1,2 . Struktura hybridních O-A<br />
nanokompozitních povlak byla studována pomocí metod<br />
SAXS a WAXS (maloúhlového a irokoúhlového rozptylu<br />
paprsk X) 1 4 . Morfologie povrch nát rových film byla<br />
sledována pomocí AFM (mikroskopie atomových sil) za<br />
pou ití kontaktního i bezkontaktního re imu 1,5 . Teplotní<br />
závislosti obou slo ek komplexního smykového modulu byly<br />
hodnoceny metodou dynamické mechanické termální<br />
analýzy 6 . Byly testovány pevnostní charakteristiky vzork ve<br />
form volných nát rových film : ze závislosti nap tí<br />
deformace byly ur eny ta nost, pevnost a hou evnatost 1,7 .<br />
Dal ím ze zp sob hodnocení kvalitativních vlastností<br />
povlak je scratch test , který byl provád n pomocí AFM<br />
s p ítla nou silou ádov 100 nN (cit. 5 ).<br />
Indenta ní experimenty byly uskute n ny pou itím<br />
p ístroje MTS NanoIndenter XP s pou itím metody CSM<br />
(kontinuální m ení tuhosti). Tato metoda je zalo ená na<br />
principu superpozice velmi malé sinusoidní síly s lineárn<br />
rostoucí zát nou sílou. Odezva indentoru p i dané frekvenci<br />
a fázovém posunu mezi silou a posunutím indentoru je<br />
m ená pr b n jako funkce hloubky vtisku. Vyhodnocení<br />
odezvy vede k ur ení kontaktní tuhosti S v závislosti na<br />
hloubce vtisku. Mechanické vlastnosti pak mohou být ur eny<br />
ze vztahu:<br />
S<br />
2<br />
E<br />
r<br />
A<br />
c<br />
kde Ac je projek ní kontaktní plocha mezi indentorem<br />
a vzorkem p i maximální síle, je konstanta závislá na druhu<br />
indentoru a Er je redukovaný modul pru nosti:<br />
1 / Er = (1 m 2 ) / Em + (1 i 2 ) / Ei (2)<br />
kde Ei (1140 GPa) a i (0,07) jsou elastické vlastnosti<br />
indentoru, Em a m jsou elastické vlastnosti zkoumaného<br />
vzorku. V práci byla p edpokládána hodnota Poissonova ísla<br />
pro hodnocený materiál 0,35. Modul pru nosti vzorku je pak<br />
vypo ten ze vztah (1 a 2) 8 . Tvrdost H jako podíl zát né síly<br />
P a kontaktní plochy Ac:<br />
H = P / Ac = c P / hc 2 (3)<br />
kde c je geometrická konstanta a hc je kontaktní hloubka<br />
vtisku p i maximálním zatí ení. Parametry m ení: amplituda<br />
5 nm, oscila ní frekvence 75 Hz, zm na hloubky vlivem<br />
teploty
Chem. Listy 105, s140 s142 (2011) LMV <strong>2008</strong> Invited Lectures<br />
Obr. 3. Pr b h indenta ní tvrdosti v závislosti na hloubce vtisku<br />
vzork S1 a S6<br />
povlaky s r zným mno stvím tohoto plniva.<br />
Na obr. 3. je hloubkový pr b h indenta ní tvrdosti vzork<br />
S1 a S6. Tvrdost s hloubkou nejprve klesá. Hodnoty charakterizující<br />
povlak byly ur eny z lokálních maxim kivek<br />
a jsou uvedeny v tab. I. Výrazn j í vliv má obsah aditiva nad<br />
20 %.<br />
Tabulka I<br />
Hodnoty indenta ní tvrdosti a indenta ního modulu pru nosti<br />
povlak s r zným obsahem SiO2<br />
Vzorek Obsah<br />
plniva [%]<br />
HIT<br />
[MPa]<br />
EIT<br />
[MPa]<br />
S1 0 5,48 ± 0,47 483 ± 61<br />
S2 0,5 4,66 ± 0,43 457 ± 49<br />
S3 5 4,64 ± 0,27 438 ± 22<br />
S4 10 5,69 ± 0,28 737 ± 23<br />
S5 20 8,70 ± 1,15 1034 ± 92<br />
S6 30 10,74 ± 1,72 966 ± 119<br />
S8 40 100,23 ± 16,81 3890 ± 422<br />
Obr. 4. Pr b h indenta ní tvrdosti v závislosti na hloubce vtisku<br />
vzork S1 a S8<br />
s142<br />
Na obr. 4. je hloubkový pr b h indenta ní tvrdosti vzork<br />
S1 a S8. Obsah aditiva 40 % má zna ný vliv na hodnotu<br />
tvrdosti. Ov em velký rozptyl nam ených hodnot sv d í<br />
o velké nehomogenit povlaku.<br />
Záv r<br />
Tato práce obsahuje výsledky nanoindenta ních analýz<br />
hybridních O-A nanokompozitních povlak bez plniva<br />
a s p idáním montmorillonitu a koloidního oxidu k emi itého.<br />
P idání 0,5 % oxidu k emi itého zlep ilo odolnost povlak<br />
proti opot ebení, pesto e se nezvý ila tvrdost. Proto byly<br />
hodnoceny vzorky s vy ím obsahem tohoto aditiva. Výsledky<br />
dopl ují poznatky získané jinými metodami 1 7 a p isp jí<br />
tak k optimalizaci vytvá ení t chto povlak vzhledem<br />
k aplikacím vy adujícím zvý enou odolnost proti opot ebení.<br />
LITERATURA<br />
1. pírková M. et al.: Surf. Coat. Int., B 86, 187 (2003).<br />
2. pírková M. et al.: Nano 03, <strong>Brno</strong>, 2003. str. 109 114,<br />
<strong>Brno</strong> 2003.<br />
3. Brus J. et al.: Macromolecules 37, 1346 (2004).<br />
4. pírková M. et al.: J. Appl. Polym. Sci. 92, 937 (2004).<br />
5. pírková M. et al: J. Appl. Polym. Sci. 102, 5763 (2006).<br />
6. pírková M. et al.: Prog. Org. Coat. 61, 145 (<strong>2008</strong>).<br />
7. pírková M. et al.: Surf. Eng. 24, 268 (<strong>2008</strong>).<br />
8. Fisher-Cripss A. C.: Introduction to Contact Mechanics,<br />
Springer Verlag, New York 2000.<br />
9. Hu Y. et al.: Polym. Test. 25, 492 (2006).<br />
10. Farka ová T. et al.: Vrstvy a povlaky 2004. Dubnica nad<br />
Váhom, str. 195 200. ZTS MATEC, 2004.<br />
11. Farka ová T. et al.: Vrstvy a povlaky 2005. Tren ín, str.<br />
40 45. Digital Graphics, 2005.<br />
Práce byla podpo ena projektem IAA400500505 Grantové<br />
agentury Akademie v d eské republiky a výzkumným<br />
zám rem M MT MSM 4977751303.<br />
O. Bláhová a and M. pírková b ( a NTC Z U Plze ,<br />
b ÚMCH AV R Praha, Czech Republic): Local Mechanical<br />
Properties of Organic-Inorganic Nanocomposite Coatings<br />
The paper deals with the determination of local mechanical<br />
properties of hybrid organic-inorganic epoxy-based<br />
coatings. Examined specimens were prepared from functionalized<br />
organosilicon precursors, oligomeric di- or triamines<br />
and colloidal silica particles. The mechanical properties were<br />
studied by nanoindentation technique. Tests were performed<br />
to study influence of additives on indentation hardness and<br />
indentation modul.
Chem. Listy 105, s143 s145 (2011) LMV <strong>2008</strong> Invited Lectures<br />
DETERMINATION OF PARAMETERS OF VISCOELASTIC MATERIALS<br />
BY INSTRUMENTED INDENTATION.<br />
PART 2: VISCOELASTIC-PLASTIC RESPONSE<br />
JAROSLAV MEN ÍK<br />
University of Pardubice, Studentská 95, 53210 Pardubice,<br />
Czech Republic<br />
jaroslav.mencik@upce.cz<br />
Keywords: mechanical properties, instrumented indentation,<br />
nanoindentation, viscoelasticity, plastic deformations<br />
1. Introduction<br />
This paper is a continuation of the article<br />
Determination of parameters of viscoelastic materials by<br />
instrumented indentation 1 . That article has explained the<br />
principles of instrumented indentation and brought basic formulae<br />
for indentation testing of elastic-plastic materials (with<br />
instantaneous response to load), as well as for the description<br />
of load response of viscoelastic materials, where the deformations<br />
depend not only on the load magnitude, but also on its<br />
duration. In Practical part, recommendations were given for<br />
the preparation of indentation tests into viscoelastic materials<br />
and for the evaluation of results. The article was limited to<br />
reversible deformations, which disappear fully during some<br />
time after unloading. Often, however, also irreversible deformations<br />
occur, e.g. under concentrated load or in materials<br />
whose response has viscous character. In this paper, the formulae<br />
for indentation response will be extended to irreversible<br />
deformations. Advice will be given for tests arrangement<br />
and data evaluation, and the proposed procedure will be illustrated<br />
on a practical example.<br />
2. Theoretical part<br />
Viscoelastic materials are typical by deformations depending<br />
not only on the load magnitude, but also on its duration<br />
and time course. As shown in 1 , the relationship between<br />
indenter load P and depth h of its penetration into a specimen<br />
from such material under monotonic loading can generally be<br />
expressed as<br />
f [h(t)] = K (P, J, t) (1)<br />
where f is some function of the indenter shape and penetration,<br />
K is a constant characterizing the indenter geometry, and<br />
(P, J, t) is a function depending on the load magnitude and<br />
history, on material parameters, and on time; J is so-called<br />
creep compliance function. For pointed indenters (conical,<br />
Vickers or Berkovich)<br />
f = h 2 ; K = / (4 tan ) (2)<br />
is the semi-angle of indenter tip or of equivalent cone (for<br />
s143<br />
Berkovich and Vickers indenter, 70.4°). The load response<br />
of viscoelastic materials is usually described by models<br />
assembled from springs and dashpots. Rheological parameters<br />
for a viscoelastic model-body consisting of a spring<br />
in series with several Kelvin-Voigt units (a spring in parallel<br />
with a dashpot), can be obtained relatively easily from the<br />
time course of indenter penetration under constant load. For<br />
this case 1,2 ,<br />
(t) = P { C0 + Cj [1 j exp( t / j)]} (3)<br />
C0 represent the instantaneous compliance, while the constants<br />
C1, Cj pertain to the individual Kelvin-Voigt bodies,<br />
and, together with the retardation times j characterize the<br />
time-dependent processes. j is so-called ramp correction<br />
factor, which takes into account the fact that the load increase<br />
was not infinitely short, but lasted tR. According to Oyen 2 ,<br />
j = ( j /tR) [exp(tR / j) 1] (4)<br />
The irreversible deformations can be time-independent<br />
or time-dependent. The time-independent (plastic) behaviour<br />
can be modelled by a plastic element (a slider) in the<br />
rheological model, and the time-dependent irreversible deformations<br />
can be described by a dashpot arranged in series with<br />
other elements. The plastic element is characterised by hardness<br />
H0 (or yield strength Y), which is together with the<br />
Young modulus E0 for instantaneous elastic response contained<br />
in the constant C0. Time-dependent irreversible deformation<br />
is characterised by a dashpot of viscosity v, with the<br />
creep compliance function<br />
J(t) = cv t (5)<br />
where the viscous compliance cv is related to the dynamic<br />
viscosity as cv = 1/ v.<br />
C 0, E0 Y, H0 v, cv C 1, 1 C2, 2<br />
Fig. 1. Viscoelastic-plastic model spring + plastic element +<br />
dashpot + 2 Kelvin-Voigt bodies<br />
The response function for a universal viscoelastic-plastic<br />
body, consisting of a spring, a dashpot and several Kelvin-<br />
Voigt units in series (Fig. 1), loaded by a constant force P, is<br />
(t) = P{C0 + cv(t tR/2) + Cj [1 j exp( t / j)]} (6)<br />
the term tR/2 expresses the fact that the irreversible viscous<br />
deformations during the load increase from 0 to P are smaller<br />
than they would be if the full force P acted for the time tR<br />
(they correspond to the average force P/2).
Chem. Listy 105, s143 s145 (2011) LMV <strong>2008</strong> Invited Lectures<br />
3. Procedure for the determination<br />
of viscoelastic-plastic properties<br />
Parameters, characterizing viscoelastic properties, can<br />
be estimated from a simple five-step procedure (Fig. 2). In the<br />
first step (I, duration tR), the indenter is quickly loaded to the<br />
nominal load P. Then, a long dwell under this load follows<br />
(step II), then rapid unloading to a very low load Pu (step III),<br />
followed by a long time under this load (IV), and unloading to<br />
zero (V). The response during dwell II provides the base for<br />
the determination of viscoelastic parameters, while the backcreep<br />
in the low-load dwell IV serves for the verification of<br />
the duration of reversible viscoelastic processes and of the<br />
necessary number of Kelvin-Voigt elements (determined in<br />
step II). The parameters of instantaneous elastic and plastic<br />
deforming are best obtained from a separate load-unload test.<br />
The loading in step I should be as quick as possible in<br />
order to reduce the time-dependent processes during this period.<br />
A constant load rate (dP/dh = const) is recommended<br />
here, because the ramp correction factor , Eq. (4), corresponds<br />
to this case. However, if the duration of load increase<br />
is short, the viscoelastic deformations during this time are<br />
small, and the details of the load increase P(t) are not very<br />
important. The dwell II under constant load should be sufficiently<br />
long so that all reversible viscoelastic processes have<br />
died away and their duration can be assessed. The unloading<br />
III should be fast and the constant load Pu in the following<br />
period IV should be very low, only such that the indenter<br />
remains in contact with the specimen and can serve as a sensor<br />
to measure the deformation recovery (back-creep). The<br />
period IV should last about the same time as period II.<br />
The processing of measured h(t) data starts with the<br />
determination of constants in the creep compliance function<br />
from the dwell II. The practical procedure will be illustrated<br />
on a test with a pointed indenter and response function (6).<br />
Inserting this function together with equation (2) into Eq. (1)<br />
gives<br />
h 2 (t) = PK{C0 + cv (t tR/2) + Cj [1 j exp( t / j)]} (7)<br />
where P is the nominal load and K = /(4 tan ), with the indenter<br />
tip semiangle .<br />
The constants C0, cv, C1, 1, 1, etc. can be obtained by<br />
minimizing the sum of the squared differences between the<br />
measured and calculated h 2 (t) values. However, the actual<br />
procedure must be modified. In equation (7), several terms<br />
appear that do not depend on time: C0, cvtR/2 and Cj. Regression<br />
analysis cannot determine them individually, but only as<br />
a whole; otherwise incorrect values could be obtained. More-<br />
P<br />
I<br />
II<br />
P u<br />
III<br />
Fig. 2. Five-step loading-unloading scheme for obtaining the viscoelastic-plastic<br />
parameters; P indenter load, t time<br />
IV<br />
V<br />
t<br />
s144<br />
over, the terms Cj j also occur here, as well as the ramp correction<br />
factors j, which depend on the retardation times j<br />
that are also unknown. From a curve-fitting point of view,<br />
equation (7) corresponds to the expression<br />
where<br />
h 2 (t) = P K [B + cvt Dj exp( t / j)] (8)<br />
B = C0 cv tR/2 + Cj ; Dj = Cj j ; j = 1, 2, 3 (9)<br />
The determination of material parameters proceeds in three<br />
steps:<br />
Step 1. Calculation of regression constants B, cv and Dj, as<br />
well as the retardation times j by fitting the h 2 (t) data from<br />
period II by the regression function (8).<br />
Step 2. Calculation of the ramp correction factors j from Eq.<br />
(4) for the known duration tR of load increase and the retardation<br />
times j. Then, the constants Cj are found as Cj = Dj/ j.<br />
Step 3. Determination of C0 from Eq. (9) as<br />
C0 = B + cv tR /2 Cj (10)<br />
Similar procedures can be used for other models and indenters.<br />
It is recommended to try and evaluate several models;<br />
analysis of the back-creep during the low-load dwell (step IV)<br />
can be helpful here.<br />
The above data-processing has separated the timedependent<br />
deformations from the instantaneous ones, characterized<br />
by the compliance C0. Now it is necessary to decompose<br />
C0 into the reversible elastic component and irreversible<br />
plastic component. These components may be characterized<br />
by instantaneous elastic modulus E0 and hardness H0, which<br />
are determined in a similar way like in elastic-plastic materials,<br />
i.e. from the loading and unloading curves, as described<br />
in 1 . If the unloading in step III is sufficiently quick, the fast<br />
contact stiffness S could be obtained. However, this stiffness<br />
corresponds to the larger depth at the end of dwell, and the<br />
pertinent hardness will be lower than the instantaneous one.<br />
Therefore, it is better to determine S, E0 and H0 in a separate<br />
test, with fast loading followed immediately by fast unloading.<br />
4. Experimental part<br />
The above method was used for the determination of<br />
viscoelastic-plastic parameters of tooth enamel 3 . A human<br />
tooth was embedded into epoxy resin and cut and polished<br />
with a diamond paste. The tests were done with a UMIS-2000<br />
nanoindenter and a diamond Berkovich indenter. The experiments<br />
were divided into two groups; one served for obtaining<br />
viscoelastic parameters from the creep data, and the other was<br />
for the determination of the instantaneous elastic modulus and<br />
hardness.<br />
In the first group, six tests were made using the five-step<br />
loading scheme (Fig. 2). The indenter was loaded to the<br />
nominal load P = 250 mN, which was then held constant for<br />
975 1145 s. Then it was unloaded to Pu = 5 mN, kept constant<br />
938 1110 s and then unloaded to zero. The load increase<br />
(step I) and decrease (step III) lasted about 20 s each. The<br />
characteristic depths varied between 1.83 1.96 m under<br />
nominal load 250 mN, and between 1.40 1.33 m after
Chem. Listy 105, s143 s145 (2011) LMV <strong>2008</strong> Invited Lectures<br />
unloading to 5 mN; the details are given in 3 .<br />
The load-displacement curve during dwell II was approximated<br />
by four models:<br />
Spring + one Kelvin-Voigt body,<br />
Spring + two Kelvin-Voigt bodies,<br />
Spring + dashpot + one Kelvin-Voigt body,<br />
Spring + dashpot + two Kelvin-Voigt bodies.<br />
Model d), depicted in Fig. 1, was described by the equation<br />
(7) or (8) with j = 2, while the model c) was only with<br />
j = 1, and the models a) and b) were without the dashpot (cv).<br />
The constants B, cv, D1, D2, 1 and 2 were found by minimizing<br />
the sum of the squared differences between the squares of<br />
the measured and calculated depth, [hm 2 (tj) hc 2 (tj)] 2 = min.<br />
The solver in Microsoft Excel was used for the minimization.<br />
Then, the ramp correction factors 1, 2 and the constants C0,<br />
C1, C2 were found. For better judgement of individual approximations,<br />
the relative differences between measured and<br />
calculated values, rel,j = [hm(tj) hc(tj)]/hm(tj), were also calculated<br />
and plotted.<br />
The best approximation was obtained by the model (d)<br />
spring + dashpot + 2 Kelvin-Voigt bodies (Fig. 3). A very<br />
good fit was also obtained by the model (b) S + 2 KV . The<br />
model (c) S + D + KV was worse, and the model (a) S +<br />
KV has not corresponded to the measured curve. The backcreep<br />
after unloading has confirmed suitability of the model<br />
(d) and the retardation times, which were approximately<br />
1 20 s, 2 200 s.<br />
1,96<br />
1,94<br />
1,92<br />
1,90<br />
1,88<br />
1,86<br />
1,84<br />
1,82<br />
Fig. 3. Indenter penetration into tooth enamel under constant<br />
load during dwell II 3 . Measured values are plotted together with<br />
those calculated for model S + D + 2 KV ; the differences can be<br />
seen only in the diagram of relative residuals rel. h depth, t time<br />
Elastic modulus E and hardness H, determined in six<br />
separate load-unload tests using the formulae numbered (1)<br />
(4) in 1 , were in the range: 96 102 GPa for E, and 4.0 4.6 GPa<br />
for H. All measurements are described in paper 3 , which also<br />
contains all important values.<br />
Hardness and elastic modulus characterize the instantaneous<br />
response. As such, they are related to the compliance<br />
C0. Hainsworth et al. 4 and Malzbender et al. 5 have derived the<br />
following relationships for the loading curve under a pointed<br />
indenter:<br />
P = kh 2 ;<br />
h ( m)<br />
0 200 400 600 800 1000 1200<br />
t (s)<br />
k<br />
E<br />
E<br />
H<br />
rel (%)<br />
H<br />
E<br />
2<br />
0,2<br />
0,1<br />
0,0<br />
-0,1<br />
-0,2<br />
(11)<br />
s145<br />
with constants = 0.202 and = 0.638. The combination<br />
with the instantaneous part of Eq. (7), h 2 = PKC0, gives 3 :<br />
C<br />
0<br />
4 tan<br />
where Er is the reduced modulus, related to the elastic<br />
modulus of the specimen (E) and the indenter (Ei) as 1/Er =<br />
(1 2 )/E + (1 i 2 )/Ei; is Poisson´s ratio. The value of C0<br />
for the tooth enamel, calculated from the measured values H<br />
and E (resp. Er), differed from the instantaneous compliance<br />
C0, obtained by fitting the creep data via Eq. (12), by less than<br />
4 % (ref. 3 ). This demonstrates the possibility of using the<br />
formula (12) for verification of parameters in viscoelasticplastic<br />
models.<br />
5. Conclusions<br />
Mechanical properties can be determined by instrumented<br />
indentation, where the indenter load and displacement<br />
are measured continuously during loading and unloading. The<br />
load response of viscoelastic-plastic materials can be described<br />
by means of rheologic models, consisting of springs<br />
and dashpots. In this paper, following the first part 1 , formulae<br />
were given for the description of indentation response of these<br />
materials. Also a five-step test procedure, combined with<br />
a fast load-unload test, was proposed for experimental determination<br />
of viscoelastic-plastic parameters. The use of the<br />
method has been illustrated on indentation testing of humantooth<br />
enamel.<br />
The work was supported by the Grant Agency of Czech Republic,<br />
project No. GA R 103/08/1340.<br />
REFERENCES<br />
1<br />
E<br />
r<br />
E<br />
r<br />
H<br />
(12)<br />
1. Men ík J.: Chem. Listy, in print.<br />
2. Oyen M. L.: Philosophical Magazine 86, 5625 (2006).<br />
3. Men ík J., He L. H., Swain M. V.: J. Mech. Behav. Biomed.<br />
2, 318 (2009).<br />
4. Hainsworth S. V., Chandler H. W., Page T. F.: J. Mater.<br />
Res. 11, 1987 (1996).<br />
5. Malzbender J., With de G., Toonder den J.: J. Mater. Res.<br />
15, 1209 (2000).<br />
J. Men ík (Department of Mechanics, Materials and<br />
Machine Parts, Jan Perner Transport Fakulty, University of<br />
Pardubice, CZ-53210 Pardubice, Czech Republic): Determination<br />
of Parameters of Viscoelastic Materials by Instrumented<br />
Indentation. Part 2: Viscoelastic-Plastic Response<br />
The load response of viscoelastic-plastic materials can<br />
be described by rheologic models, consisting of springs and<br />
dashpots. This paper, which follows the first part, published in<br />
Chemické listy earlier 1 , gives formulae for description of<br />
indentation response of these materials. Also a five-step test<br />
procedure, combined with a fast load-unload test, was proposed<br />
for experimental determination of viscoelastic-plastic<br />
parameters by instrumented indentation. The use of this<br />
method has been illustrated on testing of human-tooth enamel.<br />
H<br />
E<br />
r<br />
2
Chem. Listy 105, s146 s149 (2011) LMV <strong>2008</strong> Invited Lectures<br />
MICROMECHANICAL ANALYSIS OF HETEROGENEOUS STRUCTURAL<br />
MATERIALS<br />
JI Í N ME EK<br />
and KATE INA FORSTOVÁ<br />
VUT v Praze, Fakulta stavební, Thákurova 7, 166 29 Prague<br />
6, Czech Republic<br />
jiri.nemecek@fsv.cvut.cz, katerina.forstova@fsv.cvut.cz<br />
Keywords: heterogeneous materials, cement, fly-ash,<br />
nanoindentation, ESEM, AFM<br />
1. Introduction<br />
Micromechanical analysis of any material involves several<br />
subsequent steps that cannot be omitted. The first one<br />
includes microstructural observations and determination of<br />
phases. This step can be performed with the aid of many experimental<br />
techniques. Among others, the most common technique<br />
is electron microscopy (ESEM) and atomic force microscopy<br />
(AFM). These techniques allow qualitative as well<br />
as quantitative investigation of individual material phases at<br />
small volumes near or at the sample surface. As<br />
a complementary computational technique, image analysis<br />
can give valuable results for the phase distribution based on<br />
the separation of pixel colors.<br />
The second step is the measurement of intrinsic properties<br />
of individual material phases. These measurements can be<br />
provided exclusively by nanoindentation which is a technique<br />
that can directly access mechanical properties at small dimensions<br />
starting from several tens of nanometers (depending on<br />
the sample and the probe).<br />
The third step involves up-scaling of the properties to the<br />
higher level (mesolevel) 6 . Several analytical or numerical homogenization<br />
techniques can be employed to reach this goal.<br />
2. Heterogeneity of structural materials<br />
We can find several types of heterogeneity at microscale<br />
of structural materials. The first type of heterogeneity comes<br />
from mixing of components that do not chemically react in<br />
the matrix like sand, fibers, and other additives. Such heterogeneity<br />
is usually known in advance and is given by the mixing<br />
proportions. The second type of heterogeneity comes from<br />
chemical reactions that are evolving after the mixing of components.<br />
As a result of these reactions, new phases are produced<br />
and it is hard to rigorously define their volumes and<br />
distribution. Formation of the new phases includes fully reacted<br />
matrix, unreacted grains of the raw material and interfacial<br />
zones with different chemical and also mechanical properties<br />
1,2 . Structural materials based on cement or waste materials<br />
(like fly-ash, furnace slag, etc.) usually include both types<br />
of the heterogeneity.<br />
s146<br />
3. Test samples<br />
As an example of structural materials, two types of samples<br />
were selected: cement paste (CP) and alkali-activated flyash<br />
(AAFA). Cement paste (as the main component of cementitious<br />
composites) is formed by mixing the cement powder<br />
(granulated clinker minerals) with water. Subsequent chemical<br />
reaction (hydration) follows to form new products. The<br />
main components that can also be distinguished in ESEM are<br />
hydrated products containing mainly calcium-silica hydrates<br />
(C-S-H gels) and calcium hydroxide CaOH2 (CH, Portlandite),<br />
unreacted clinker grains and capillary pores (see Fig. 1).<br />
Samples used in this study were created from Portland cement<br />
CEM-I 42,5R, locality Mokrá, mixed with water in watercement<br />
ratio = 0.5 by weight and cured in water for approximately<br />
1 year.<br />
The second samples were produced from granulated<br />
fly-ash (coal power-plant, M lník) activated by addition of<br />
6 10 % of Na2O and cured 4 16 hours at 60 90 °C. After the<br />
Figure 1. ESEM image of hydrated cement paste. Dark areas =<br />
pores; dark grey = C-S-H gels; light grey = Portlandite; light areas =<br />
unreacted clinkers<br />
Figure 2. ESEM image of AAFA. Light and light grey areas = unreacted<br />
or partly reacted fly-ash grains; dark grey areas = polymer zone;<br />
dark areas = pores
Chem. Listy 105, s146 s149 (2011) LMV <strong>2008</strong> Invited Lectures<br />
activation, polymerization takes place to form 2 3 dimensional<br />
Si-O-Al-O chains as follow<br />
M n Si O z Al O .wH 2O<br />
The microstructure of resulting AAFA is shown in Fig. 2.<br />
4. Nanoindentation<br />
In order to identify intrinsic material properties of the<br />
test samples, nanoindentation was employed. Two nanoindenters<br />
were used. Namely, Hysitron Tribolab was used for<br />
small indents (up to 10 mN) due to its high resolution and<br />
possibility of surface scanning and CSM Nanohardness tester<br />
was used for standard indentation with larger forces (up to<br />
500 mN).<br />
Since we are dealing with heterogeneous microstructure,<br />
interpretation of the results is more complicated than for a<br />
single phase material. We have to employ also special testing<br />
strategies to be able to correctly interpret experimental results.<br />
There are basically three strategies that can be used:<br />
Producing of large number of indents that are larger than<br />
the characteristic phase dimension with subsequent statistical<br />
evaluation of overall material properties of all affected<br />
phases that were indented (phase compound).<br />
Grid indentation in which indents are produced over<br />
a large area but the dimension of a single indent is smaller<br />
than the characteristic dimension of individual phase. Subsequent<br />
deconvolution techniques can be employed for<br />
assessment of the individual phase properties 3,4 .<br />
Pointed indentation to a specific material phase with<br />
indent dimension smaller then the characteristic dimension<br />
of the tested phase. In this case, intrinsic properties<br />
of the phase (including intrinsic phase porosity) are obtained.<br />
All three strategies were applied for the studied case and results<br />
compared.<br />
The above mentioned deconvolution includes identification<br />
of the number of material phases (n) in the material. This<br />
number is usually known in advance from separate analysis<br />
(like EDX). Therefore, we are in fact looking for a finite number<br />
of n peaks in the histogram of mechanical properties from<br />
the whole set which serves like an overall probability function.<br />
We can deconvolute n probability functions from the<br />
overall one by defining n separate intervals with the individual<br />
probability function related to a single material phase.<br />
These functions are usually constructed using normal (Gauss)<br />
distribution 4 .<br />
5. Results on cement paste<br />
A large grid of 100 indents was produced over the arbitrarily<br />
selected region of the cement paste. Relatively large<br />
indents possibly affecting more than one material phase were<br />
prescribed (maximum force 10 mN). The final depth of indents<br />
was around 700 nm (Fig. 3) which yielded in the surface<br />
dimension around 4 m. Such indents dimension causes<br />
physical homogenization (averaging) of properties in this<br />
volume. Since the majority of indents were performed in the<br />
hydrated products and indentation to clinkers was rare, in-<br />
n<br />
s147<br />
dents lying in unhydrous phases were not considered for further<br />
evaluation. Thus, results are valid and identified for the<br />
hydrated phase compound. Overall modulus of elasticity for<br />
all the affected phases (mainly C-S-H gels and Portlandite)<br />
was measured to be 23.269±3.093 GPa. Properties of clinker<br />
minerals are usually measured separately in its pure unreacted<br />
state 8 .<br />
Although the results indicate small deviations, they must<br />
be considered as mean values of the whole compound. Identification<br />
of individual phases is not possible in this case.<br />
Substantially larger number of indents is necessary to<br />
cover heterogeneity of the sample when using small indents.<br />
400 indents in four series were prescribed to the maximum<br />
load of 2 mN (Fig. 4). On the other hand, we were able to<br />
identify individual material phases from histogram plotted for<br />
Normalized frequency [-]<br />
0.2<br />
0.1<br />
12<br />
10<br />
8<br />
6<br />
4<br />
2<br />
0<br />
2.5<br />
2<br />
1.5<br />
1<br />
0.5<br />
0 250 500 750 1000<br />
Depth [nm]<br />
Figure 3. Large indent (10 mN) into hydrated compound of cement<br />
paste<br />
0<br />
0 100 200 300<br />
Depth [nm]<br />
Figure 4. Small indent (2 mN) in cement paste<br />
0<br />
0 25 50 75 100 125 150<br />
Er [GPa]<br />
Figure 5. Histogram of reduced moduli in cement paste
Chem. Listy 105, s146 s149 (2011) LMV <strong>2008</strong> Invited Lectures<br />
Normalized frequency [-]<br />
0.25<br />
0.2<br />
0.15<br />
0.1<br />
0.05<br />
0<br />
0 20 40 60 80<br />
Er [GPa]<br />
reduced modulus 5 , for example (Fig. 5). Several identifiable<br />
peaks can be found in this histogram that can be attributed to<br />
individual phases.<br />
We decided to apply deconvolution into 5 phases in<br />
Fig. 5. These phases were following: low stiffness phases<br />
(LS); low density C-S-H gels (LD-CSH); high density C-S-H<br />
gels (HD-CSH); Portlandite (CH) and the rest (rest). Experimental<br />
histogram of all phases as well as individual phase<br />
distributions are depicted in Fig. 6. Mean values and standard<br />
deviations of normal distributions for individual phases can be<br />
found in Tab. I.<br />
Pointed indentation to a specific phase is in general possible<br />
based on the assumption that the phase can be distinguished<br />
in optical microscope or in a scanner prior to indentation.<br />
In case of cement paste, such a phase can be a clinker or<br />
high density C-S-H gel that is formed mainly as a rim around<br />
the clinker grain. Other phases cannot be found in such a way.<br />
Therefore, we tried to identify directly HD C-S-H by pointed<br />
indentation. Small deviations were found which shows on<br />
indentation to a homogeneous-like phase. The results of reduced<br />
moduli were 38.6±2.57 GPa. This value corresponds<br />
fairly well with results obtained by deconvolution from histogram<br />
(Tab. I).<br />
exp<br />
LS<br />
LD-CSH<br />
HD-CSH<br />
CH<br />
rest<br />
all<br />
Figure 6. Deconvolution of individual phases in cement paste<br />
Table I<br />
Results from deconvolution and image analysis of cement<br />
paste<br />
Mean Er,<br />
GPa<br />
Er stands fro reduced modulus; fj stands for volume fraction<br />
received from deconvolution; fj IA stands for volume fraction<br />
received from image analysis<br />
`<br />
LS LD-CSH HD-CSH CH Rest<br />
7.45 20.16 33.59 40.74 55.75<br />
s.d. 0.85 3.90 2.47 0.92 14.62<br />
fj , % 1 64 24 3 8<br />
fj IA , % 7.9±6 82±5.3 4.6±2.8 5.5±2.4<br />
s148<br />
6. Results on alkali-activated fly-ash<br />
Similar approach was used also for the investigation of<br />
AAFA samples. First, a matrix of 100 large indents to 100<br />
mN was prescribed. Second, matrices with 100 indents up to 2<br />
mN were tested on four arbitrary places (i.e. 400 indents all<br />
together). The difference of the histogram of reduced moduli<br />
is depicted in Fig. 7. It can be seen that the distribution of<br />
large indents is much narrower and some of the peaks are<br />
missing. It clearly shows physical homogenization produced<br />
already during the indentation. Obtained results are moreless<br />
mean values of the polymer and fly-ash compound. On the<br />
other hand, histogram of small indents is wider and contains<br />
results from several individual phases.<br />
We decided to apply deconvolution into 5 phases in<br />
Fig. 7. These phases were following: low stiffness phases<br />
(LS); polymeric phases (GP); partly polymerized zones<br />
(partGP); partly activated fly-ash (partFA); and the rest,<br />
mainly nonreacted fly-ash (rest). Experimental histogram of<br />
all phases as well as individual phase distributions are depicted<br />
in Fig. 8. Mean values and standard deviations of normal<br />
distributions for individual phases can be found in<br />
Tab. II.<br />
Pointed indentation was not possible in case of AAFA<br />
because we were not able to distinguish a specific phase prior<br />
to indentation.<br />
Normalized frequency [-]<br />
0.14<br />
0.12<br />
0.1<br />
0.08<br />
0.06<br />
0.04<br />
0.02<br />
0.4<br />
0.35<br />
0.3<br />
0.25<br />
0.2<br />
0.15<br />
0.1<br />
0.05<br />
Figure 7. Histogram of reduced moduli in AAFA<br />
0<br />
0<br />
0 10 20 30 40 50 60 70 80 90 100 110<br />
Er [GPa]<br />
0 20 40 60 80 100<br />
Er [GPa]<br />
small indents,<br />
2mN<br />
large indents,<br />
100mN<br />
Figure 8. Deconvolution of individual phases in AAFA<br />
exp<br />
LS<br />
GP<br />
partGP<br />
partFA<br />
rest- FA<br />
all
Chem. Listy 105, s146 s149 (2011) LMV <strong>2008</strong> Invited Lectures<br />
7. Validation of results using image analysis<br />
In order to validate our results from deconvolution, we<br />
employed also image analysis. Our aim was to separate material<br />
phases from ESEM images based on the pixel color. Multiple<br />
back-scattered electron images were taken in ESEM and<br />
thresholded (20 images for CP and 4 images for AAFA). Results<br />
of thresholding is summarized in Tabs I and II. It can be<br />
concluded that good correlation in terms of similar volume<br />
fractions was obtained for cement paste samples but for the<br />
low stiffness phase. However, results from image analysis<br />
include (i) pores that cannot be mechanically determined and<br />
(ii) deviation of the value indicate large scatter in the set of 20<br />
images. That means that irregular pore structure cannot be<br />
sufficiently determined by means of mechanical testing. For<br />
the AAFA samples, the correlation is good for the main<br />
phases (GP, partGP) but again LS phase is not in good agreement<br />
with results from image analysis in which a pore structure<br />
is determined rather than the solid phase. It also seems<br />
that image analysis overestimates fly-ash phases (partFA and<br />
rest). This can be attributed to not sufficiently high number of<br />
images (only four were analyzed).<br />
Table II<br />
Results from deconvolution and image analysis of AAFA<br />
Mean Er,<br />
GPa<br />
8. Conclusions<br />
LS GP part GP part FA Rest<br />
7.15 15.53 33.50 51.49 70.85<br />
s.d. 0.65 3.01 6.18 2.76 10.29<br />
fj , % 1 32 51 7 9<br />
fj IA , % 4.2±1.5 23.7±2 45.3±4 26.8±2<br />
Er stands fro reduced modulus; fj stands for volume fraction<br />
received from deconvolution; fj IA stands for volume fraction<br />
received from image analysis<br />
Micromechanical analysis using different testing strategies<br />
was demonstrated on two examples- cement paste and<br />
alkali activated fly-ash. For both cases, grid indentation using<br />
large indents give mean values with small deviations of<br />
a material compound. Mechanical properties are homogenized<br />
by the indenter from several phases. In case of using small<br />
indents, intrinsic phase properties are obtained in the form of<br />
s149<br />
property histogram. Subsequently, individual phase properties<br />
can be deconvoluted from this histogram.<br />
Pointed indentation to a specific material phase is the<br />
best solution but it can be performed only if the following<br />
conditions are satisfied: the phase is easily identifiable in<br />
optical microscope or it can be morphologically determined<br />
before indentation (e.g. by surface scanning). Otherwise, indents<br />
cannot be pointed to this phase even if the indent s size<br />
is smaller than the measured volume.<br />
Support of the Czech Grant Agency (No. 103/06/1856) and<br />
Ministry of Education of the Czech Republic (MSM<br />
6840770003) are gratefully acknowledged.<br />
REFERENCES<br />
1. Constantinides G., Ulm F.J., Van Vliet K.: Mater. Structur.<br />
36, 191 (2003).<br />
2. Constantinides G., Ulm F. J.: Cem. Concr. Res. 34, 67<br />
(2004).<br />
3. Constantinides G., Ulm F. J.: J. Mech. Phys. Solids 55,<br />
64 (<strong>2007</strong>).<br />
4. Constantinides G., Chandran K. S. R., Ulm F. J., Van<br />
Vliet K. J.: Mater. Sci. Eng., A 430, 189 (2006).<br />
5. Oliver W. C., Pharr G. M.: J. Mater. Res. 7, 1564 (1992).<br />
6. milauer V., Bittnar Z.: Cem. Concr. Res. 36, 1708<br />
(2006).<br />
7. Vandamme M., Ulm F.-J.: Int. J. Solid. Structur. 43,<br />
3142 (2006).<br />
8. Velez K.: Cem. Concr. Res. 31, 555 (2001).<br />
J. N me ek and K. Forstová (Czech Technical University,<br />
Civil Engineering Faculty, Prague, Czech Republic):<br />
Micromechanical Analysis of Heterogeneous Structural<br />
Materials<br />
This contribution is dedicated to the methodology used<br />
in the micromechanical analysis of heterogeneous materials. It<br />
is applied to two cases of structural materials: cement paste<br />
and alkali activated fly-ash. The paper contains several approaches<br />
how to test and evaluate data from nanoindentation.<br />
It is shown that different size of indents must be followed by<br />
different interpretation of results. In case of using small size<br />
indents it is possible to derive individual material phase properties<br />
by means of deconvolution from property histogram.<br />
Indentation to a specific phase can be used only in limited<br />
number of cases provided this phase can be determined optically<br />
or by scanning before the test. Nanoindentation results<br />
were also compared with similar results obtained from image<br />
analysis.
Chem. Listy 105, s150 s154 (2011) LMV <strong>2008</strong> Regular Lectures<br />
HODNOTENIE INDENTA NÝCH A DEFORMA NÝCH CHARAKTERISTÍK<br />
LASEROVÝCH ZVAROV<br />
UBOMÍR AMBRI KO a , TOMÁ<br />
KANDRA b a LADISLAV PE EK a<br />
a<br />
Technická univerzita v Ko iciach, Hutnícka fakulta, Katedra<br />
náuky o materiáloch, Park Komenského 11, 043 85 Ko ice,<br />
b<br />
KOVOHUTY, a.s., Ulica 29. augusta 586, 053 42 Krompachy,<br />
Slovensko<br />
lubomir.ambrisko@tuke.sk, ladislav.pesek@tuke.sk<br />
K ú ové slová: in trumentovaná tvrdos , videoextenzometria,<br />
laserové zvary<br />
1. Úvod<br />
Metóda DSI (Depth Sensing Indentation), in trumentovaná<br />
tvrdos , je zalo ená na princípe priebe ného monitorovania<br />
sily a h bky vpichu. Indentor je za a ovaný silou, ktorá<br />
sa zvy uje od nuly a po zvolenú maximálnu hodnotu Fmax. Po<br />
dosiahnutí maximálnej sily nastáva fáza výdr e (mô e, ale<br />
nemusí by ) a nasledovné od ah enie. Výsledkom skú ky je<br />
indenta ná krivka ako závislos za a ujúca sila F h bka<br />
vpichu h (obr. 1). Z nej sa dá ur i tvrdos a al ie mechanické<br />
vlastnosti 1 .<br />
Obr. 1. Indenta ná krivka Obr. 2. Princíp videoextenzometrie 2<br />
Videoextenzometria je bezkontaktná metóda, ktorej princípom<br />
je snímanie obrazu pomocou CCD (Charge-Coupled<br />
Device) sníma a z povrchu skú obného telesa (obr. 2). Teleso<br />
je osvetlené nebodovým zdrojom svetla. V snímanej oblasti<br />
sú vhodne nanesené kontrastné body ( ierne body na svetlom<br />
povrchu vytvárajú po adovaný kontrast). Kontinuálnym snímaním<br />
v ase a zaznamenávaním súradníc a ísk týchto bodov<br />
pomocou príslu ného softvéru je mo né vyhodnocova<br />
deformácie medzi jednotlivými bodmi 3 .<br />
Cie om tohto príspevku je stanovi indenta né<br />
a deforma né charakteristiky laserových zvarov a vz ahy<br />
medzi nimi.<br />
2. Materiál a metodika práce<br />
Pre experimenty boli pou ité zvary odobraté<br />
z hlboko a ných laserovo zváraných prístrihov na mieru produkcie<br />
firmy Arcelor. Hrúbky a mechanické vlastnosti základ-<br />
s150<br />
ných materiálov sú uvedené v tab. I a ich chemické zlo enie<br />
je uvedené v tab. II.<br />
Tabu ka I<br />
Mechanické vlastnosti pou itých ocelí<br />
Akos Hrúbka<br />
[mm]<br />
Re<br />
[MPa]<br />
Rm<br />
[MPa]<br />
A<br />
[%]<br />
XSG 1,95 182 299 45,2<br />
HR 45 1,80 382 493 24,7<br />
Tabu ka II<br />
Chemické zlo enie pou itých ocelí<br />
XSG C<br />
0,0013<br />
Al<br />
0,055<br />
HR 45 C<br />
0,1562<br />
Al<br />
0,035<br />
Chemické zlo enie [%]<br />
S<br />
0,0105<br />
Ni<br />
0,013<br />
S<br />
0,004<br />
Ni<br />
0,015<br />
N2<br />
0,0017<br />
Sn<br />
0,003<br />
N2<br />
0,003<br />
Sn<br />
0,005<br />
Obr. 3. Makro truktúra zvarového spoja<br />
Mn<br />
0,082<br />
Nb<br />
0,001<br />
Mn<br />
0,654<br />
Nb<br />
0,001<br />
P<br />
0,011<br />
V<br />
0,002<br />
Si<br />
0,006<br />
Ti<br />
0,040<br />
Makro truktúra zvarového spoja je zobrazená na obr. 3.<br />
Priemerná írka TOO na strane ZM XSG je 0,43 mm, na strane<br />
ZM HR 45 je 0,41 mm. Mikro truktúra jednotlivých oblastí<br />
je na obr. 4 a) g).<br />
Indenta né charakteristiky laserových zvarov boli stanovené<br />
metódou DSI, ur ili sme: indenta nú tvrdos (HIT), Martensovu<br />
tvrdos (HM), deforma nú indenta nú energiu celkovú<br />
(W), deforma nú indenta nú energiu elastickú (Wel)<br />
a deforma nú indenta nú energiu plastickú (Wpl). Indentácie<br />
na výbruse v rovine kolmej k osi zvaru boli realizované na<br />
zariadení Shimadzu DUH 202 Vickersovým indentorom pri<br />
za a ení 490 mN (50 g), do jednotlivých oblastí zvarového<br />
spoja a základných materiálov, v línii rovnobe nej<br />
s povrchom plechu. V ka dej oblasti boli urobené 3 vpichy.<br />
P<br />
0,013<br />
V<br />
0,002<br />
Si<br />
0,010<br />
Ti<br />
0,001
Chem. Listy 105, s150 s154 (2011) LMV <strong>2008</strong> Regular Lectures<br />
Deforma né charakteristiky: prie na deformácia x<br />
(kolmo ku smeru za a ovania) a pozd na deformácia y<br />
(v smere za a ovania) pozd ne zvarených základných materiálov<br />
XSG a HR 45 boli stanovené videoextenzometrickou<br />
metódou. Skú obné telesá na statickú skú ku ahom boli vyrobené<br />
tak, e zvar bol rovnobe ný s osou telesa, v tomto<br />
smere boli telesá za a ené pri statickej skú ke v ahu. Pred<br />
samotným naná aním kontrastných bodov, bol na povrch<br />
vzoriek nanesený tenký plastický film bielej farby, ktorý slú i<br />
na zvý enie kontrastu medzi pozadím a kontrastnými bodmi<br />
(obr. 5). Minimálna vzdialenos medzi stredmi bodov bola<br />
0,6 mm a ve kos bodov 0,44 mm.<br />
a b<br />
c d<br />
e f<br />
g<br />
Obr. 4. Mikro truktúra zvarového spoja (poradie XSG ZVAR<br />
HR 45); a) Základný materiál XSG tvorený feritickou nerovnomernou<br />
truktúrou s výraznou textúrou po tvárnení za studena ( ZM1-<br />
XSG, ozna enie pod a legendy obr. 8 a 9). b) Oblas zhrubnutia<br />
feritického zrna. Nerovnomerná truktúra ( Zhrubnuté zrno). c) Prechod<br />
polygonálneho feritu do oblasti tvorenej acikulárnym feritom<br />
( TOO1). d) Prechod z oblasti natavenia tvorenej acikulárnym feritom<br />
(xZK) do oblasti tepelne ovplyvnenej na strane materiálu HR 45,<br />
kde vidie bainitickú truktúru. e) Detail, bainitická truktúra<br />
tepelne ovplyvnená oblas materiálu HR 45 (*TOO2 1. as ). f)<br />
Oblas prehriatia materiálu HR 45 do intervalu teplôt A1 A3, kde<br />
vplyvom následného rýchleho ochladenia nastalo rovnomerné vylú enie<br />
perlitu vo forme chumá ov na hraniciach feritických z n (+TOO2<br />
2. as ). g) Jemnozrnná rovnomerná feriticko-perlitická truktúra<br />
základného materiálu HR 45 ( ZM2-HR 45)<br />
Deforma né charakteristiky boli stanovené na dvoch<br />
skú obných telesách: na medzi pevnosti a pre okamih tesne<br />
pred roztrhnutím (perforácia), ktoré sa lí ili po tom nanesených<br />
bodov (PZZ-1 256 bodov, PZZ-2 324 bodov). Pre<br />
s151<br />
a b<br />
Obr. 5. Konfigurácie nanesených kontrastných bodov; a) PZZ-1,<br />
b) PZZ-2<br />
Obr. 6. Princípy VDTK<br />
hodnotenie nameraných výsledkov bol vyvinutý program<br />
VDTK, ktorý bol vyu itý pre off-line hodnotenie deforma -<br />
ných charakteristík. Program VDTK poskytuje mo -<br />
nos výberu z troch spôsobov výpo tu deformácií (obr. 6, A<br />
úseky, B elementy, C posunutia). Deformácia na základe<br />
spôsobu A (v ase t, v smere Y) sa po íta ako relatívne pred -<br />
enie úsekov ohrani ených kontrastnými bodmi (plné body na<br />
obr. 6). Výsledkom je hodnota deformácie, ktorá sa priradzuje<br />
zeleným bodom (prázdne body). Rovnako platí aj pre smer X.<br />
V prípade spôsobu B sa hodnota deformácie, vypo ítaná ako<br />
priemerná hodnota deformácií rovnobe ných susedných úsekov,<br />
priradí stredu celého elementu ( ervený krí ik). Spôsob<br />
C poskytuje mo nos výpo tu deformácie priamo pre kontrastné<br />
body z hodnôt ich posunutí ux, uy. Pre nekone ne<br />
malý prírastok deformácie platí:<br />
d<br />
x<br />
( dux<br />
)<br />
x<br />
3. Výsledky experimentov<br />
( du )<br />
V jednotlivých oblastiach zvarového spoja bola vyhodnotená<br />
ve kos Martensovej tvrdosti (HM), indenta ná tvrdos<br />
(HIT) a pomer energií spotrebovanej na elastickú deformáciu<br />
a celkovej spotrebovanej energie (Wel/W); akumulovaná<br />
elastická energia mô e by významnou pri iniciácii a írení<br />
trhlín. Priebehy jednotlivých veli ín v závislosti od polohy<br />
vo i osi zvaru sú zobrazené na obr. 7. Maximálna hodnota<br />
tvrdosti bola nameraná v TOO na strane materiálu HR 45<br />
(obr. 8). Ide o oblas , kde vplyvom zváracieho cyklu do lo<br />
k ohrevu materiálu HR 45 nad teplotu Ac3 a pri následnom<br />
chladnutí sa v truktúre vylú il bainit (obr. 4e). Zaujímavosou<br />
je, e minimálne hodnoty tvrdosti neboli namerané<br />
v oblasti zhrubnutia feritického zrna, ale v základnom mate-<br />
d<br />
y<br />
y<br />
y
Chem. Listy 105, s150 s154 (2011) LMV <strong>2008</strong> Regular Lectures<br />
riáli XSG. Medzi hodnotami Martensovej a indenta nej tvrdosti<br />
bola zistená lineárna závislos 4 .<br />
Pri obidvoch skú obných telesách s pozd nym zvarom<br />
nastala iniciácia lomu na strane materiálu HR 45, kde bola<br />
nameraná aj maximálna pozd na deformácia y. V ase perforácie<br />
bola maximálna deformácia na strane materiálu HR 45<br />
pribli ne dvakrát vä ia ako na strane materiálu XSG. Maximálna<br />
prie na deformácia x bola nameraná v oblasti zhrubnutia<br />
feritického zrna. Priebeh deformácie cez oblas maximálnej<br />
nameranej deformácie (po írke skú aného telesa), v závislosti<br />
od vzdialenosti k osi zvaru je znázornený na obr. 9.<br />
H [MPa]<br />
5000<br />
0.18<br />
4500<br />
0.16<br />
4000<br />
0.14<br />
3500<br />
0.12<br />
3000<br />
2500<br />
2000<br />
0.1<br />
0.08<br />
1500<br />
1000<br />
500<br />
0<br />
Hit<br />
HM<br />
Wel/W<br />
0.06<br />
0.04<br />
0.02<br />
0<br />
-2.00 -1.00 0.00 1.00 2.00<br />
vzdialenos k osi zvaru [mm]<br />
Obr. 7. HIT, HM a Wel/W v závislosti od vzdialenosti k osi zvaru<br />
Obr. 8. Závislos podielu elastickej indenta nej energie Wel/W od<br />
HIT<br />
HIT [MPa]<br />
0,2<br />
0,18<br />
0,16<br />
0,14<br />
0,12<br />
0,1<br />
0,08<br />
0,06<br />
0,04<br />
0,02<br />
Wel/W<br />
0<br />
ZM2-HR 45<br />
1200 1700 2200 2700 3200 3700 4200 4700 5200<br />
5000<br />
4500<br />
4000<br />
3500<br />
3000<br />
2500<br />
2000<br />
1500<br />
1000<br />
500<br />
HIT [MPa]<br />
0<br />
0<br />
-6.00 -4.00 -2.00 0.00 2.00 4.00 6.00<br />
vzdialenos k osi zvaru [mm]<br />
ZM1-XSG<br />
Zhrubnuté zrno<br />
TOO1<br />
ZK<br />
TOO2-1. as<br />
TOO2-prechod 1. a 2.<br />
TOO2-2. as<br />
TOO2-ZM2prechod<br />
Obr. 9. Priebeh deformácie (princíp C) a HIT po írke telesa PZZ-<br />
1perf<br />
160<br />
140<br />
120<br />
100<br />
80<br />
60<br />
40<br />
20<br />
deformácia [%]<br />
ZM1-XSG<br />
Zhrubnuté zrno<br />
TOO1<br />
ZK<br />
TOO2-1. as<br />
TOO2-prechod 1. a 2.<br />
TOO2-2. as<br />
TOO2-ZM2prechod<br />
ZM2-HR 45<br />
deformácia X<br />
deformácia Y<br />
s152<br />
Deformácie x a y sme stanovili na medzi pevnosti<br />
a v okamihu tesne pred vznikom trhliny (perforáciou plechu).<br />
Na obr. 10 a 11 sú zobrazené závislosti tvrdosti HIT od deformácie<br />
pre jednotlivé skú obné telesá. Priemerné hodnoty<br />
deformácie boli priradené jednotlivým oblastiam zvarového<br />
spoja na základe ich vzdialenosti od osi zvaru. Dosiahnu<br />
rovnakú hodnotu deformácie pri maximálnej sile na dvoch<br />
telesách je ob a né, preto e ahový diagram je na Fmax plochý.<br />
Hodnoty deformácií u PZZ-1 sú preto iné ne u PZZ-2<br />
a závislosti x a y pre jednotlivé telesá v obr. 10 sú rozdielne.<br />
Stav tesne pred perforáciou je definovate ný jednozna nej ie<br />
a pre obe telesá tie ah ie porovnate ný, preto výsledky telies<br />
PZZ-1 a PZZ-2 lep ie súhlasia (obr. 11).<br />
Vz ah medzi HIT a lokálnou deformáciou má lineárny<br />
charakter pre jednotlivé skupiny bodov, obr. 10 a 11.<br />
V rôznych miestach prie neho prierezu skú obného<br />
telesa je rôzna truktúra a teda aj rôzna tvrdos a rôzna schopnos<br />
sa deformova , susedné prierezy sú v ak rovnaké. Deformácia<br />
prie na x pritom nie je po priereze vo svojom rozvoji<br />
obmedzovaná, preto e dva susedné prierezy majú, prechádzajúc<br />
cez ich írku, rovnakú truktúru. Deformáciu pozd nu y<br />
v danom mieste ovplyv uje ale iná deformácia v susednom<br />
mieste toho istého prierezu.<br />
Na medzi pevnosti je mäk í materiál schopný sa viac<br />
rovnomerne deformova v prie nom smere (vä ie hodnoty<br />
x). Pre pozd nu deformáciu y platí opa ne: tvrd í materiál<br />
sa deformoval viac ne materiál mäk í.<br />
Poru enie (perforácia) nastáva na strane materiálu<br />
HR 45 (vi maximum na krivke deformácie Y na obr. 9).<br />
V tom okamihu ostatné asti namáhaného prierezu (rôzne<br />
HIT [MPa]<br />
HIT [MPa]<br />
4500<br />
4000<br />
3500<br />
3000<br />
2500<br />
2000<br />
1500<br />
1000<br />
500<br />
0<br />
Obr. 10. Závislos HIT od deformácie (princíp C) na medzi pevnosti<br />
4500<br />
4000<br />
3500<br />
3000<br />
2500<br />
2000<br />
1500<br />
1000<br />
500<br />
0<br />
PZZ2_Rm-def X<br />
PZZ2_Rm-def Y<br />
PZZ1_Rm-def X<br />
PZZ1_Rm-def Y<br />
0 5 10 15 20 25 30 35<br />
deformácia [%]<br />
PZZ2_perf-def X<br />
PZZ2_perf-def Y<br />
PZZ1_perf-def X<br />
PZZ1_perf-def Y<br />
0 20 40 60 80 100 120 140<br />
deformácia [%]<br />
Obr. 11. Závislos HIT od deformácie (princíp C) pred perforáciou
Chem. Listy 105, s150 s154 (2011) LMV <strong>2008</strong> Regular Lectures<br />
a<br />
b<br />
Obr. 12. Mapy rozlo enia prie nej deformácie (princíp C) pre<br />
PZZ-1; a) x [%] na Rm, b) x [%] pred perforáciou<br />
a<br />
b<br />
XSG<br />
ZVAR<br />
HR 45<br />
Obr. 13. Mapy rozlo enia pozd nej deformácie (princíp C) pre<br />
PZZ-1; a) x [%] na Rm, b) x [%] pred perforáciou<br />
asti zvarového spoja) majú nevy erpanú zásobu svojej plasticity,<br />
a preto je ich príslu ná deformácia men ia, ne by im<br />
prislúchalo v okamihu poru enia.<br />
s153<br />
Tesne pred poru ením (perforáciou) je prie na deformácia<br />
x cca 20 % pre v etky, rôzne tvrdé, oblasti zvarového<br />
spoja. Pre pozd nu deformáciu y platí podobne ako na medzi<br />
pevnosti: tvrd í materiál sa deformoval viac ne materiál<br />
mäk í.<br />
Na obr. 12 a 13 sú znázornené mapy pozd nej a prie -<br />
nej deformácie telesa PZZ-1. Rozlo enie pozd nych deformácií<br />
na medzi pevnosti je homogénne, hodnoty prie nych<br />
deformácií lep ie vizualizujú polohu zvaru. Stupnica na pravej<br />
strane jednotlivých máp nie je rovnaká pre v etky obrázky.<br />
Na PZZ-1 pred perforáciou boli vyhodnotené deforma -<br />
né charakteristiky tromi spôsobmi. Tab. III uvádza porovnanie<br />
maximálnych hodnôt deformácií. Pre porovnanie bolo<br />
vybraté miesto výskytu maximálnej deformácie. Hodnoty x<br />
pre spôsoby A a B sa lí ia o 5 %, pre B a C o 4 % a pre spôsoby<br />
vyhodnocovania C a A sa lí ia o 1,3 %. Hodnoty y pre<br />
spôsoby A a B sa lí ia o 1,3 %, pre B a C o 11 % a pre spôsoby<br />
vyhodnocovania C a A sa lí ia o 12 %.<br />
Tabu ka III<br />
Porovnanie spôsobov výpo tu deformácií<br />
Spôsob x [%] y [%]<br />
Úseky (A) 29,4 155<br />
Elementy (B) 27,9 153<br />
Posunutia (C) 29,0 137<br />
4. Záver<br />
Zvar je v dy potenciálne najslab ím miestom kon trukcie,<br />
preto pozna lokálne vlastnosti jeho jednotlivých oblastí<br />
je dôle ité. Maximálne tvrdosti HIT a HM boli namerané<br />
v tepelne ovplyvnenej oblasti na strane materiálu HR 45. Minimálna<br />
HIT bola nameraná v základnom materiáli XSG. Podiel<br />
Wel/W spo iatku lineárne rastie s HIT a dosahuje maximálne<br />
hodnoty pre oblas HIT = 4000 4500 MPa. al ím<br />
zvy ovaním HIT podiel Wel/W nerastie.<br />
Najvä ia prie na deformácia tesne pred poru ením bola<br />
nameraná v oblasti zhrubnutia feritického zrna (28 %). Poruenie<br />
sa iniciovalo na strane materiálu HR 45, kde bola nameraná<br />
aj maximálna pozd na deformácia (137 %).<br />
Rozvoj deformácie y v ur itej oblasti zvarového spoja<br />
je ovplyv ovaný rozvojom deformácie v susednom mieste<br />
daného prierezu, ktoré má inú truktúru a iné vlastnosti. Na<br />
medzi pevnosti ako aj pred perforáciou rastúca pozd na deformácia<br />
y má za následok nárast tvrdosti HIT. Rozvoj deformácie<br />
x po prie nom priereze skú obného telesa nie je obmedzený<br />
susedným prierezom a preto mäk í materiál je schopný<br />
sa viac deformova . Oblasti zvaru s rôznou tvrdos ou HIT sa<br />
v prie nom smere v okamihu lomu deformujú ( x) rovnako.<br />
Príspevok vznikol pri rie ení projektu VEGA No. 1/4149/07<br />
a APVV 0326 07.<br />
Autori príspevku akujú firme Noble International Senica<br />
s.r.o., ktorá poskytla experimentálny materiál.
Chem. Listy 105, s150 s154 (2011) LMV <strong>2008</strong> Regular Lectures<br />
LITERATÚRA<br />
1. Fischer-Cripps A. C.: Nanoindentation. Springer, New<br />
York 2002.<br />
2. Gazdag ., Pe ek L.: Dehnungsfelder und Lokalisation<br />
der Dehnungen in dünnen Stahlblechen, 13, Internationaler<br />
Studententag der Metalurgie, Leoben 2005, s. 149 156.<br />
3. Spinka O.: Videoextensometer ME46, Messphysik Laborgeräte,<br />
GmbH, Fürstenfeld 2000.<br />
4. Pe ek L., Vadasová Z., In: Lokální mechanické vlastnosti<br />
2006 , Plze Ne tiny, 8.-10. 11. 2006, Z U<br />
v Plzni, s. 126 133.<br />
. Ambri ko a , T. Kandra b , and L. Pe ek a ( a Technical<br />
university of Ko ice, Faculty of metallurgy, Department of<br />
material science, b KOVOHUTY, a.s., Krompachy, Slovakia):<br />
Evaluation of Indentation and Deformation Characteristics<br />
of Laser Welds<br />
Two progressive methods were used for evaluation of<br />
indentation and deformation characteristics of laser welds.<br />
Depth sensing indentation techniques (DSI) is used for determination<br />
of local mechanical properties of laser welds. Mechanical<br />
properties such as indentation hardness (HIT), Martens<br />
hardness (HM), total indentation energy (W), elastic<br />
indentation energy (Wel) and plastic indentation energy (Wpl)<br />
for each individual regions of the weld had been established.<br />
Videoextensometry was used to determine longitudinal and<br />
transversal components of the normal strain. Relations between<br />
indentation and deformation characteristics had been<br />
established.<br />
s154
Chem. Listy 105, s155 s158 (2011) LMV <strong>2008</strong> Regular Lectures<br />
SIMULÁCIE ECAP PROCESU ZLIATINY EN AW 2014 POMOCOU MKP<br />
JANA BIDULSKÁ a , RÓBERT<br />
KO I KO a , TIBOR KVA KAJ a ,<br />
RÓBERT BIDULSKÝ b a MARCO ACTIS<br />
GRANDE b<br />
a Katedra tvárnenia kovov, Hutnícka fakulta, Technická univerzita<br />
v Ko iciach, 042 00, Ko ice, Slovensko, b Politecnico<br />
Torino, Alessandria Campus, 15 100, Alessandria, Italy<br />
jana.bidulska@tuke.sk, robert.kocisko@tuke.sk,<br />
tibor.kvackaj@tuke.sk, robert.bidulsky@polito.it<br />
K ú ové slová: Al zliatina, mechanické vlastnosti, ECAP,<br />
MKP, DEFORM 2D<br />
1. Úvod<br />
Equal Channel Angular Pressing (ECAP) pretla ovanie<br />
cez kanál rovnakého prierezu je pomerne jednoduchá SPD<br />
(Severe Plastic Deformation) metóda na získavanie UFG<br />
(Ultra Fine Grain) truktúry na úrovni 70 500 nm (cit. 1 ). Táto<br />
metóda, ktorú v roku 1977 vyna iel Segal 2 , je schématicky<br />
zobrazená na obr. 1. Princíp tejto spracovate skej metódy<br />
spo íva v pretla ovaní vzorky cez peciálnu matricu, ktorá<br />
obsahuje dva navzájom sa krí iace kanály (vertikálny a horizontálny)<br />
rovnakého prierezu. ECAP matrica je definovaná:<br />
priemerom, uhlom uhol medzi kanálmi, ktorý sa naj astej<br />
ie pohybuje od 90° do 120° a uhlom uhol na vonkajom<br />
rohu matrice. Efektívna deformácia po N prechodoch sa<br />
po íta pod a vz ahu (1):<br />
N<br />
2 N<br />
. cot<br />
3<br />
kde N je po et pretla ení, uhol medzi kanálmi.<br />
V sú asnej dobe, v aka rýchlo rozvíjajúcej sa výpo tovej<br />
technike sa vo ve kej miere pou ívajú softvérové produkty<br />
pre analýzu tvárniacich procesov. Tie nám poskytujú lokálne<br />
detailné informácie o priebehu plastickej deformácie<br />
v materiáli, týkajúce sa distribúcie deformácie, rýchlosti deformácie,<br />
napätí, ako aj informácie o vonkaj om za a ení<br />
tvárniacich nástrojov. Na matematické simulácie sa pou ívajú<br />
rôzne softvérové produkty, ako napr. Ansys, Forge, Marc,<br />
SuperForm, SuperForge a Deform. Softvérový produkt Deform<br />
2D a Deform 3D (cit. 3 ), je zalo ený na MKP (Metóda<br />
Kone ných Prvkov). Deform 2D je vhodný na rie enie osovo<br />
symetrických úloh v oblasti ve kých objemových plastických<br />
deformácií. Umo uje súhrn interakcií medzi deformáciou,<br />
tepelným spracovaním, transformáciami a difúziou. Vhodným<br />
nástrojom, ktorý predstavuje ve kú výhodu oproti iným spomenutým<br />
simula ným produktom, je automatický generátor<br />
siete (AGS). Najdôle itej í vstupný údaj pre matematickú<br />
simuláciu tvárneného materiálu je napä ovo-deforma ná kriv-<br />
(1)<br />
s155<br />
ka ( - ), od ktorého závisí presnos výpo tu. Tento údaj je<br />
mo né pou i bu z programovej databázy, alebo<br />
z experimentálne stanovenej krivky - . Experimentálne krivky<br />
- sa získavajú z laboratórnych skú ok tvárnite nosti:<br />
ahom, krutom, resp. tlakom.<br />
Predmetom príspevku je porovnanie výsledkov matematických<br />
simulácií ECAP procesu materiálu EN AW 2014,<br />
ktorého krivky spevnenia boli do programu Deform 2D implementované<br />
pomocou výberu krivky - z programovej<br />
databázy a experimentálne stanovenej závislosti - .<br />
2. Materiál a experimentálne metodiky<br />
1mm<br />
Obr. 1. Geometria ECAP matrice s detailom na hustotu siete<br />
Pre experimentálne túdium bola pou itá hliníková zliatina<br />
EN AW 2014.<br />
Boli pou ité nasledovné experimentálne metodiky:<br />
experimentálna závislos - pre materiál EN AW 2014<br />
bola získaná po aplikácii nasledovného tepelnedeforma<br />
ného cyklu:<br />
valcovanie vstupného materiálu za tepla na laboratórnej<br />
valcovacej stolici DUO 210 pri teplote 460 °C,<br />
tepelné spracovanie: rozpú acie íhanie pri teplote<br />
520 °C s asom výdr e 2,5 h, s následným kalením<br />
do vody.<br />
Statická skú ka v ahu bola realizovaná na zariadení FP 100/1<br />
pri rýchlosti za a enia v = 0,15 mm min 1 , o zodpovedá<br />
rýchlosti deformácie = 2,5 10 4 s 1 , v súlade s STN 420310<br />
(STN EN 10002-1).<br />
matematické simulácie v SW produkte DEFORM 2D.<br />
Geometria ECAP matrice pre simuláciu je zobrazená na<br />
obr. 1. Pozostáva z kruhového kanála s priemerom = 10 mm,
Chem. Listy 105, s155 s158 (2011) LMV <strong>2008</strong> Regular Lectures<br />
uhla medzi kanálmi = 90°, vonkaj ím polomerom R =<br />
5 mm a vnútorným polomerom r = 0 mm. Vzorka bola v tvare<br />
ty e s priemerom = 10 mm o d ke l = 60 mm. D ka t a<br />
bola lt a = 105 mm, ktorý mal v procese pretla ovania kontantnú<br />
rýchlos 1 mm s 1 . Trecie podmienky medzi jednotlivými<br />
objektmi boli definované pod a Coulomba,<br />
s koeficientom trenia f = 0,12. Teplota pretla ovania bola 20 °C.<br />
Oblasti rie enia úlohy ECAP zariadenia (matrica, t<br />
a pretla ovaná vzorka) boli popísané kone noprvkovou sie ou<br />
v tvare tvoruholníkov. Hustota siete ur uje presnos výpo tu<br />
a as výpo tu. Ak je objekt popísaný ve mi malým po tom<br />
elementov, tak výpo et je z h adiska strojového asu krátky,<br />
ale presnos výpo tu je ve mi malá. Naopak, ak je hustota<br />
siete príli vysoká, strojový as sa nieko konásobne pred i,<br />
Tabu ka I<br />
Materiálové charakteristiky vzorky a nástrojov<br />
410<br />
340<br />
270<br />
200<br />
130<br />
60<br />
Obr. 2. - krivky spevnenia<br />
Vzorka Databáza Experiment<br />
Plastické údaje z - kriviek<br />
Elastické<br />
Tepelné<br />
Youngov modul, MPa 68900 70000<br />
Poissonova kon tanta<br />
0 0,1 0,2 0,3<br />
Deformácia<br />
0,33 0,33<br />
teplotná expanzia, K 1 2,2 10 5 2,2 10 5<br />
tepelná vodivos ,<br />
kW m 1 K 1 180,2 180,2<br />
tepelná kapacita,<br />
kJ kg 1 K 1 2,433 2,433<br />
Kritérium poru enia Cockcroft-Latham<br />
experimentálne<br />
stanovená krivka<br />
krivka získana zo<br />
sofverovej databázy<br />
s156<br />
pri om presnos výpo tu je zbyto ne vysoká. Vzh adom na<br />
geometriu a ve kos jednotlivých objektov je potrebné zvoli<br />
optimálnu hustotu siete. Vzh adom na as výpo tu a jeho<br />
presnos autori 4 6 odporú ajú, e je posta ujúce vzorku<br />
s priemerom = 10 mm popísa pribli ne 20 elementmi.<br />
V simulovanom prípade bola vzorka s priemerom = 10 mm<br />
a d ke l = 60 mm pokrytá pomocou 3000 elementov, o predstavuje<br />
28 elementov na priemer vzorky, ako je to<br />
v detailnom zábere vidie na obr. 1. Na sty ných plochách<br />
bola sie zhustená, o umo nilo lep ie popísa zlo itú geometriu<br />
napr. v oblasti polomerov.<br />
Nástroje ECAP zariadenia, t.j. matrica a t boli<br />
v matematickej simulácii popísané ako elastické objekty,<br />
ktorým bola priradená materiálová charakteristika nástrojovej<br />
ocele. Materiálová charakteristika nástrojovej ocele vysoko<br />
prevy uje materiálovú charakteristiku tvárneného materiálu.<br />
Vzorka bola popísaná ako elasto-plastický objekt, ktorého<br />
materiálové charakteristiky sú: Rp0,2 = 157 MPa, krivka - ,<br />
Youngov modul pru nosti a tepelné vlastnosti.<br />
Výsledky matematických simulácii ECAP procesu na<br />
materiáli EN AW 2014 boli porovnávané na základe dvoch<br />
prístupov pre vo bu krivky - : krivka vybratá z programovej<br />
databázy pod a normy EN a krivka dosadená z experimentálnych<br />
skú ok. Priebeh obidvoch kriviek - je zobrazený na<br />
obr. 2, z ktorého vyplýva rozdiel v hodnotách napätí. V tab. I<br />
sú uvedené materiálové charakteristiky oboch vzoriek.<br />
3. Analýza dosiahnutých výsledkov<br />
Rozlo enie intenzity plastickej deformácie po jednom<br />
ECAP prechode pre obe sledované materiálové charakteristiky<br />
je zobrazené na obr. 3.<br />
Na obr. 3 vidie , e intenzita plastickej deformácie je<br />
nerovnomerne rozlo ená po prie nom priereze aj po d ke<br />
vzorky. Po d ke vzorky je mo né intenzitu plastickej deformácie<br />
rozdeli do troch základných oblastí: hlava nerovno-<br />
Obr. 3. Distribúcia a intenzita plastickej deformácie vo vzorke<br />
pre: a) materiál definovaný z databázy, b) materiál definovaný na<br />
základe experimentálne stanovenej krivky -
Chem. Listy 105, s155 s158 (2011) LMV <strong>2008</strong> Regular Lectures<br />
a<br />
b<br />
Obr. 4. Distribúcia intenzity plastickej deformácie po prie nom<br />
priereze vzorky v 550. výpo tovom kroku pre: a) materiál definovaný<br />
z databázy, b) materiál definovaný na základe experimentálne<br />
stanovenej - krivky<br />
mernos deformácie je spôsobená nerovnomerným tokom<br />
materiálu pri prechode z vertikálneho kanála do horizontálneho,<br />
telo ustálený stav plastickej deformácie, päta nerovnomernos<br />
deformácie je spôsobená neúplným pretla ením<br />
vzorky cez kanál. Nerovnomernos intenzity plastickej deformácie<br />
sa najviac koncentruje do spodnej asti vzorky. Podobné<br />
výsledky boli dosiahnuté aj v iných prácach 4 7 . Materiálové<br />
vlastnosti po ECAP spracovaní sa výlu ne robia len<br />
z oblasti tela.<br />
Na obr. 4 je zobrazená distribúcia intenzity plastickej<br />
deformácie po prie nom priereze vzorky v 550. výpo tovom<br />
kroku (v ustálenom pásme plastickej deformácie) pre obidve<br />
sledované materiálové charakteristiky.<br />
Lokálne zmeny v distribúcii plastickej deformácie sú<br />
s157<br />
pozorované len v ovlasti dolného polomeru, kde v hbke<br />
1 mm pod povrchom vzorky je rozdiel efektívnej deformácie<br />
0,1. To znamená, e vstupné údaje napä ovo-deforma ných<br />
kriviek nemajú podstatný vplyv na distribúciu a intenzitu<br />
plastickej deformácie po prie nom priereze.<br />
Na obr. 5 je zobrazená distribúcia intenzity rýchlosti<br />
plastickej deformácie pre obidve sledované materiálové charakteristiky.<br />
Rýchlos deformácie vymedzuje oblas plastickej<br />
deformácie resp. zónu plastickej deformácie (ZPD) 6 . Na<br />
obr. 5 jednozna ne vidie , e rýchlos plastickej deformácie<br />
je sústredená v úzkom pásme v zóne plastickej deformácie<br />
(ZPD). Dôle itos ZPD z h adiska rozlo enia plastickej deformácie<br />
po celej vzorke potvrdili aj autori 4,5 . Lokálne zmeny<br />
z h adiska porovnania obidvoch sledovaných materiálov sú<br />
evidentné aj v závislosti na rýchlosti deformácie. Rýchlos<br />
deformácie je rozdielna v kroku 550, kde v materiáli z databázy<br />
bolo dosiahnuté v oblasti vnútorného polomeru rýchlosti<br />
deformácie vy ej o 29 %, v porovnaní s druhým prípadom.<br />
Tento rozdiel u nie je mo né zanedba .<br />
Na obr. 6 je zachytený vývoj teploty v ECAP procese.<br />
Z obr. 6 vyplýva nárast teploty v priebehu procesu z pôvodnej<br />
teploty okolia na 35,5 °C pre materiál definovaný z databázových<br />
údajov a na 46 °C pre materiál s experimentálne stanovenou<br />
materiálovou charakteristikou. Nárast teploty súvisí<br />
a<br />
b<br />
Obr. 5. Distribúcia intenzity rýchlosti plastickej deformácie po<br />
prie nom priereze vzorky v 550. výpo tovom kroku: a) materiál<br />
definovaný z databázy, b) materiál definovaný na základe experimentálne<br />
stanovenej krivky -
Chem. Listy 105, s155 s158 (2011) LMV <strong>2008</strong> Regular Lectures<br />
a<br />
b<br />
Obr. 6. Vývoj deforma ného tepla a ohrev tvárniacich nástrojov<br />
pre: a) materiál definovaný z databázy, b) materiál definovaný<br />
na základe experimentálne stanovenej krivky -<br />
s premenou asti práce plastickej deformácie na teplo. Rozdiel<br />
teplôt závisí na krivkách spevnenia, reprezentuje nezanedbate<br />
ný vplyv, av ak teplota vzorky ani v jednom prípade<br />
nedosiahla úrove nástupu uzdravovacích procesov skúmaného<br />
materiálu. V simulácii sa uva ovalo aj s prestupom tepla,<br />
ím mô eme sledova aj ohrev tvárniacich nástrojov, tak ako<br />
to vidie na uvedenom obrázku. Teplota tvárniaceho nástroja<br />
by nemala presiahnu jeho popú taciu teplotu.<br />
4. Záver<br />
Detailný rozbor výsledkov simulácie ECAP procesu<br />
s158<br />
hliníkovej zliatiny EN AW 2014 pomocou simula ného programu<br />
DEFORM 2D ukázal, e z h adiska predikcie jednotlivých<br />
premenných po as tvárnenia materiálu bol v niektorých<br />
prípadoch (intenzita rýchlosti plastickej deformácie a teploty)<br />
zna ný rozdiel, ak bol materiál zadaný zo softvérovej databázy,<br />
alebo definovaný na základe experimentálne stanovenej<br />
krivky - . Spôsobené zmeny sa mô u vysvetli lep ím poznaním<br />
materiálových charakteristík zo skú ky ahom, pretoe<br />
materiál v sebe nesie v etky stopy predchádzajúcich technologických<br />
operácií a pou itie údajov z programu DEFORM<br />
2D nemusí v plnej miere zodpoveda experimentálnemu materiálu.<br />
Z tohto dôvodu je nevyhnutné pri simulácii procesu<br />
vychádza z poznania materiálových charakteristík, ktoré sa<br />
získajú pomocou laboratórnych skú ok.<br />
Autori akujú agentúre APVV (Projekt APVV-20-027205) za<br />
podporu.<br />
LITERATÚRA<br />
1. Kva kaj T., Zemko M., Kuskuli T., Ko i ko R., Besterci<br />
M., Dobatkin S.V., Molnárová M.: High Temp. Mater.<br />
Process. 26, 147 (<strong>2007</strong>).<br />
2. Segal V. M., Reznikov V. I., Drobyshevskiy A. E., Kopylov<br />
V. I.: Russian Metal. 1, 99 (1981).<br />
3. Kva kaj T.: Acta Metallurgica Slovaca 2, 160 (2002).<br />
4. Kva kaj T., Zemko M., Ko i ko R., Kuskuli T., Pokorný<br />
I., Besterci M., Sulleiová K., Molnárová M., Ková ová<br />
A.: Kovove Mater. 45, 249 (<strong>2007</strong>).<br />
5. Ko i ko R., Zemko M., Kuskuli T., Kva kaj T., Kováová<br />
A.: Acta Metallurgica Slovaca 13, 397 (<strong>2007</strong>).<br />
6. Li S., Bourke M. A. M., Beyerlein I. J., Alexander D. J.,<br />
Clausen B.: Mater. Sci. Eng. 382 A, 217 (2004).<br />
7. Leo P., Cerri E., De Marco P. P., Roven H. J.: J. Mater.<br />
Proc. Techn. 182, 207 (<strong>2007</strong>).<br />
J. Bidulská a , R. Ko i ko a , T. Kva kaj a , R. Bidulský b ,<br />
and M. Actis Grande b ( a Department of Metals Forming,<br />
Faculty of Metallurgy, Technical University of Ko ice,<br />
Ko ice, Slovakia b Politecnico Torino, Alessandra Campus,<br />
Alessandria, Italy): Simulations of ECAP Process of EN<br />
AW 2014 Using FEM<br />
The finite element method (FEM) is a proven and reliable<br />
technique for analyzing various forming processes, including<br />
heat treament and ECAP. The plastic deformation<br />
behaviour of the materials during the ECAP process with<br />
a round die corner angle (90°) and a frictionless condition was<br />
investigated using the commercial two-dimensional rigidplastic<br />
finite element code (DEFORM 2D). The main aim of<br />
the present work were provided information concerning the<br />
distribution of effective strains, strain rates, effective stresses<br />
and temperatures in the EN AW 2014 material.
Chem. Listy 105, s159 s162 (2011) LMV <strong>2008</strong> Regular Lectures<br />
IMPROVED FATIGUE RESISTANCE OF SINTERED STEELS VIA LOCAL<br />
HARDENING<br />
RÓBERT BIDULSKÝ a , MARCO ACTIS<br />
GRANDE a , and MARGITA KABÁTOVÁ b<br />
a Politecnico Torino, Alessandria Campus, 15100<br />
Alessandria, Italy, b Institute of Materials Research, Slovak<br />
Academy of Sciences, 040 11Ko ice, Slovakia<br />
robert.bidulsky@polito.it, actis.grande@polito.it,<br />
mkabatova@imrnov.saske.sk<br />
Key words: prealloyed sintered steel, shot peening, fatigue,<br />
fracture<br />
1. Introduction<br />
The current status of powder metallurgy marked demands<br />
for either a reduction of costs or a sensible increase in<br />
properties. This concept applies, especially in the automotive<br />
sector, where the average weight of PM parts per car is now<br />
nearly 10 kg and a growth of 37 % is assumed to be reached<br />
in 10 years 1 . The increase of properties could affect the design<br />
as well as the customer´s demands but can be obtained only<br />
through new tendency and technological innovation and/or<br />
through the application of either new or adapted solutions.<br />
Modification of density and microstructure, via classical<br />
route as pressing and sintering, can be successfully achieved<br />
for the fatigue limits of powder metallurgy steels at about<br />
300 MPa average 2 , this means that secondary operations are<br />
generally necessary to reach the higher fatigue properties. If<br />
compared to wrought steels 3 5 , fatigue behavior of sintered<br />
steels is more complicated and depends on some factors related<br />
to sintered microstructures, such as pore agglomerates 6 .<br />
Fatigue properties of sintered steels depend on plasticity and<br />
strength of microstructures, as well as porosity. The pores act<br />
as crack initiators, the distribution of stress is inhomogeneous<br />
across the cross section of the investigated material and reduces<br />
the effective load bearing area. Both the morphology<br />
and distribution of pores have a significant effect on the mechanical<br />
behavior of powder metallurgy steels. Two types of<br />
porosity are typically observed in sintered materials 7,8 : interconnected<br />
and isolated porosity. Interconnected porosity has<br />
more pronounced effect on properties than isolated porosity.<br />
Relationship to strength is expressed by ratio between fatigue<br />
strength and tensile strength. Ratio between fatigue strength<br />
and tensile strength, C/Rm, is close to 0.38 (ref. 9 ).<br />
A suitable modification of functional surfaces may determine<br />
a sensible upgrade in the required properties of low<br />
alloyed steel. Shot peening is an industrial process often used<br />
to improve the component properties 10 13 , especially fatigue<br />
life and fatigue strength.<br />
In powder metallurgy area, shot peening is a relatively<br />
new technological solution for higher strength sintered materials,<br />
especially in fatigue performance. Nakazawa et al. 14<br />
tested the sub gear (in order to replace forging by powder<br />
s159<br />
metallurgy) through the addition of the shot peening operations;<br />
the bending fatigue strength (parts were tested using<br />
test rig and motored engine test) was improved by 30 %. Additional<br />
researchers evaluated results Ancorsteel 1000 B with<br />
2 % copper and 0.9 % graphite and showed that by optimising<br />
the controlled shot peening parameters, the endurance limit of<br />
sintered steel powder metal alloys can be raised by 16 % and<br />
22 % (ref. 15 ). Automotive components such as gears, sprockets<br />
and connecting rods are excellent candidates for powder<br />
metallurgy and controlled shot peening.<br />
The aim of this work is to determine the effect of local<br />
hardening cause by surface modification on the fatigue failure<br />
resistance. Fatigue strength was evaluated by Wöhler curves<br />
for the plane bending fatigue tests on unnotched specimens of<br />
as-sintered and shot peened alloys.<br />
2. Material and experimental procedure<br />
Commercially pre-alloyed water-atomised Höganäs Fe-<br />
(Cr, Mo) powder (Astaloy CrL, which contains 1.5 % Cr and<br />
0.2 % Mo) was used as base material. The other commercial<br />
raw materials were CR 12 graphite powder and HW wax<br />
powder as lubricant. Graphite was added in mixture as 0.5 %<br />
and 0.7 %. Final powder mixtures were homogenized in<br />
a Turbula mixer. Two different specimen types, compacted at<br />
600 MPa to a green density of ~7.0 g cm 3 , were prepared:<br />
dog-bone tensile (ISO 2740) and fatigue (ISO 3928) specimens.<br />
Formulation and processing parameters of the tested<br />
alloys are presented in Table I.<br />
Sintering was carried out in laboratory tube furnace in an<br />
atmosphere of pure gases 75 % N2 + 25 % H2. The sintering<br />
temperature was 1180 °C for 60 minutes. Heating and cooling<br />
rates were 10 °C min 1 . The surface modifications were carried<br />
out on laboratory testing apparatus. Parameters of testing<br />
apparatus were steel granulate S11 with diameter dz =<br />
0.6 mm, angle between shot stream and peened surface 90°,<br />
shot velocity v7000 = 71 m s 1 . Specimens were tested in static<br />
tensile test on a ZWICK 1387 machine, extension<br />
rate = 0.1 mm min 1 . Fatigue tests were carried out in symmetric<br />
plane bending at R = 1, using SCHENCK PWON<br />
testing apparatus. The maximum cycle number was 10 7 .<br />
Batches of 15 specimens were tested.<br />
Table I<br />
Formulation and processing parameters<br />
Material State Sintering<br />
[°C min 1 ]<br />
Astaloy CrL + 0.5C as-sintered 1180 / 60<br />
Astaloy CrL + 0.5C shot-peened 1180 / 60<br />
Astaloy CrL + 0.7C as-sintered 1180 / 60<br />
Astaloy CrL + 0.7C shot-peened 1180 / 60
Chem. Listy 105, s159 s162 (2011) LMV <strong>2008</strong> Regular Lectures<br />
The profile surface roughness, Ra, was measured by<br />
Hommel Tester T1000 profilometer.<br />
Light and scanning microscopy were employed for microstructural<br />
evaluations. For optical microscopy, samples<br />
were individually mounted, mechanically polished and finally<br />
etched at room temperature using a Nital reagent. Scanning<br />
microscopy was carried out using SEM JEOL 7000F.<br />
3. Results and discussions<br />
3.1. Surface roughness<br />
The implementation of plastic deformation via shot<br />
peening caused profile unevenness. The profile unevenness<br />
was expressed by the arithmetical mean deviation of the profile<br />
surface roughness; Ra. The profile surface roughness is<br />
the average arithmetical deflection of all unevenness from the<br />
central line in the measured length 16 18 . The average results<br />
from 5 measurements of the profile surface roughness are<br />
presented in Table II.<br />
Table II<br />
Average values of surface roughness<br />
Material State Ra [ m]<br />
Astaloy CrL + 0.5C as-sintered 1.31 ± 0.17<br />
Astaloy CrL + 0.5C shot-peened 7.56 ± 0.23<br />
Astaloy CrL + 0.7C as-sintered 1.32 ± 0.19<br />
Astaloy CrL + 0.7C shot-peened 7.21 ± 0.21<br />
3.2. Properties and microstructures<br />
Mechanical properties of prealloyed sintered Astaloy<br />
CrL steels are presented in Fig. 1.<br />
Fig. 1. Mechanical properties of investigated materials<br />
The<br />
s160<br />
Fig. 2. S-N diagram for Astaloy CrL + 0.5 C steels<br />
Fig. 3. S-N diagram for Astaloy CrL + 0.7 C steels<br />
S-N curves of investigated materials are presented in Fig. 2<br />
and 3.<br />
Prealloyed Astaloy CrL with 0.7 % C is a material with<br />
good combination of mechanical properties and fatigue<br />
strength. The observed rankings in fatigue strength of the assintered<br />
and shot peened states are readily explained by the<br />
different microstructures due to different processing conditions.<br />
Microstructure of Astaloy CrL with 0.5 % C consist of<br />
mainly fine pearlite with areas of ferrite and bainite, Fig. 4.
Chem. Listy 105, s159 s162 (2011) LMV <strong>2008</strong> Regular Lectures<br />
Fig. 4. The representative microstructure of Astaloy CrL + 0.5 C<br />
Fig. 5. The representative microstructure of Astaloy CrL + 0.7 C<br />
The microstructure of Astaloy CrL with 0.7 % C consist<br />
of predominate upper bainite with small areas of pearlite,<br />
Fig. 5.<br />
3.3. Local hardening<br />
The detailed research of local area showed that the effects<br />
of local hardening caused by surface modification via<br />
shot peening exhibit higher hardness. Microhardness profiles,<br />
Fig. 6, confirmed the important role of microstructure constituents.<br />
The presence of bainite in specimens with higher<br />
graphite contents exhibited higher value of microhardness<br />
(the blank circle); on the other hand, the dominant presence of<br />
fine pearlite determined lower microhardness in the range<br />
HV 0.025 = 200 250. The highest microhardness values located<br />
at average value of 25 m from outer surface. This corresponds<br />
to the details focused on local hardened area.<br />
s161<br />
Fig. 6. Microhardness profiles of shot peened specimens<br />
The modification of functional surfaces of investigated<br />
steels increased the mechanical and fatigue properties by<br />
means of stronger segments on the surfaces of specimens due<br />
to something close to a fully densified surface layer, as well<br />
as by the elimination of the detrimental effect of pores near<br />
the surface; the result was the decrease of crack propagation,<br />
Fig. 7.<br />
On the other hand, the creation of a rough surface<br />
(represented by values of Ra) and notch production increasing<br />
strain localization caused the formation of local distribution<br />
secondary cracks, thus decreasing the tensile strength. The<br />
role of weak interfaces seems to be considered as a significant<br />
factor. Mechanical properties are controlled by the mechanisms<br />
of fracture in sintering necks. Characteristic for a duc-<br />
Fig. 7. Detail of local hardened area
Chem. Listy 105, s159 s162 (2011) LMV <strong>2008</strong> Regular Lectures<br />
tile fracture are the nucleation, coalescence and growth of<br />
voids within the sintering necks. Such voids are often nucleated<br />
at small brittle inclusions in the neck region. Shot peening<br />
has positive effect for fatigue endurance but it has also<br />
been demonstrated than negative results may arise 19,20 . It is<br />
therefore important, in the future, to evaluate the parameters<br />
of shot peening.<br />
4. Conclusion<br />
The detailed research of local area has showed that the<br />
effect of local hardening causes by shot peening exhibits nonuniform<br />
distribution. The modification of functional surfaces<br />
of investigated steels increased mechanical and fatigue properties<br />
by means of stronger segments on the surfaces of specimens<br />
due to something close to a fully densified surface layer,<br />
as well as by the elimination of the detrimental effect of pores<br />
near the surface. The number and distribution of such inclusions<br />
might control the final mechanical properties. Further<br />
research in this area may lead eventually to the publication of<br />
a design specification for sintered shot peened components.<br />
Controlled shot peening seems to be most effective on higher<br />
hardness and higher density powder metallurgy components.<br />
R. Bidulský thanks the Politecnico di Torino, the Regione<br />
Piemonte, and the CRT Foundation for co-funding by the<br />
fellowship.<br />
REFERENCES<br />
1. Cremer I.: EURO Powder Metallurgy <strong>2007</strong>, Toulouse,<br />
15.-17. 10. <strong>2007</strong>, EPMA, Shewsbury, <strong>2007</strong>, (without ed.)<br />
p. 1, (Plenary lecture).<br />
2. Technical trends: Met. Powder Rep. 59, 26 (2004).<br />
3. Nový F., Pal ek P., Chalupová M.: Kovove Mater. 43,<br />
447 (2005).<br />
4. Nový F., in ala M., Kopas, P., Bok vka O.: Mater. Sci.<br />
Eng., A 462, 189 (<strong>2007</strong>).<br />
5. Nový F., Petrenec M.: Letná kola únavy materiálov<br />
<strong>2008</strong>, ilina-O adnica, 8.-12.9.<strong>2008</strong>, (Bok vka O., ed.),<br />
p. 10 (lecture). EDIS, ilina <strong>2008</strong>.<br />
6. Moon J. R.: Powder Metall. Progr. 2, 63 (2002).<br />
7. Khorsand H., Yoozbashizade H., Habibi S. M., Janghorban<br />
K., Nangir A., Rethani S. M. S.: Met. Powder<br />
Rep. 57, 32 (2002).<br />
s162<br />
8. Bacova V., Draganovska D.: Mater. Sci. 40, 125 (2004).<br />
9. Mihaliková M., Bur ák M., Miche J., Kovalová K.: J.<br />
Metals, Mater. Minerals 15, 53 (2005).<br />
10. Kniewald D., Brezinová J., Guzanová A.: Communications<br />
6, 37 (2004).<br />
11. Bur ák M., Mamuzi I., Mihaliková M.: Metalurgija 43,<br />
101 (2004).<br />
12. Menapace C., Messner C., Costa P., Straffelini G., Molinari<br />
A.: Powder Metall. Progr. 2, 18 (2002).<br />
13. O´Brien R. C.: Met. Powder Rep. 43, 744 (1988).<br />
14. Nakazawa K., Nagata T., Motooka N.: Powder<br />
Metallurgy 2006 World Congress, Bexco Busan, Korea,<br />
24-29. 9. 2006, (Eun K. Y., Kim Y. S., ed.) p. 756<br />
(extended abstract).<br />
15. Technical trends: Met. Powder Rep. 59, 48 (2004).<br />
16. Bidulská J., Kva kaj T., Bodák V.: Hutnicke Listy 57, 11<br />
(2002).<br />
17. Bidulská J., Kva kaj T., Bodák V., Raku iak R.: Acta<br />
Metallurgica Slovaca 8, 211 (2002).<br />
18. Bidulská J., Kva kaj T., Bodák V.: Ocelové pásy 2001,<br />
Ostrava, 25.-27. 9. 2001, Ro nov pod Radho t m,<br />
Czech, (Bo uta J., Ki a M., Ková J., Ku e F., ed.),<br />
p. 187 (lecture).<br />
19. Nový F., Chalupová M., in ala M., Bok vka O.: Acta<br />
Mechanica Slovaca 11, 189 (<strong>2007</strong>).<br />
20. Mihaliková M., Kovalová K., Miche J.: Materiálové<br />
In inierstvo 11, 13 (2004).<br />
R. Bidulský a , M. Actis Grande a , and M. Kabátová b<br />
( a Politecnico Torino, Alessandria Campus, Alessandria,<br />
Italy, b IMR SAS, Kosice, Slovakia): Improved Fatigue Resistance<br />
of Sintered Steels Via Local Hardening<br />
The aim at the present paper was to find out how the<br />
local hardening via surface modification and also microstructures<br />
affect the fatigue characteristics of the considered sintered<br />
materials. Two different systems were prepared: assintered<br />
and shot peened prealloyed sintered (Astaloy CrL<br />
based) steels with addition of 0.5 and 0.7 % C. Fatigue tests<br />
were carried out in symmetric plane bending at R= 1. The<br />
detailed research of local area showed local hardening caused<br />
by surface modification via shot peening. Local hardening<br />
exhibit positive effect on the fatigue failure resistance, due to<br />
a surface something close to a fully densified surface layer<br />
obtained by shot peening, as well as by the elimination of the<br />
detrimental effect of pores near the surface.
Chem. Listy 105, s163 s166 (2011) LMV <strong>2008</strong> Regular Lectures<br />
INVESTIGATION OF LOCAL MECHANICAL PROPERTIES OF ZIRCONIUM<br />
ALLOYS USING NANOINDENTATION<br />
OLGA BLÁHOVÁ<br />
New Technology Research Centre, University of West Bohemia,<br />
Univerzitní 8, 306 14, Czech Republic<br />
blahova@ntc.zcu.cz<br />
Key words: Zr alloys, LOCA, Nanoindentation<br />
1. Introduction<br />
Zirconium alloys are used in nuclear industry, mainly<br />
because of their low thermal neutron cross section, for their<br />
good mechanical properties and corrosion resistance. These<br />
alloys are widely used in production of nuclear fuel cladding<br />
tubes serving as the first barrier between the fuel and the surrounding<br />
environment. Zirconium shows high affinity to hydrogen,<br />
oxygen and nitrogen, forming stable hydrides, oxides,<br />
nitrides and interstitial solid solutions. The presence of oxygen<br />
and hydrogen has great influence on properties of the<br />
microstructure. Oxygen stabilizes the phase, enlarges the<br />
domain in the phase diagram and causes interstitial solid<br />
solution forming. Hydrogen stabilizes the phase, causes<br />
higher solubility of oxygen in Zr at temperatures between<br />
800 1200 °C, influences the redistribution of oxygen and<br />
causes the decrease of transformation temperature.<br />
The problem of oxide peeling on pure Zr is solved by the<br />
addition of suitable alloying elements Cr, Fe, Ni (stabilizing<br />
the phase), which do not dissolve in the zirconium matrix<br />
and form small inclusions of intermetallic phases. Addition of<br />
Sn (stabilizing the a phase) reduces the adverse effect of nitrogen.<br />
Zirconium alloys were developed in this way, having<br />
coherent oxide layer, which do not have tendency to peel. In<br />
order to improve mechanical and corrosion properties, other<br />
alloy elements can also be added: Al (stabilizing the phase),<br />
Nb, Cu, V and Mo (stabilizing the phase). High corrosion<br />
resistance is attained by softening the structure with soft precipitates<br />
of -Nb on grain boundaries and also in the matrix.<br />
During the fuel cycle in water-cooled reactors, the outer<br />
region of the cladding tube is in contact with the cooling medium<br />
(water) with the temperature of 320 °C and pressure of<br />
16 MPa. During the operation, oxidation of Zr occurs and<br />
hydrogen is released (part of it is absorbed into the alloy). The<br />
forming oxide creates a barrier between metal and water and<br />
slows corrosion rate. Improvement in physical, mechanical,<br />
technological and corrosion properties requires development<br />
of new alloys offering longer fuel burn up cycle, a possibility<br />
to use higher quality fuel and enhanced safety.<br />
Loss of coolant accident (LOCA) can occur in watercooled<br />
reactors when, due to a broken pipe, water flows out.<br />
The loss of moderator occurs within ten seconds or less and<br />
the nuclear fission stops immediately. Temperature of the<br />
cladding increases to approximately 1000 °C, which results in<br />
s163<br />
high temperature oxidation (HTO). The reaction between<br />
steam and cladding surface occurs. The reactor emergency<br />
system floods the reactor with water in short time and rapidly<br />
cools down the cladding tubes.<br />
During the heating period, the structure of the material<br />
transforms: the phase (hcp) changes to the high temperature<br />
phase (bcc). The maximum amount of oxygen, which can<br />
be dissolved in the phase, depends on temperature. The<br />
exposure to high temperature atmosphere is accompanied by<br />
oxygen and hydrogen uptake. Part of oxygen forms the oxide<br />
layer during oxidation and the remaining part dissolves in the<br />
metal. The amount of oxygen dissolved in the metal depends<br />
on temperature: the higher the temperature, the higher the<br />
amount of oxygen dissolved in the metal. Oxygen concentration<br />
gradient occurs with higher concentration levels under<br />
sample surface.<br />
Due to the rising oxygen content, the phase transforms<br />
back to hcp -Zr(O), phase stabilized by oxygen, even at<br />
higher temperatures, which is not changed by further cooling.<br />
During the cooling period, the remaining phase transforms<br />
to hcp phase (usually called prior 1,2 ) and phase stabilizing<br />
elements (H, Fe and Cr) diffuse to the non-transformed<br />
phase. Thus the a phase lamellas are formed which are depleted<br />
of these elements, despite the fact that the maximal<br />
admissible concentration of oxygen in at higher temperatures<br />
is exceeded 1 . Hydrogen causes the precipitation of hydrides<br />
during cooling. Faster cooling promotes the formation<br />
of ZrH ( ), while the slower one leads to formation of ZrH 2 x.<br />
The microstructure of the material after HTO and after<br />
the cooling consists of the oxide layer ZrO2, oxygen stabilized<br />
-Zr(O) and phase enriched with H, Fe and Cr which create<br />
precipitates. The -Zr(O) layer is very brittle and thus the<br />
phase is the only factor responsible for remaining ductility<br />
and toughness of the material. The character of the -Zr(O)<br />
layer depends on the chemical composition of the alloy. Zralloys<br />
containing Sn ( stabilizer) form uniform layers,<br />
whereas in alloys containing Nb ( stabilizer), the layer is<br />
non-uniform and acicular 1,2 (see Fig. 1).<br />
2. Experimental<br />
The samples were small tubes with the length of 30 mm<br />
and outer diameter of 9 mm and 0.6 mm wall thickness,<br />
which are identical to actual cladding tubes. Chemical composition:<br />
1.0 1.1 % Nb, 3 ppm H, 20 ppm N, 100 ppm C,<br />
840 ppm O. The course of LOCA was simulated in laboratory<br />
conditions in UJP Praha 2 . Samples were heated at 950 °C,<br />
1000 °C, 1050 °C, 1150 °C and 1200 °C in steam for different<br />
time, see Tab. I. After the HTO stage and hardening in water<br />
with ice, the tubes were cut to 3 mm-thick rings and then<br />
embedded in resin or in conductive substance (for following<br />
SEM analyses) and polished. Samples were examined by X-<br />
Ray diffractometer equipped with high-temperature chamber 3 ,<br />
scanning electron microscope with EDAX 4 and by Nanoindenter<br />
XP.
Chem. Listy 105, s163 s166 (2011) LMV <strong>2008</strong> Regular Lectures<br />
Table I<br />
Experimental samples and measured mean values<br />
Sample<br />
temperature [°C] / time<br />
[min]<br />
The instrument enables to perform instrumented indentation<br />
where the displacement of indenter and load data are<br />
recorded during the loading and unloading periods (F h:<br />
indentation curve). The indentation hardness HIT and indentation<br />
modulus of elasticity EIT were measured by the IIT<br />
(Instrumented Indentation Testing) method 5 :<br />
H<br />
IT<br />
F<br />
A<br />
max<br />
p<br />
where Fmax is the maximum load; Ap is the projected contact<br />
area of the indent.<br />
E<br />
IT<br />
1 (<br />
2<br />
s )<br />
1 1 (<br />
2<br />
i )<br />
E E<br />
r<br />
i<br />
where the indices i and s are related to properties of the indentor<br />
or sample material (modulus of elasticity, Poisson ratio)<br />
and Er is reduced modulus of elasticity:<br />
E<br />
r<br />
S .<br />
2 . p c<br />
A ( h )<br />
HIT<br />
[GPa]<br />
EIT<br />
[GPa]<br />
950 / 0 2.88 ± 0.27 111.1 ± 2.6<br />
950 / 3 2.93 ± 0.16 111.3 ± 4.4<br />
950 / 6 3.21 ± 0.24 106.1 ± 3.0<br />
950 / 9 3.40 ± 0.20 115.3 ± 3.7<br />
950 / 15 3.19 ± 0.17 105.5 ± 2.7<br />
1000 / 9 3.61 ± 0.34 106.7 ± 5.4<br />
1000 / 15 3.69 ± 0.35 110.0 ± 5.3<br />
1050 / 0 3.32 ± 0.25 107.7 ± 4.5<br />
1050 / 3 3.53 ± 0.24 109.1 ± 3.8<br />
1050 / 6 3.63 ± 0.23 110.3 ± 4.3<br />
1050 / 9 3.95 ± 0.24 113.5 ± 3.9<br />
1100 / 3 3.76 ± 0.28 108.9 ± 2.9<br />
1100 / 6 3.98 ± 0.28 113.8 ± 5.1<br />
1100 / 9 4.11 ± 0.24 112.4 ± 3.9<br />
1100 / 15 3.82 ± 0.21 108.7 ± 3.3<br />
1150 / 0 3.14 ± 0.27 111.3 ± 3.8<br />
1150 / 3 3.98 ± 0.22 113.0 ± 3.7<br />
1150 / 9 4.62 ± 0.24 118.8 ± 4.2<br />
1200 / 3 4.67 ± 0.20 116.1 ± 3.0<br />
1200 / 6 4.61 ± 0.38 106.9 ± 1.9<br />
1200 / 9 5.44 ± 0.33 116.4 ± 3.6<br />
1200 / 15 4.98 ± 0.29 106.9 ± 3.0<br />
where S denotes contact stiffness (the initial slope of the<br />
unloading curve), is correction constant for the indenter tip<br />
shape (for Berkovich indenter: 1.034), Ap is the projec-<br />
s164<br />
tion of contact area and hc is contact depth:<br />
h<br />
c<br />
h<br />
P<br />
S<br />
max<br />
where is constant dependent on the indenter geometry 6 .<br />
Nanoindentation measurements were performed with the<br />
Berkovich indenter with the load of 8 mN. The indents were<br />
made in three parallel rows with the starting point at the oxide<br />
metal interface and the distance of 5 m between each<br />
other. They were documented by using an optical microscope<br />
or a SEM. The min max intervals were recorded (Fig. 1),<br />
with the assumption that they correspond with the phase<br />
properties, then mean values were calculated.<br />
Calculated values of indentation hardness and modulus<br />
of elasticity of the (prior ) phase are shown in Tab. I. and<br />
Fig. 2 and 3.<br />
The indentation hardness generally increases with the<br />
temperature of exposure. It depends on higher oxygen content<br />
4 . The indentation modulus of elasticity is nearly constant:<br />
111.4 GPa ± 4.2 GPa (standard deviation is approximately<br />
4 % from mean value).<br />
Ratio of measured values of indentation modulus<br />
of elasticity EIT and indentation hardness HIT (ref. 7 ) is shown<br />
a<br />
b<br />
c<br />
Fig. 1. a) Micrograph of sample with exposition temperature<br />
1050 °C and time 9 min, b) measured value of indentation hardness,<br />
c) measured value of indentation modulus of elasticity
Chem. Listy 105, s163 s166 (2011) LMV <strong>2008</strong> Regular Lectures<br />
Fig. 2. Indentation hardness of samples with different exposition<br />
temperature vs. exposition time<br />
Fig. 3. Indentation modulus of elasticity of samples with different<br />
exposition temperature vs. exposition time<br />
Fig. 4. Ratio of measured values of indentation modulus<br />
of elasticity EIT and indentation hardness HIT vs. exposition time<br />
in Fig. 4. This ratio mostly decreases with the temperature of<br />
exposure.<br />
Samples were measured at UJP Praha by the pressure<br />
testing method at 135 °C and ductility was determined 2 . Sam-<br />
s165<br />
Fig. 5. The ductility vs. indentation hardness of samples with<br />
different exposition temperature<br />
ples are brittle when their hardness is more than 4 GPa (see<br />
Fig. 5).<br />
3. Conclusion<br />
This paper is based on long-time investigation and characterization<br />
of mechanical and related properties of a new<br />
Zr1Nb alloy. The samples were analysed using nanoindentation<br />
method.<br />
The indentation hardness of the (prior ) phase was<br />
determined and it was found out that indentation hardness<br />
increases with the temperature of exposure. On the contrary,<br />
the indentation modulus of elasticity is nearly constant so that<br />
ratio indentation hardness and indentation modulus decreases<br />
with the temperature of exposure.<br />
The indentation hardness correlates with ductility measured<br />
by the pressure testing method.<br />
This work was supported by project MPO R no. 2A<br />
1TP1/03 and project Kontakt AIP no. MEB 080869.<br />
REFERENCES<br />
1. Chung H. M.: Nucl. Eng. Technol. 37, 327 (2005).<br />
2. Vrtílková V. et al.: Vliv rozpou t ní oxidu vytvo eného<br />
na povlakové trubce ze Zr-slitin na termomechanické<br />
vlastnosti povlakové trubky po vysokoteplotních p echodech,<br />
Výzkumná zpráva 1164 (Research report). UJP<br />
Praha a. s., Praha 2005.<br />
3. íha J., Bláhová O., utta P.: Fázové zm ny slitiny Zr-<br />
1Nb a jejich vliv na lokální mechanické vlastnosti (Phase<br />
Changes in the Zr-1Nb Alloy and Their Impact on the<br />
Local Mechanical Properties). In this issue.<br />
4. Medlín R., íha J., Bláhová, O.: Microstructure and Local<br />
Mechanical Characteristics of Zr1Nb Alloy after<br />
Hardening. In this issue.<br />
5. ISO 14577-1:2002, Metallic materials Instrumented<br />
indentation test for hardness and materials parameters<br />
Part 1: Test method.<br />
6. Oliver W. C., Pharr G. M.: J. Mater. Res. 7, 1546 (1992).
Chem. Listy 105, s163 s166 (2011) LMV <strong>2008</strong> Regular Lectures<br />
7. Zubko P., Pe ek L., Besterci M., Vadasová Z.: Kovove<br />
Mater. 47, 39 (2009).<br />
s166<br />
O. Bláhová (New Technology Research Centre, University<br />
of West Bohemia, Plze ): Investigation of Local Mechanical<br />
Properties of Zirconium Alloys Using Nanoindentation<br />
Samples from Zr1Nb alloy were tempered after various<br />
temperatures and various times prior to hardening. This process<br />
simulated the LOCA (Loss Of Coolant Accident) conditions<br />
when, due to a broken pipe, water flows out. The loss of<br />
moderator occurs and temperature of the cladding increases,<br />
which results in high temperature oxidation. The emergency<br />
system floods the reactor with water in short time and rapidly<br />
cools down the cladding tubes.<br />
This paper presents the evaluation of local mechanical<br />
properties on samples after this simulation process. The indentation<br />
hardness and indentation modulus of elasticity were<br />
evaluated by nanoindentation method.
Chem. Listy 105, s167 s170 (2011) LMV <strong>2008</strong> Regular Lectures<br />
MO NOSTI VYU ITIA SYSTÉMU NA ODBER MALÝCH VZORIEK<br />
Z PREVÁDZKOVANÝCH ZARIADENÍ PRI HODNOTENÍ VLASTNOSTÍ<br />
MATERIÁLOV<br />
MARTIN B EZINA a UDOVÍT KUP A<br />
VUJE, a.s., Okru ná 5, 918 64 Trnava, Slovenská republika<br />
brezina@vuje.sk, kupca@vuje.sk<br />
K ú ové slová: odber vzoriek, malé vzorky, small punch test,<br />
skú ky mechanických vlastností<br />
1. Úvod<br />
Prevádzkovatelia rôznych zariadení asto rie ia otázku<br />
mo nosti al ej prevádzky zariadenia, pred enia jeho plánovanej<br />
ivotnosti, prípadne aktuálnu potrebu analyzova defektoskopické<br />
nálezy. Tieto otázky je mo né zodpovedne vyriei<br />
len odberom asti materiálu kon trukcie alebo daného<br />
zariadenia a jeho detailnou analýzou.<br />
Tradi ný odber skú obného materiálu u prevádzkovaných<br />
zariadení predstavuje popri nutných odstávkach aj nevhodný<br />
zásah do celistvosti hodnotenej asti, a to i u sa<br />
jedná o odber strojným obrábaním, teplotným delením alebo<br />
aj inými spôsobmi. Tieto de truktívne metódy zvy ajne vy adujú<br />
následnú opravu odobratého miesta, vrátane tepelného<br />
spracovania a celého radu nede truktívnych kontrol. asto sa<br />
pritom práve toto miesto mô e sta zdrojom problémov pri<br />
al ej prevádzke.<br />
V prípade, e je potrebné získa reálne informácie<br />
o stave daného zariadenia (napr. bude výpo tovo stanovené<br />
vy erpanie ivotnosti, resp. potreba analyzova indikácie<br />
alebo defekty) je mo né namiesto vyrezania a výmeny celého<br />
komponentu odobra z najkritickej ích miest miniatúrne vzorky,<br />
ktoré nezmenia jej pevnos ani ivotnos , ale poskytnú<br />
dostato né mno stvo informácií. Pomocou peciálnych techník<br />
je mo né na takýchto malých vzorkách vykona prakticky<br />
v etky analýzy potrebné pre posúdenie danej komponenty.<br />
Tento spôsob odberu malých vzoriek nazývaný tie SSam<br />
(Surface Sampling) nielen e negatívne neovplyvní dané zariadenia,<br />
ale zvy ajne tie nevy aduje iadne dodato né operácie<br />
(zváranie, brúsenie). Príkladom praktického vyu itia takého<br />
princípu bol odber vzoriek z tlakových nádob reaktorov JE V-1<br />
v Jaslovských Bohuniciach, realizovaný firmou Rolls-Royce 1 .<br />
V tomto prípade bolo pou ité jednoú elové zariadenie vyvinuté<br />
iba pre danú potrebu.<br />
Zariadenie SSam TM -2 firmy Rolls-Royce, ktoré<br />
v sú asnosti vlastní VUJE, a.s., je koncipované ako univerzálny<br />
systém ur ený na odber vzoriek z rôznych zariadení bez<br />
výrazného po kodenia povrchu a bez nutnosti miesto odberu<br />
opravova alebo upravova . V kombinácii s metódou Small<br />
Punch Test, vyvinutej pre stanovovanie mechanických vlastností<br />
na malých vzorkách, ponúka iroké mo nosti získavania<br />
informácií o stave a vlastnostiach materiálov zariadení, a to aj<br />
po as ich prevádzky.<br />
s167<br />
2. Popis systému odberu vzoriek<br />
Princíp odberu vzorky zariadením SSam TM -2 je zalo ený<br />
na rýchlej rotácii rezného nástroja v tvaru dutej pologule okolo<br />
osi súmernosti a jeho pomalého zasúvania po kruhovej<br />
dráhe do rezaného materiálu. Os posunu nástroja je kolmá na<br />
os rotácie gule tak, e rezný nástroj sleduje dráhu hrany nástroja<br />
(vi obr. 1 a 2). Rezný nástroj je vyrobený z ocele a má<br />
tvar dutej pologule o priemere ø 50,8 mm a hrúbke steny 0,25<br />
mm. Povrch nástroja je pokrytý vrstvou kubického nitridu<br />
bóru (CBN). Hrúbka vrstvi ky CBN je 0,18 a 0,20 mm, o<br />
zna í, e teoreticky je minimálna írka rezu 0,61 a 0,65 mm.<br />
V závislosti na ve kosti nepravidelnosti tvaru nástroja, je<br />
skuto ná írka rezu pribli ne 0,67 mm (cit.2).<br />
V odberovej hlavici, ktorá má priemer 70 mm a d ku<br />
520 mm je umiestnený rezný nástroj, jeho pohony, vzduchový<br />
valec na upínanie v rúrach a dva vzduchové valce pre núdzové<br />
vytiahnutie nástroja z rezu pri odbere vzoriek<br />
v nedostupných miestach (napr. v rúrach).<br />
Obr. 1. Princíp odberu vzoriek poloha na za iatku odberu<br />
Obr. 2. Princíp odberu vzoriek poloha ku koncu odberu
Chem. Listy 105, s167 s170 (2011) LMV <strong>2008</strong> Regular Lectures<br />
Obr. 3. Odberová hlavica na servisnom stojane<br />
Vzorky je mo né odobera bez chladenia, alebo<br />
s chladením vodou. Pre tento prípad je hlavica vybavená prívodom<br />
a spätným odsávaním chladiacej kvapaliny. Pou itie<br />
chladenia skráti dobu odberu, ale aj bez chladenia nedochádza<br />
k prehriatiu odoberanej vzorky.<br />
Odberovú hlavicu polo enú na servisnom stojane je<br />
vidie na obr. 3. Detailný poh ad na hlavicu pri odbere vzoriek<br />
je na obr. 4. V tomto prípade je hlavica upevnená pomocou<br />
magnetických dr iakov.<br />
V aka flexibilnému systému upev ovania odberovej<br />
hlavice je mo né odobera vzorky z vonkaj ieho aj vnútorného<br />
povrchu zariadení a komponentov. V prípade potrubia je<br />
mo né získa vzorky z vnútorného povrchu od priemeru potrubia<br />
ø 75 mm a a zo vzdialenosti 4000 mm od vstupu.<br />
Ve kos a tvar odobratých vzoriek závisí na geometrii<br />
v mieste odberu. Z rovinnej plochy je mo né odobra vzorky<br />
hrubé a 2,8 mm. V prípade odberu vzorky z vonkaj ieho<br />
povrchu potrubia maximálna mo ná hrúbka vzorky rastie,<br />
v prípade vnútorného povrchu klesá. Doba odberu vzorky<br />
závisí na geometrii v mieste odberu (vonkaj í resp. vnútorný<br />
povrch), nastavenej hbke odberu, na materiáli, z ktorého sa<br />
vzorka odoberá a tie na tom, i je pou ité chladenie.<br />
Výhodou pou itia uvedeného odberového zariadenia je:<br />
minimálny zásah do hodnoteného komponentu,<br />
nie je potrebná al ia úprava povrchu v mieste odberu,<br />
mo nos odberu vzoriek na neprístupných miestach,<br />
prakticky nulové ovplyvnenie odobratej vzorky.<br />
Odobraté vzorky je mo né analyzova klasickými meto-<br />
Obr. 4. Detail hlavice pri odbere vzorky<br />
s168<br />
Obr. 5. Odobratá vzorka po elektroiskrovom delení<br />
dikami a postupmi, ale aj postupmi peciálne vyvinutými na<br />
vyhodnocovanie malých vzoriek metódou SPT (Small Punch<br />
Test).<br />
Z odobratých vzoriek je potom mo né stanovi :<br />
chemické zlo enie,<br />
základné mechanické vlastnosti medzu sklzu, medzu<br />
pevnosti, tvrdos ,<br />
prechodovú teplotu krehký hú evnatý stav,<br />
únavové charakteristiky,<br />
mikro trukturálne a submikro trukturálne vlastnosti,<br />
mieru scitlivenia vo i medzikry talickej korózii a pod.<br />
Rozsah analýz a z toho vyplývajúca potreba na po et<br />
odobratých vzoriek závisí na hodnotenom zariadení, pou itom<br />
kon truk nom materiáli a po adovaných výsledkoch. Rovnako<br />
aj delenie získaných vzoriek, ktoré sa vykonáva elektroiskrovou<br />
drôtovou reza kou, musí v dy vychádza z analýz,<br />
ktoré sa budú vykonáva . Preto e zvy ajne sa po aduje stanovi<br />
aj základné mechanické vlastnosti, je delenie orientované<br />
tak, aby bolo mo né získa maximálny po et vzoriek pre<br />
skú ku SPT. Pre zvy né skú ky je spravidla mo né vyu i<br />
odrezky a zvy ky po delení a tie vzorky po SPT skú kach.<br />
Príklad delenia odobratej vzorky je na obr. 5.<br />
3. Stanovenie mechanických vlastností metódou<br />
small punch test<br />
V sú asnosti sa prejavuje snaha o zjednodu enie skú ania,<br />
pri sú asnom zabezpe ení po adovanej presnosti a vierohodnosti<br />
výsledkov. Jedným z mo ných rie ení je miniaturizácia<br />
vzoriek. Sú asne so zmen ovaním tandardných skú obných<br />
telies sú vyvíjané aj nové typy skú ok plne nahradzujúcich<br />
be ne pou ívané skú ky. Jedným z takýchto mo ných<br />
rie ení je pou itie tzv. SPT skú ky (Small Punch Test).<br />
Vo svete sa za alo roz irova pou itie SPT skú ky na<br />
hodnotenie základných mechanických vlastností rôznych<br />
zliatin 3,4 . Jej výhody upútavajú pozornos stále vä ieho<br />
mno stva výskumných pracovísk.<br />
Najvä ie z týchto výhod sú:<br />
nízka spotreba originálnych skú obných materiálov,<br />
relatívne jednoduché vyhodnocovanie výsledkov skú ky,<br />
pou itie univerzálnych a jednoduchých skú obných zariadení,
Chem. Listy 105, s167 s170 (2011) LMV <strong>2008</strong> Regular Lectures<br />
uniformita vzoriek pre v etky ur ované vlastnosti materiálov,<br />
nízka aktivita o iarených vzoriek.<br />
Parametre tejto skú ky sa v ak zatia medzi jednotlivými<br />
autormi lí ia. Najviac odli ností je v nasledovných oblastiach:<br />
ve kos a tvar vzorky,<br />
druh razného nástroja,<br />
konfigurácia skú obného prípravku,<br />
po et vzoriek pre získanie spo ahlivého výsledku.<br />
Z toho dôvodu v sú asnosti prevláda ve ká snaha<br />
o normalizáciu tejto metódy, a to nie len v Japonsku a USA,<br />
ale aj v Európe. Za týmto ú elom vznikla aj medzinárodná<br />
skupina CEN21 European Commitee for standardization:<br />
CEN Workshop 21 Small Punch Test Method for Metallic<br />
Materials 5 .<br />
Napriek popísaným rozdielom v postupe skú ania, princípom<br />
SPT skú ky je v dy prienik peciálneho razníka cez<br />
plochú vzorku, ktorá je uchytená medzi pridr ova om<br />
a matricou (obr. 6). Pou itím pomerne jednoduchého zariadenia<br />
so záznamom za a ovacej sily a deformácie je mo né<br />
získa údaje o základných mechanických vlastnostiach. Typický<br />
priebeh sily a deformácie pri skú ke tvárneho materiálu<br />
je na obrázku 7. Skú ky pri nízkych teplotách sa realizujú<br />
pomocou tekutého dusíka alebo dusíkových pár v peciálne<br />
pre tento ú el zhotovených zariadeniach a skú ky pri vy ích<br />
teplotách v peciálnej piecke, ktorá je sú as ou skú obného<br />
zariadenia.<br />
Pou itím jednoduchého záznamového zariadenia pre<br />
záznam vzájomných priebehov parametrov za a enie deformácia<br />
je mo né z výsledkov SPT skú ky zis ova :<br />
medzu sklzu a medzu pevnosti materiálu zodpovedajúcu<br />
výsledkom zo tandardnej ahovej skú ky,<br />
prechodovú teplotu krehkého a hú evnatého lomu porovnate<br />
nú s výsledkami získanými pomocou Charpyho<br />
skú ky vrubovej hú evnatosti,<br />
prípadne aj lomovú hú evnatos .<br />
Vzorky pre typ zavedenej SPT skú ky, ktorá sa pou íva<br />
vo VUJE, a. s., majú tvar malého kotú a s priemerom ø 8 mm<br />
a hrúbkou 0,5 mm.<br />
Obr. 6. Schéma skú obného usporiadania<br />
s169<br />
Obr. 7. Typický priebeh pri SPT skú ke tvárneho materiálu<br />
Ur itou nevýhodou SPT skú ky sú jej vysoké nároky na<br />
uniformitu a kvalitu prípravy vzoriek. Pri ich výrobe sa musí<br />
zabezpe i :<br />
vysoká kvalita povrchu vzoriek,<br />
kon tantná hrúbka vzorky s toleranciou ± 0,005 mm,<br />
rovnobe nos skú aných plôch vzorky.<br />
Najvä ou výhodou SPT skú ky sú malé rozmery skúobnej<br />
vzorky a to hlavne v prípade nedostatku skú obného<br />
materiálu. Napr. pri skú aní o iarených vzoriek je ve kou<br />
výhodou ni ia aktivita, z dôvodu ich malého objemu. Malé<br />
rozmery skú obných vzoriek sú výhodné aj pri o arovaní<br />
v energetických reaktoroch. Geometria vzoriek, predov etkým<br />
ich hrúbka, tie umo uje presnej ie hodnotenie degradácie<br />
vlastností v oblasti teplom ovplyvnenej zóny materiálu<br />
v blízkosti zvaru 6 .<br />
4. Príklady vyu itia odberového zariadenia<br />
a SPT skú ky<br />
Odber vzoriek s následnou komplexnou analýzou vlastností<br />
vrátane stanovenia mechanických vlastností pomocou<br />
SPT skú ky bol realizovaný pri hodnotení vlastností materiálov<br />
potrubných trás a iných zariadení vo firme Duslo, a.s. 7,8 .<br />
Zariadením SSam TM -2 boli odobraté vzorky zo základného<br />
materiálu aj zvarových spojov. Z ka dej odobratej vzorky boli<br />
elektroiskovým delením získané 3 ks polotovarov o rozmeroch<br />
ø 8 0,6 mm potrebných pre skú ku SPT. Z týchto<br />
polotovarov boli precíznym mechanickým odbruso-vaním<br />
vyrobené skú obné telieska s finálnymi rozmermi<br />
ø 8 0,5 ± 0,05 mm. Zvy ky odobratých vzoriek po elektroiskrovom<br />
delení boli vyu ité pre meranie mikrotvrdosti<br />
a metalografickú analýzu. Týmto spôsobom bolo mo né posúdi<br />
stav materiálu zariadenia bez nutnosti hrubého zásahu<br />
spojeného s odberom vzoriek pre klasické mechanické<br />
skú ky.<br />
Rozsiahle vyu itie SPT skú ky vo VUJE sa realizovalo<br />
v rámci tzv. Nového programu overovacích vzoriek (NPOV),<br />
ktorý slú il na monitorovanie stavu a zmien vlastností materiálov<br />
tlakovej nádoby reaktora JE V-1 po as prevádzky, po<br />
regenera nom íhaní a následnom o arovaní. Tento program<br />
bol realizovaný na JE v Jaslovských Bohuniciach a bol koordinovaný<br />
medzinárodnou agentúrou MAAE (cit. 9 ). Porovnaním<br />
získaných výsledkov mechanických vlastností jednotlivých<br />
stavov materiálov pomocou tandardizovaných postupov
Chem. Listy 105, s167 s170 (2011) LMV <strong>2008</strong> Regular Lectures<br />
a výsledkov SPT skú ky bola v rámci tohto programu overená<br />
aj spo ahlivos skú ania týmto novým postupom 10 .<br />
Najrozsiahlej ie vyu itie SPT skú ok na lo uplatnenie<br />
v tzv. Zdokonalenom programe overovacích vzoriek (ZPOV),<br />
ktorý je ur ený na monitorovanie aktuálneho stavu vlastností<br />
materiálu tlakových nádob reaktorov JE V-2 v Jaslovských<br />
Bohuniciach po as prevádzky 11 . V rámci prípravy tohto programu<br />
bolo vyrobených a do reaktorov zavezených nieko ko<br />
tisíc SPT vzoriek, ktoré sa budú po o iarení v ur ených intervaloch<br />
vyhodnocova .<br />
5. Záver<br />
Vyu itie peciálneho odberového zariadenia SSam-2TM<br />
od firmy Rolls-Royce v kombinácii s SPT skú kou, ale aj<br />
jednotlivo, má ve a mo ností vyu itia pri hodnotení reálneho<br />
stavu zariadení a ich komponentov v prevádzke, a to nielen na<br />
jadrových zariadeniach.<br />
LITERATÚRA<br />
1. Kup a ., B ezina M.: Metallography methods application<br />
on the scoop samples from the reactor pressure vessels<br />
WWER-440 in Jaslovské Bohunice NPP V-1.<br />
Microstructural Science, vol. 26, ASM International,<br />
Materials Park, Ohio, USA, 1998.<br />
2. Rolls-Royce: SSamTM-2 Surface Sampling System. Operational<br />
manual.<br />
3. Lucas G. E.: Metall. Mater. Trans. A 21, 1105 (1990).<br />
4. Corwin W. R., Rosinski S. T., van Walle E. (ed.): Small<br />
Specimen Test Techniques, ASTM STP 1329, West Conshohocken<br />
1997.<br />
5. CEN Workshop Agreement 21 Small Punch Test<br />
Method for Metallic Materials , Part B: A Code of<br />
Practice for Tensile and Fracture Behaviour.<br />
6. Petzová J., Kup a, ., B ezina M.: Lokální mechanické<br />
s170<br />
vlastnosti 2006. Ne tiny 8. - 10. 11. 2006. Zborník predná<br />
ok. Západo eská univerzita v Plzni, s. 134 140.<br />
7. Bezina M. a kol: Stanovenie mechanických vlastností<br />
potrubí parovodov v Duslo a a. Technická správa VU-<br />
JE . 0360/20/<strong>2007</strong>, august <strong>2007</strong>.<br />
8. Bezina M. a kol.: Analýza vlastností materiálu VT ohrieva<br />
a napájacej vody P 3. Technická správa VUJE .<br />
0360/20/<strong>2007</strong>, september <strong>2007</strong>.<br />
9. MAAE: TC Project RER/9/035 Skú ky Round-Robin<br />
pre oarovanie, krehnutie, íhanie a al ie krehnutie<br />
zvarového kovu TNR typu VVER 440/230 Viede , november<br />
1996.<br />
10. Petzová, J. a kol.: Výsledky hodnotenia materiálov TNR<br />
pomocou SPT skú ky na malých vzorkách v rámci programu<br />
NPOV, výskumná správa VÚJE, ev. .<br />
0360/37/2004, december 2004.<br />
11. Kup a, . A kol.: Zdokonalený program overovacích<br />
vzoriek materiálov tlakových nádob reaktorov typu<br />
VVER-440/213 pre 3. a 4. blok JE V-2. Technická správa<br />
VUJE ev. . 0360/22/<strong>2008</strong>.<br />
M. B ezina and . Kup a (VUJE, a.s., Trnava, Slovakia):<br />
Implementation possibilities of the small specimen sampling<br />
system for evaluation of material properties from<br />
components under operation<br />
In the paper, there is described a surface sampling system<br />
which is used for cutting of small specimens from operating<br />
equipments without undesirable affects. The sampling<br />
system SSamTM-2 made by Rolls-Royce Company uses<br />
a special rotating tool, which cuts off small scoop samples.<br />
The paper describes the evaluation possibilities of taken samples<br />
to determine mechanical properties using SPT (Small<br />
Punch Test) samples, chemical composition and microstructure<br />
of materials with the aim to determine the residual lifetime of<br />
the component, mechanisms and causes of failures, etc.
Chem. Listy 105, s171 s174 (2011) LMV <strong>2008</strong> Regular Lectures<br />
MEASUREMENT OF MECHANICAL PROPERTIES OF COMPOSITE MATERIALS<br />
VILMA BUR ÍKOVÁ a , ZUZANA<br />
KU EROVÁ a , LENKA ZAJÍ KOVÁ a ,<br />
OND EJ JA EK a , VÍT KUDRLE a ,<br />
JI INA MAT JKOVÁ b , and PETR<br />
SYNEK a<br />
a Department of Physical Electronics, Masaryk University,<br />
Kotlá ská 2, 611 37 <strong>Brno</strong>, b Institute of Scientific Instruments,<br />
Academy of Sciences of the Czech Republic, Královopolská<br />
147/62, 612 64 <strong>Brno</strong>, Czech Republic<br />
vilmab@physics.muni.cz<br />
Keywords: nanocomposites, carbon nanotubes, polyurethane,<br />
hardness, storage modulus, loss modulus, indentation creep<br />
1. Introduction<br />
Composite materials or composites are multiple-phase<br />
materials that exhibit a significant proportion of the properties<br />
of all constituent phases such that a better combination of<br />
properties is realized. Those phases must be chemically and<br />
physically dissimilar and separated by a distinct interface.<br />
There are two categories of constituent materials: the matrix<br />
and the reinforcement or the dispersed phase. In a composite,<br />
at least one portion of each kind is required. The properties of<br />
composites are a function of the properties of the constituent<br />
phases, their relative amounts and the geometry of the disperse<br />
phase (i.e. the shape of the particles, the particle size<br />
distribution and orientation).<br />
2. Nanocomposites<br />
In contrast to conventional composites, where the reinforcement<br />
is on the order of microns, nanocomposites are<br />
reinforced with filler with at least one dimension that is less<br />
than 100 nm. Although some nanofilled composite have been<br />
used for more than 100 years (e.g. carbon black or fumed<br />
silica filled 1,2 ), the discovery of carbon nanotubes become<br />
a new great challenge for nanocomposite research and industry.<br />
According to 3 , six following characteristics distinguish<br />
the nanocomposite from the classic filled systems: particleparticle<br />
correlation (orientation and position) arising at low<br />
volume fractions (
Chem. Listy 105, s171 s174 (2011) LMV <strong>2008</strong> Regular Lectures<br />
walled CNTs (hereafter MWCNTs) were used. The structure<br />
and properties of composite with both kinds of filler are compared.<br />
The functionalization of MWCNTs in inductively coupled<br />
plasma ICP is also reported.<br />
3. Mechanical properties of the composites<br />
There are several basic problems associated with the<br />
determination of the mechanical properties of composite film<br />
consisting of hard particles and viscoelastic-plastic matrix.<br />
The evaluation of material parameters such as elastic modulus<br />
and plastic hardness of the viscoelastic-plastic film is problematic<br />
because these materials exhibit also a significant time<br />
dependent plastic deformation (creep). If we load such system<br />
to a maximum load and then keep penetration depth constant,<br />
the load will relax under some plastic or viscoelastic response<br />
(anelastic time dependent plastic deformation). Two different<br />
indentation methods were used to study the mechanical<br />
properties of the composites.<br />
A Fischercope H100 depth sensing indentation (DSI)<br />
tester was used to study the indentation response of composites<br />
on glass substrates. Several different testing conditions<br />
were used in order to find the optimum procedure allowing<br />
the suppression of the influence of the time dependent indentation<br />
response of CNT-filled PU composite on a glass substrate.<br />
The loading period of 20 s was followed by a hold time<br />
of 20 s or 60 s, an unloading period of 20, 5 or 1 s and finished<br />
after holding the minimum load for 20 or 60 s. The tests<br />
were made for several different indentation loads in order to<br />
study the composite mechanical properties of the film/<br />
substrate system from near surface up to film-substrate interface.<br />
The applied load varied from 1 to 1000 mN. An example<br />
of the time dependence of the load is shown in Fig. 1.<br />
In the case of the second, dynamic method, the CSM<br />
ultrananoindenter (UNHT) was used. The indentation measurement<br />
was based on the application of an oscillating force<br />
superimposed to the increasing indentation load in which the<br />
transfer function between the load and indentation depth pro-<br />
Indentation depth [ m]<br />
35<br />
30<br />
25<br />
20<br />
15<br />
10<br />
5<br />
0<br />
PU1<br />
PU2<br />
PU3<br />
A<br />
B<br />
C<br />
D<br />
0 10 20 30 40 50 60 70<br />
Time [s]<br />
Load<br />
Fig. 1. Comparison of the time dependence of the load with the<br />
time dependence of the indentation depth for 3 different types of<br />
polyurethane matrices PU1-PU3 and four composites marked<br />
A,B,C,D, reinforced by CNTs<br />
100<br />
80<br />
60<br />
40<br />
20<br />
0<br />
Load [mN]<br />
s172<br />
vides a method of calculating storage and loss modulus of the<br />
material.<br />
The PU-CNT nanocomposite preparation was as follows.<br />
Appropriate amounts of CNTs, polyol, diluter and antistatic<br />
agent were weighted out, stirred well manually, glass<br />
balls ensuring the mechanical perturbance were added and the<br />
whole mixture was ultrasonicated for 60 minutes. Than isocyanate<br />
was added and the mixture was stirred once more. After<br />
that it was poured onto glass substrate surrounded by the<br />
frame. Liquid in the frame created a flat level and let dried at<br />
the laboratory temperature. After 48 hours the composite was<br />
dry enough to be removed from the frame. The chemicals<br />
weight rate was 7 : 2 : 1 (polyol : isokyanate : diluter) and the<br />
CNT concentration in composites was 0.1 wt%.<br />
4. Results<br />
In Fig. 1 the testing conditions (dependence of the applied<br />
load on the time) used and the corresponding time dependences<br />
of the indentation depth are illustrated for several<br />
studied samples.<br />
Creep [ m]<br />
Anelastic response [ m]<br />
35<br />
30<br />
25<br />
20<br />
15<br />
10<br />
18<br />
16<br />
14<br />
12<br />
10<br />
8<br />
6<br />
4<br />
PU1<br />
PU2<br />
PU3<br />
A<br />
B<br />
C<br />
D<br />
fits according to M-V model<br />
fits according to M-V model<br />
0 2 4 6 8 10 12 14 16 18 20<br />
Time [s]<br />
PU3<br />
A<br />
B<br />
C<br />
D<br />
Fig. 2. Experimental indentation creep and relaxation data fitted<br />
with Maxwell-Voigth (M-V) reological model obtained for pure<br />
PU samples and PU-CNT nanocomposites
Chem. Listy 105, s171 s174 (2011) LMV <strong>2008</strong> Regular Lectures<br />
The mechanical properties of PU depend substantially<br />
on its preparation conditions, it is well-known that the composition<br />
of PU can be varied to produce hard and stiff to soft and<br />
rubbery materials. In Fig. 1, the indentation responses of three<br />
different PU coatings to the applied load change in time are<br />
shown. The substrate material was glass. Using the indentation<br />
study, we have found that mechanical properties of PU<br />
coatings depend not only on the preparation mixture, but also<br />
on the amount of chemicals used for the preparation, i.e. they<br />
are dependent on the coating thickness. Probably it is caused<br />
by different solidification process at the surface, which is in<br />
contact with air and in the bulk of the material. In case of the<br />
sample PU1, which was thicker than 300 m, there was<br />
a harder skin at the surface and the hardness in the bulk decreased<br />
of one order of magnitude. In case of samples PU2<br />
and PU3 with thicknesses lower than 300 m the solidification<br />
process was more homogeneous, and the differences in<br />
surface and bulk properties are less. The hardness of the most<br />
thin and stiff PU matrix P3 was 22 MPa, its indentation<br />
modulus EIT was 1.14 GPa, the loss modulus EL was<br />
0.15 GPa.<br />
The PU matrix was in each case softer than the multiwall<br />
carbon nanotube (MWCNT) containing PU (samples<br />
A,B,C,D) and showed more significant indentation creep. The<br />
unloading cycle showed for PU coatings sudden rush decrease<br />
in indentation depth. The composite film A consisting of nonmodified<br />
nanotubes in polyurethane matrix exhibited slightly<br />
higher resistance against indentation compared to P3. However,<br />
the COOH activated carbon nanotubes in case of sample<br />
B (0.05 % of MWCNT) and sample C (0.1 % of MWCNT)<br />
substantially improved the PU matrix properties. The COOH<br />
functionalisation of MWCNTs increased the composite resistance<br />
against indentation and creep and resulted in better relaxation<br />
(anelastic response) ability (see Fig. 1 and Fig. 2).<br />
The homogeneity of the composite was improved from the<br />
point of view of the indentation test and the scatter in measured<br />
values decreased. The activation of the carbon nanotubes<br />
improved the hardness and the elastic modulus of the pre-<br />
H IT [MPa]<br />
E IT [GPa]<br />
60<br />
40<br />
20<br />
3,0<br />
2,5<br />
2,0<br />
1,5<br />
1,0<br />
Results on dynamic mechanical analysis<br />
A B C<br />
0 2 4 6 8 10 12 14<br />
Displacement [ m]<br />
A B C<br />
Fig. 3. Dependence of the hardness and the elastic modulus on the<br />
indentation depth for nanocomposites A, B and C;<br />
A nanocomposite consisting of nonmodified nanotubes in PU matrix,<br />
B COOH activated carbon nanotubes 0.05 % of MWCNT,<br />
C COOH activated carbon nanotubes 0.1 % of MWCNT<br />
s173<br />
Hardness [MPa]<br />
250<br />
200<br />
150<br />
100<br />
50<br />
0<br />
0.0 0.5 1.0 1.5 2.0 2.5 3.0<br />
pared samples. These results were proven also by dynamic<br />
mechanical analysis. Results on the depth dependence of the<br />
hardness and elastic modulus are shown in Fig. 3, it is obvious,<br />
that the functionalised CNTs offer much better mechanical<br />
properties.<br />
In case of sample D (0.1 % of MWCNT), the capacitively<br />
coupled low pressure glow discharge was used to<br />
activate the MWCNT fillers. The MWCNTs were treated with<br />
r.f. power 15 W of at the frequency of 13.56 MHz in mixture<br />
of oxygen and argon. From Fig. 1 and Fig. 2 it is evident, that<br />
the effect of this treatment on the properties of the PU/CNT<br />
composite is of the same quality as in case of commercial<br />
COOH treated CNTs.<br />
In Fig. 4 the viscoelastic properties of composite filled<br />
with plasma modified CNTs (sample D) are characterised<br />
using dynamic mechanical analysis. The hardness of sample<br />
determined using this analysis was 65 MPa, the storage<br />
modulus EST was 1.95 GPa, the loss modulus EL was<br />
0.12 GPa and the loss factor was 2.8°. An increase in the<br />
hardness approaching the surface region was observed in each<br />
case of prepared coatings.<br />
Moreover, we analysed the time dependent mechanical<br />
properties of the prepared coatings using several mechanical<br />
models (Kelvin-Voigt, Voigt, Maxwell-Voigt) The fourelement<br />
Maxwell-Voigt model was found to be the most suitable<br />
approach to describe the time-dependent behaviour of the<br />
prepared coatings as it is shown in Fig. 2. In this model, the<br />
material response is described by serial combination of Maxwell<br />
model and Kelvin-Voigt model.<br />
5. Conclusion<br />
Hardness<br />
Sample D<br />
Storage modulus E ST<br />
Indentation depth [ m]<br />
Loss modulus E L<br />
Complex mechanical characterization of MWCNT/PU<br />
composites was done. Four types of coatings were compared.<br />
The coating with commercial pure MWCNT filler exhibited<br />
viscoelastic properties as the PU matrix, but its mechanical<br />
3.0<br />
2.5<br />
2.0<br />
1.5<br />
1.0<br />
0.5<br />
0.0<br />
E ST , E L [GPa]<br />
Fig. 4. Results on dynamic mechanical analysis of nanocomposite<br />
sample D. Dependence of the hardness, storage and loss modulus,<br />
EST and EL on the indentation depth for nanocomposite D. D<br />
nanocomposite consisting of plasma modified carbon nanotubes in<br />
PU matrix 0.1 % of MWCNT
Chem. Listy 105, s171 s174 (2011) LMV <strong>2008</strong> Regular Lectures<br />
properties such as hardness, elastic modulus and creep resistance<br />
were slightly improved. Two different concentrations of<br />
MWCNTs commercially functionalized with COOH group<br />
were studied. These composites showed improved mechanical<br />
properties, and the modified nanotubes proved to be much<br />
better fillers than the unmodified MWCNTs due to stronger<br />
filler-to-matrix attachment. Because the modified nanotubes<br />
seem to be much more convenient composite filler, the first<br />
experiments with nanotube modification have been carried<br />
out. Modification using inductively coupled discharge in argon<br />
and oxygen mixture was successful and the mechanical<br />
properties of the composite were increased at the same level<br />
as in case of the commercially COOH functionalized<br />
MWCNT fillers.<br />
This research has been supported by Ministry of Education,<br />
Youths and Sports of the Czech Republic under project<br />
MSM0021622411, by the grant of Czech Science Foundation<br />
No. 202/07/1669 and by Academy of Science of the Czech<br />
Republic by KAN311610701.<br />
REFERENCES<br />
1. Bueche A. M.: J. Polym. Sci. 25, 139 (1957).<br />
2. Kuriakose B., De S. K., Bhagawan S. S. : J. Appl. Polym.<br />
Sci. 32, 5509 (1986).<br />
3. Vaia R. A., Wagner D. H.: Framework for nanocomposites.<br />
Materials today, p. 32 37, 2004.<br />
4. Thostenson E. T., Chou T.-W. : J. Phys. D: Appl. Phys.<br />
35, L77 L80 (2002).<br />
5. Liang Z., Ravi S. K., Kevin B., Zhang C., Wang B.,<br />
Kramer L.: In International SAMPE symposium and<br />
exhibition, p. 1627 1634, 2003.<br />
6. Geng H., Rosen R., Zheng B., H. Shimoda H., Fleming<br />
L., Liu J.: Adv. Mater. 14, 1387 (2002).<br />
7. Allaoui S., Bai H. M., Cheng, Bai J. B. : Compos. Sci.<br />
Technol. 62, 1993 (2002).<br />
8. Schadler L. S, Giannaris S. C., Ajayan P. M.: Appl.<br />
Phys. Lett. 73, 3842 (1998).<br />
s174<br />
9. Wagner H. D., Lourie. O., Feldman Y., Tenne R.: Appl.<br />
Phys. Lett. 72, 188 (1998).<br />
10. Shaffer M. S. P., Fan X., Windle A. H.: Carbon 36, 1603<br />
(1998).<br />
11. Fan Z., Advani. S. G.: Polymer 46, 5232 (2005).<br />
12. Callister W. D.: Materials Science and Engineering: An<br />
Introduction. Wiley and Sons, New York 2000.<br />
13. Du J.-H., Bai J., Cheng H.-M.: eXPRESS Polym. Lett. 1,<br />
253 (<strong>2007</strong>).<br />
14. Curtin W. A., Sheldon B. W.: CNT-reinforced ceramics<br />
and metals 7, 44 (2004).<br />
15. Gao F.: Mater. Today 7, 50 (2004).<br />
16. Valentini L., Kenny J. M.: Polymer 46, 6715 (2005).<br />
17. Xiong J., et al.: Carbon 44, 2701 (2006).<br />
V. Bur íková a , Z. Ku erová a , L. Zají ková a ,<br />
O. Ja ek a , V. Kudrle a , J. Mat jková b , and P. Synek<br />
( a Department of Physical Electronics, Masaryk University,<br />
<strong>Brno</strong>, Czech Republic, b Institute of Scientific Instruments,<br />
Academy of Sciences of the Czech Republic, <strong>Brno</strong>, Czech<br />
Republic): Measurement of mechanical properties of composite<br />
materials<br />
The aim of the present work was the study of mechanical<br />
properties of MWCNT/PU. Four types of coatings were<br />
compared. Two different concentrations of MWCNTs commercially<br />
functionalized with COOH group were prepared<br />
and studied. These composites showed improved mechanical<br />
properties compared to PU, and the modified nanotubes<br />
proved to be much better fillers than the unmodified<br />
MWCNTs due to stronger filler-to-matrix attachment. Because<br />
the modified nanotubes seem to be much more convenient<br />
composite filler, the first experiments with nanotube<br />
modification have been carried out. Modification using inductively<br />
coupled discharge in argon and oxygen mixture was<br />
successful and the mechanical properties of the composite<br />
were increased at the same level as in case of the commercially<br />
COOH functionalized MWCNT fillers.
Chem. Listy 105, s175 s177 (2011) LMV <strong>2008</strong> Regular Lectures<br />
THE INFLUENCE OF ADDITIVES ON MECHANICAL PROPERTIES<br />
OF ORGANIC-INORGANIC COATINGS<br />
LENKA DAJBYCHOVÁ a , OLGA<br />
BLÁHOVÁ a , and MILENA PÍRKOVÁ b<br />
a New Technology Research Centre, University of West Bohemia,<br />
Univerzitní 8, 306 14 Plze , Czech Republic, b Institute of<br />
Macromolecular Chemistry, Academy of Sciences of the<br />
Czech Republic, 162 06 Praha 6, Czech Republic<br />
blahova@ntc.zcu.cz<br />
Keywords: nanocomposite materials, hybrid organic- inorganic,<br />
nanocomposite coatings, nanoindentation<br />
1. Introduction<br />
The continuous development of all industries creates<br />
demand for increasingly sophisticated materials that would<br />
meet the required properties mechanical, thermal, chemical<br />
etc. as accurately as possible. This gives rise to new types of<br />
materials, for example in the form of thin coatings. Thin films<br />
of a new type have been developed, including hybrid organic<br />
inorganic (O-I) nanocomposite materials that can be<br />
widely used in various applications. O-I films are applied to<br />
various substrates. They are extensively prepared due to the<br />
fact that their final properties can be appropriately adjusted<br />
using a wide selection of organic monomers, metal alkoxides<br />
and solvents. O-I products are used as optical paints, biomaterials,<br />
membranes, as protective coating against scratches,<br />
corrosion, oxidation, etc. In terms of environment protection,<br />
it is important that water or its mixture with alcohols can be<br />
used as a solvent.<br />
Their proper use requires good knowledge of the structural<br />
arrangement of the material. Due to the different structure<br />
of their composition, the mechanical properties of polymers<br />
significantly vary from those of metallic materials. The<br />
rapid development of technologies has made it possible to<br />
assess the structure and properties of substances not only in<br />
the macroscopic scale, but allowed us to reach the nm-scale as<br />
well. The final condition of the whole system depends on<br />
mechanical properties of thin layers and, therefore, the practical<br />
applications of O-I films require proper knowledge of<br />
such properties. The most important characteristics of coatings<br />
include hardness and modulus of elasticity. These properties<br />
are derived from the dependence of indenter penetration<br />
on the applied load (indentation curve). This paper focuses on<br />
the analysis and characterization of selected O-I films. Surface<br />
hardness was determined using nanoindentation tests and<br />
the effect of the amount of filler (colloidal silica) was assessed.<br />
s175<br />
2. Experimental Material<br />
[3-(Glycidyloxy)propyl] trimethoxysilane (GTMS,<br />
Fluka); diethoxy[3-(glycidyloxy)propyl]-methylsilane (GMDES,<br />
Fluka), oligo(oxypropylene) diamines and triamine, Jeffamine<br />
D-230, D-400 and T-403 (D230, D400 and T403 Huntsman<br />
Corporation, USA), colloidal silica (SiO2 40% solution in<br />
water; d = 29 nm; Ludox AS-40, Aldrich, propan-2-ol<br />
(Lachema, Czech Republic) and hydrochloric acid, 38%<br />
(Lachema, Czech Republic) were used as received. Functionalised<br />
organosilicon precursors (GTMS, GMDES or GTMS<br />
and GMDES) were mixed with water, propan-2-ol, and possibly<br />
with colloidal silica particles and stirred for 24 h at ambient<br />
temperature.<br />
The pH of the mixture was adjusted to 4 with dilute HCl.<br />
Then a solution of the respective oligomeric amine (D230,<br />
D400 or T403) in aqueous alcohol was added. The reaction<br />
mixture was stirred at ambient temperature for 1 h or 2.5 h.<br />
Due to the alkaline nature of Jeffamine, pH of the resulting<br />
reaction mixture increased to 8 9.<br />
Then the reaction mixture was spread on glass or modified<br />
polypropylene sheets with constant thickness using a bar<br />
coater with a 300 m gap. The sheets were immediately<br />
placed into an oven and kept at 80 °C (2 h) and 105 °C (1 h).<br />
The thickness of the final coatings was 150 ± 10 m (ref. 1 3 ).<br />
Nanocomposite coating consists of an organic polymeric<br />
matrix and inorganic nanostructures.<br />
It is a hybrid organic-inorganic product. The glassy coating<br />
is formed at moderate temperatures: the inorganic section<br />
was formed by the so-called sol-gel process consisting of two<br />
consecutive steps acid hydrolysis and basic polycondensation<br />
of organosilicon precursors at laboratory temperatures.<br />
Subsequently, an organic matrix was formed using the<br />
process of staged polyaddition at temperatures of 80 and 105 °C.<br />
Nanofillers were added to the reaction system in the form of<br />
dispersion before the organic polymeric network was created<br />
(ref. 1 3 ).<br />
Coatings were prepared at the Institute of Macromolecular<br />
Chemistry AS CR in Prague. Based on previous studies of<br />
the preparation process and the multidisciplinary characterization,<br />
a system where the basic components included [3-diethoxy3-(glycidyloxy)<br />
propyl]methylsilane (GMDES) and<br />
oligo(oxypropylene) triamine (T403) was chosen.<br />
The resulting products are colorless and optically clear,<br />
remarkably smooth. Part of the products was applied to glass<br />
and part to metal, then peeled off after becoming dry, thus<br />
producing a separate film 1 3 .<br />
3. Nanoindentation Measurement<br />
The assessment of recorded indentation curves provides<br />
a substantial volume of information used to review the plastic,<br />
elastic and fracture properties, both of the layer-substrate<br />
systems and separate layers (values of nanohardness, modulus
Chem. Listy 105, s175 s177 (2011) LMV <strong>2008</strong> Regular Lectures<br />
of elasticity, energy consumed for indentation, its elastic and<br />
plastic components). The indentation tests were performed<br />
using a Berkovich indenter and the Nano Indenter XP device.<br />
The Nano Indenter XP device is equipped with a module allowing<br />
to perform the measurement using an optional CSM<br />
module that makes it possible to recognize deep changes in<br />
mechanical properties from a single indent.<br />
Using the Nano Indenter XP, deep changes in nanohardness<br />
and the indentation modulus of elasticity were measured<br />
for samples with different content of silica. Furthermore, samples<br />
applied to glass O-I-G and foils O-I-F were compared.<br />
Fig. 1 and 2 show a typical indentation curves for O-I-F<br />
composite layers (Figure 1 for an additive-free sample and<br />
Fig. 2 for a sample with 25% of an additive). Maximum indentation<br />
depth was 2 m. The indentation curves indicate<br />
that the additives increase layer resistance to indenter penetration.<br />
The values of hardness and modulus of elasticity are<br />
compared at a depth of 2 m and listed in Tables I and II.<br />
Fig. 3 and 4 show the hardness profile, and Fig. 5 and 6 the<br />
modulus of elasticity, for samples applied to glass and foil.<br />
Samples in the form of foils confirm the increasing hardness<br />
and modulus of elasticity with a higher content of the additive.<br />
With coatings applied to glass, however, this trend is not<br />
so clearly demonstrable. The measurement was probably af-<br />
Load On Sample (mN)<br />
100<br />
90<br />
80<br />
70<br />
60<br />
50<br />
40<br />
30<br />
20<br />
10<br />
0<br />
0 5000 10000 15000 20000 25000<br />
Displacement Into Surface (nm)<br />
Fig. 1. Nanoindentation curves for the sample without additive<br />
Load On Sample (mN)<br />
100<br />
90<br />
80<br />
70<br />
60<br />
50<br />
40<br />
30<br />
20<br />
10<br />
0<br />
0 5000 10000 15000 20000 25000<br />
Displacement Into Surface (nm)<br />
Fig. 2. Nanoindentation curves for the sample with 25% additive<br />
s176<br />
Table I<br />
Modulus of elasticity and hardness of coatings applied to<br />
glass<br />
fected by the substrate and the irregular thickness of the applied<br />
layer.<br />
4. Conclusion<br />
Additive HIT [MPa] EIT [MPa]<br />
O-I-G-0 0% SiO2 2.45 ± 0.27 274.1 ± 17.5<br />
O-I-G-5 5% SiO2 2.49 ± 0.22 383.6 ± 14.7<br />
O-I-G-10 10% SiO2 1.22 ± 0.34 183.8 ± 55.2<br />
O-I-G-15 15% SiO2 1.82 ± 0.31 226.7 ± 58.6<br />
O-I-G-20 20% SiO2 1.54 ± 0.26 180.2 ± 46.0<br />
O-I-G-25 25% SiO2 3.90 ± 1.16 165.1 ± 20.0<br />
O-I-G-30 30% SiO2 4.45 ± 2.14 243.4 ± 105.5<br />
Table II<br />
Modulus of elasticity and hardness of foils<br />
Additive HIT [MPa] EIT [MPa]<br />
O-I-F-0 0% SiO2 2.70 ± 0.20 162.3 ± 10.1<br />
O-I-F-5 5% SiO2 2.77 ± 0.20 231.2 ± 10.7<br />
O-I-F-10 10% SiO2 2.59 ± 0.18 233.3 ± 16.9<br />
O-I-F-15 15% SiO2 4.21 ± 0.66 265.7 ± 30.3<br />
O-I-F-20 20% SiO2 5.98 ± 0.78 269.3 ± 22.0<br />
O-I-F-25 25% SiO2 6.32 ± 2.20 300.2 ± 58.3<br />
0,02<br />
0,015<br />
0,01<br />
0,005<br />
0<br />
0 2000 4000 6000 8000 10000<br />
Displacement Into Surface (nm)<br />
O-I-0-G<br />
O-I-5-G<br />
O-I-10-G<br />
O-I-15-G<br />
O-I-20-G<br />
O-I-25-G<br />
O-I-30-G<br />
Fig. 3. Dependences of hardness on the indentation depth for<br />
samples applied to glass<br />
The results of this experiment will contribute to the<br />
knowledge about materials of this type acquired through other<br />
methods 4,5 thus contributing to the process of optimizing the<br />
formation of such coatings for applications requiring increased<br />
wear resistance.
Chem. Listy 105, s175 s177 (2011) LMV <strong>2008</strong> Regular Lectures<br />
0,02<br />
0,015<br />
0,01<br />
0,005<br />
0<br />
0 2000 4000 6000 8000 10000<br />
Displacement Into Surface (nm)<br />
O-I-20-F<br />
O-I-15-F<br />
O-I-10-F<br />
O-I-25-F<br />
O-I-0-F<br />
O-I-5-F<br />
Fig. 4. Dependences of hardness on the indentation depth for<br />
samples foils<br />
1<br />
O-I-0-G<br />
0,8<br />
O-I-5-G<br />
0,6<br />
O-I-10-G<br />
O-I-15-G<br />
0,4<br />
O-I-20-G<br />
0,2<br />
0<br />
O-I-25-G<br />
O-I-30-G<br />
0 1000 2000 3000 4000 5000 6000<br />
Displacement Into Surface (nm)<br />
Fig. 5. Dependences of modulus of elasticity on the indentation<br />
depth for samples applied to glass<br />
An instrumented hardness test is a suitable method for<br />
recognizing the effect of additives on the resulting properties<br />
of composite organic-inorganic coatings.<br />
This research was supported by the Academy of Sciences of<br />
the Czech Republic, project IAA400500505 and by M MT<br />
R, project MSM 4977751303.<br />
s177<br />
1<br />
0,8<br />
0,6<br />
0,4<br />
0,2<br />
0<br />
0 1000 2000 3000 4000 5000 6000<br />
Displacement Into Surface (nm)<br />
O-I-20-F<br />
O-I-15-F<br />
O-I-10-F<br />
O-I-25-F<br />
O-I-0-F<br />
O-I-5-F<br />
Fig. 6. Dependences of modulus of elasticity on the indentation<br />
depth for samples foils<br />
REFERENCES<br />
1. Bláhová O., pírková M., Vizina M., Skálová J., in:<br />
Nano 03, <strong>Brno</strong> 2003, p. 154 159.<br />
2. pírková M. et al., in: Nano 03, <strong>Brno</strong> 2003, p. 109 114.<br />
3. pírková M. et al., in: Nano 02, <strong>Brno</strong> 2002, p. 101 104.<br />
4. pírková M.et al: Surface Coating Internat., B 86, 187<br />
(2003).<br />
5. pírková M. et al: J. Appl. Polym. Sci. 92, 937 (2004).<br />
L. Dajbychová a , O. Bláhová a , and M. pírková b<br />
( a New Technology Research Centre, University of West Bohemia,<br />
Plze , b Institute of Macromolecular Chemistry, Academy<br />
of Sciences of the Czech Republic, Prague, Czech Republic):<br />
The Influence of Additives on Mechanical Properties of<br />
Organic-Inorganic Coatings<br />
This paper focuses on the study of hybrid organicinorganic<br />
nanocomposite materials in the form of coatings<br />
applied to a substrate, namely to glass, and separate layers<br />
films. Nanoindentation measuring was used to assess the dependence<br />
of mechanical properties (nanohardness and<br />
modulus of elasticity) on the amount of additive. Further,<br />
these properties are compared for the layer-substrate systems<br />
and the layers themselves. Samples in the form of foils confirm<br />
the increasing hardness and modulus of elasticity with<br />
a higher content of the additive. The results of this work<br />
should contribute to optimizing the formation of such layers<br />
with respect to applications requiring higher wear resistance.
Chem. Listy 105, s178 s181 (2011) LMV <strong>2008</strong> Regular Lectures<br />
CONTACT STRENGTH MEASUREMENTS AND CONE CRACK FORMATION<br />
OF Si3N4 AND SiC BASED CERAMICS<br />
LUCIA HEGED SOVÁ and JÁN DUSZA<br />
Institute of Materials Research, Slovak Academy of Sciences,<br />
Watsonova 47, 040 01 Ko ice, Slovak Republic<br />
lhegedusova@imr.saske.sk, lucia.hegedusova@yahoo.com<br />
Key words: contact strength, bending strength, Weibull parameters,<br />
Fett s theory, crack propagation<br />
1. Introduction<br />
Conventional strength tests describe the failure behaviour<br />
of materials under simple stress states to comprise mostly<br />
uni-axial stresses with relatively small stress gradients. Considering<br />
practical applications 1 3 , mechanical loading often<br />
leads to strongly non-homogeneous and multi-axial stress<br />
states to be also induced by contact loading by line or point<br />
loads. In principle, the determination of strength under the<br />
contact loading results from the Weibull theory to include<br />
a multi-axial failure criterion. The contact loading by line and<br />
point loads can be induced by opposite rollers and opposite<br />
spheres using the devices shown in Figs.1 and 2, respectively.<br />
Proposed by Fett and illustrated in Fig. 1 (ref. 4 ), a device<br />
for the contact strength test using using rollers with the diameter<br />
D = 2R is shown in Fig. 1. Two rollers made of hardened<br />
steel are pressed onto the rectangular specimen with the<br />
force P. With regard to the Fett s theory 4 , a relationship between<br />
the characteristic strength 0,cont and 0,bend determined<br />
by the contact test using rollers and the four-point bending<br />
test, respectively, is derived as<br />
0,bend 0,cont (1)<br />
where 0,cont is derived by the Weibull analysis 5 considering<br />
the measured stress cont in the form 4<br />
cont = 0.98 P / (H t) (2)<br />
Similarly, 0,bend is determined by the Weibull analysis<br />
considering bend derived as 4<br />
bend = 3P(S1 S2) / (2BW 2 ) (3)<br />
Fig. 1. Schematic illustration of a device for the contact test using<br />
rollers 4<br />
s178<br />
Fig. 2. Schematic illustration of a device for the contact test<br />
using spheres 4<br />
where S2 and S1 are inner and outer spans, respectively. Similarly,<br />
with regard to the Fett s theory, a relationship between<br />
the Weibull moduli mcont and mbend is derived as 4<br />
mbend 2 mcont (4)<br />
Proposed by Fett, a device for the contact strength test<br />
using spheres is shown in Fig. 2 (ref. 6 ). The rectangular bar<br />
(1) is loaded via two opposing spheres (2) with the radius R<br />
which are loaded by the force P. The load P is transferred to<br />
the upper sphere by a steel roller (3) guided by the hollow<br />
roller (4). The test can be carried out using bending bars or<br />
fragments of shorter length.<br />
The characteristic strength 0,cont determined by the<br />
contact test using spheres, derived by the Weibull analysis 5 ,<br />
consider the strength cont in the form 6<br />
cont = (1 2 2)[6P(E´/R) 2 ] 1/3 / (3 )<br />
1 / E´= [(1 1 2 ) / E1] + [(1 2 2 ) / E2] (5)<br />
where E1, 1 and E2, 2 are the Young s modulus, the Poisson<br />
s ratio for the spheres and an investigated ceramic material,<br />
respectively.<br />
2. Experimental procedure and materials<br />
Mechanical tests. The contact tests using rollers and<br />
spheres (see Figs. 1, 2) with the diameter D = 2R = 3 mm of<br />
the rollers and the radius R = 2 mm of the spheres were performed<br />
by Lloyd LR 5KPlus at room temperature. The rollers<br />
and spheres both of standard hardened steel were applied to<br />
specimens with the dimensions W = 3 mm, B = 4 mm,<br />
L = 10 15 mm or L = 25 mm. The four-point bending test<br />
with S1 = 40 mm, S2 = 20 mm was applied to specimens with<br />
dimensions of W = 3 mm, B = 4 mm, L = 45 mm. Specimens<br />
used for all mechanical tests were cut by diamond tools,<br />
ground and consequently polished with 15 m finish. The<br />
specimen edges were chamfered to minimize the influence of<br />
the stress concentration. The contact test using rollers and the<br />
four-point bending test were realized in such a way that the<br />
load P was increased up to the critical load Pc which caused<br />
the specimen failure. A part of a number of specimens were
Chem. Listy 105, s178 s181 (2011) LMV <strong>2008</strong> Regular Lectures<br />
tested in the contact test using spheres in such a way, that the<br />
load of the specimens was stopped before the critical load, i.e.<br />
before the specimen failure at the load P = 4.9 kN, with an<br />
aim to investigate a character of the crack growth during the<br />
loading regime. These un-failured specimens were cut<br />
through the centre of the contact area, ground and polished<br />
due to optical electron microscopy for the determination of<br />
the crack length c and the angle between the crack and<br />
a contact surface. The rest of a number of specimens was<br />
loaded till the specimen failure. All mechanical tests were<br />
performed at a loading rate of 0.5 mm min 1 .<br />
Experimental materials and microstructure. The<br />
following ceramic materials were investigated:<br />
1. Si3N4 with the additives 3 % Al2O3 and 3 % Y2O3,<br />
sintered in the atmosphere N2, produced by CeramTec<br />
(Plochingen, Germany), and provided in a form of plates with<br />
the dimensions 47×11×102 mm.<br />
2. SiC prepared as a mixture of the commercially available<br />
-SiC powder (HSC-0.59, Superior Graphite) with the<br />
additives of 5 % Si3N4, 2.8 % Al2O3 and 5.7 % Y2O3, hot<br />
pressed at 1870 °C h 1 in the atmosphere N2 and subsequently<br />
annealed at 1650 °C/5 h, prepared at Institute of Inorganic<br />
Chemistry SAS Bratislava in the form of plates with the dimensions<br />
60×60×6 mm.<br />
Microstructure of Si3N4 (see Fig.3a) consists of moderately<br />
elongated -Si3N4 grains with the aspect ratio of 3 5<br />
and of inter-granular glassy phase with the volume fraction<br />
12 %, and additionally small amount of Fe originating from<br />
the used powder for the material preparation. Microstructure<br />
of the SiC (see Fig. 3b) consists of fine submicron-sized equiaxed<br />
SiC grains with a low aspect ratio and of very thin inter-<br />
Fig. 3. SEM micrographs of characteristic microstructure of<br />
Si3N4 (a) and SiC (b), both plasma etched<br />
s179<br />
granular phases/triple points. The average size of the SiC<br />
grains is 450 nm.<br />
Material parameters considered in Eq. (5) are as follows:<br />
hardened steel of spheres E1 = 200 GPa, 1 = 0.29; Si3N4<br />
E2 = 310 GPa, 2 = 0.24; SiC E2 = 400 GPa, 2 = 0.24.<br />
3. Results and discussion<br />
Contact test using rollers and four-point bending<br />
test. The characteristic strength 0,cont, 0,bend, the Weibull<br />
moduli mcont, mbend determined by the Weibull distribution,<br />
and the ratios mbend / mcont, 0,cont / 0,bend are presented in<br />
Table I<br />
The characteristic strength 0,cont, 0,bend and the Weibull<br />
moduli mcont, mbend<br />
Material mcont mbend mbend mcont Eq. (4)<br />
a<br />
b<br />
Si3N4 7.1 13.9 1.96 2<br />
SiC 8.95 10.6 1.18 2<br />
0,cont<br />
[MPa]<br />
0,bend<br />
[MPa]<br />
0,cont 0,bend<br />
Eq. (1)<br />
Si3N4 766.3 727.8 1.05 1<br />
SiC 617.1 437.1 1.41 1<br />
Fig. 4. The Weibull distribution of the characteristic strength<br />
0,cont [MPa], 0,bend [MPa], and Weibull moduli mcont, mbend related<br />
to the contact test using rollers (a), and to the four-point<br />
bending test (b) for the investigated materials
Chem. Listy 105, s178 s181 (2011) LMV <strong>2008</strong> Regular Lectures<br />
Tab. I, Fig. 4, where mcont, 0,cont and mbend, 0,bend are related<br />
to the contact test using rollers and the four-point-bending<br />
test, respectively.<br />
According to the results, the characteristic strength values<br />
for the silicon nitride ceramics were very similar in contact<br />
and bending strength tests but for the silicon carbide the<br />
characteristic strength in bending test was lower comparing to<br />
the value of the contact strength. The Weibull modulus obtained<br />
for Si3N4 using contact strength method is approximately<br />
half of the modulus from the bending method except<br />
SiC, where the Weibull modulus in contact mode is similar to<br />
the modulus obtained from the bending strength result. The<br />
very low characteristic strength in bending mode in the case<br />
of SiC is caused by the presence of large processing flaws<br />
representing fracture origins. As it was found by fractographical<br />
analysis (see Fig. 5b), such flaws with different size (from<br />
5 m to 100 m), shape and location (distance from the tensile<br />
surface) decrease not only the characteristic bending<br />
strength but also lead to the low Weibull modulus for this<br />
material. The significantly different Weibull moduli in comparison<br />
of the bending and contact strength tests can be explained<br />
also by the existence of strong stress gradient near the<br />
contact areas, in the case of contact strength test in contrast to<br />
the bending test with significantly lower stress gradient. In the<br />
case of the silicon nitride ceramics tested in bending test, the<br />
fracture origin in the form of processing flaws was identified<br />
only randomly as Fe inclusions (see Fig. 5a), and the fracture<br />
origin was at the tensile surface and corners of the specimens<br />
in the form of small surface defects.<br />
According to the result of ceramographic/fractographic<br />
examination, the characteristic damage mechanisms arising<br />
during the loading in the contact mode were located below the<br />
surface of the specimens in the form of lateral, median and<br />
contact end cracks as shown in Fig. 6 for Si3N4. The different<br />
Fig. 5. Fracture surfaces of Si3N4 (a) and SiC (b) loaded by the<br />
contact test using rollers and the four-point bending test, respectively.<br />
Fracture origin in SiC (b)<br />
s180<br />
Fig. 6. A cross-section view of a surface between two rollers:<br />
lateral, median and contact end cracks in Si 3N4<br />
crack types could be present at the contact surface and specimen<br />
sides of one experiment. A typical order of crack appearance<br />
was established by correlating the presence of different<br />
cracks and applied load in each experiment. Notably, the first<br />
cracks were always found at the specimen sides. At one or<br />
both of specimen sides, a surface parallel crack was visible at<br />
a depth that was approximately one to two times the contact<br />
width 2a. The crack typically displayed a slightly concave<br />
shape with the edges drawn towards the contact surface. In<br />
experiments that had proceeded, the cracks of a second type<br />
were distinguishable. These cracks were vertical and located<br />
between the surface parallel crack and the contact mark. They<br />
typically started at the top side of the first crack and grew<br />
towards the contact surface. In some experiments, the cracks<br />
reached the contact surface at the contact end.<br />
Following the nomenclature that is used for similar subsurface<br />
contact cracks in ceramics, the first crack was named<br />
lateral crack and second crack was named median crack. Last<br />
cracks were often found together in the contact surface. A few<br />
tests did only contain the crack at the corner between specimen<br />
side and surface. It was named a contact end crack. Due<br />
to the contact symmetry, up to four contact end cracks may<br />
appear in one test. They meet the specimen corner at<br />
a perpendicular angle in both surface and side views. In the<br />
surface, they are curved towards the contact edge.<br />
Table II<br />
The characteristic strength 0,cont, 0,bend and the Weibull<br />
moduli mcont, mbend<br />
Material mcont mbend mbend mcont<br />
Si3N4 22.6 13.9 0.62<br />
SiC 20.5 10.6 0.52<br />
0,cont<br />
[MPa]<br />
0,bend<br />
[MPa]<br />
0,cont 0,bend<br />
Si3N4 3344.2 727.8 4.55<br />
SiC 3327.6 437.1 7.61
Chem. Listy 105, s178 s181 (2011) LMV <strong>2008</strong> Regular Lectures<br />
Contact test using spheres. The characteristic strength<br />
0,cont, 0,bend together with the Weibull moduli mcont, mbend<br />
determined by the Weibull distribution, and the ratios mbend/<br />
mcont, 0,cont/ 0,bend are presented in Tab. II, Fig. 7, where<br />
mcont, 0,cont and mbend, 0,bend are related to the contact test<br />
using rollers and the four-point-bending test, respectively.<br />
With regard to the higher values of mcont of the contact test<br />
using spheres compared to those of both the contact test using<br />
rollers and the four-point bending test (see Tab. I), the contact<br />
test using spheres is assumed to be the most precise and accordingly<br />
the most considerable for the determination of<br />
strength of ceramic materials. As assumed in 6 , the preciseness<br />
can be explained by stable growth of the cone cracks originating<br />
during the contact test using spheres, and not by an initial<br />
size distribution of the flaws to originate during the processing.<br />
According to Fig. 8, the damages/fracture origins in<br />
contact mode were located at the tensile surface of the sample<br />
in the form of similar cone cracks arising to a critical size<br />
during the loading, and controlling the fracture, in contrast to<br />
the bending mode when the fracture is controlled by processing<br />
defects. The radius of the cone crack in Si3N4 was significantly<br />
larger than that in SiC, and one crack is initiated only<br />
(see Fig. 8a). The cone crack was nearly perpendicular to the<br />
specimen surface (5 10 m), than changed its direction and<br />
Fig. 7. The Weibull distribution of the characteristic strength<br />
0,cont [MPa]<br />
Fig. 8. Optical micrographs of cross-section views of the<br />
contact sites in Si3N4 (a) and SiC (b)<br />
s181<br />
grew up to the critical size of 200 m. In SiC material the<br />
cone crack originated at lower load and therefore the cone<br />
crack radius is smaller. In this case, typically multi-cracks are<br />
initiating with the first main crack which is longer comparing<br />
to the crack in Si3N4 (see Fig. 8b). The multi-crack formation<br />
is connected with the deformation of the sphere when the load<br />
is increasing and with the enlarged contact area between the<br />
sphere and specimens. In the tougher Si3N4 the cone crack<br />
originates at higher loads and the further deformation of<br />
sphere is not so significant and does not initiate further crack<br />
growth.<br />
Finally, in the case of the contact strength test using<br />
spheres, no good correlation between the contact and bending<br />
strength values is observed.<br />
This work was supported by the Slovak Research and Development<br />
Agency under the contracts No. APVV-0034-07, by<br />
the Slovak Grant Agency VEGA 2/7194/27, by NANOSMART<br />
Centre of Excellence (1/1/ <strong>2007</strong>-31/12/2010) Slovak Academy<br />
of Sciences, by HANCOC-MNT.ERA-NET, by NENAMAT<br />
INCO-CT-2003-510363.<br />
REFERENCES<br />
1. Ceniga L., in book: Ceramic and Composite Materials,<br />
chap. 5, p. 147, Nova Science Publishers, New York<br />
2005.<br />
2. Ceniga L., in book: New Development in Materials Science<br />
Research, chap. 4, p. 139, Nova Science Publishers,<br />
New York <strong>2007</strong>.<br />
3. Bidulská J., Bidulský R., Ceniga L., Kva kaj T., Cabibbo<br />
M., Evangelista E.: Metall. Mater. 46, 151 (<strong>2008</strong>).<br />
4. Fett T., Munz D.: Eng. Fract. Mech. 69, 1353 (2002).<br />
5. Dor áková F.: PhD thesis, Institute of Materials Research,<br />
Slovak Academy of Sciences, Ko ice 2004.<br />
6. Fett T., Ernst E., Munz D.: J. Mater. Sci. 21, 1955<br />
(2002).<br />
L. Heged sová and J. Dusza (Institute of Materials<br />
Research, Slovak Academy of Sciences, Ko ice, Slovakia):<br />
Contact Strength Measurements and Cone Crack Formation<br />
of Si3N4 and SiC Based Ceramics<br />
The paper deals with an investigation of contact strength<br />
determined by contact tests applied to Si3N4 and SiC ceramic<br />
materials, where loading of the contact tests is induced by<br />
opposite rollers and opposite spheres. Experimental results of<br />
the contact tests are compared with those of the four-point<br />
bending test, and consequently the comparison of the Weibull<br />
parameters in the contact and bending modes results in the<br />
verification or the refutation of the Fett s theory. Resulting<br />
from microstructural analysis, a reason of deviations from the<br />
Fett s theory is determined. In general, the contact tests using<br />
rollers and spheres applied to a brittle material induce different<br />
types of cracks, i.e. lateral, median, contact end cracks and<br />
cone cracks, respectively. In addition to the contact strength<br />
determination, an investigation of the crack initiation and<br />
propagation is performed.
Chem. Listy 105, s182 s186 (2011) LMV <strong>2008</strong> Regular Lectures<br />
NANOINDENTA NÍ M ENÍ HVOF ST ÍKANÝCH POVLAK<br />
ÁRKA HOUDKOVÁ a , FRANTI EK<br />
ZAHÁLKA a , MICHAELA KA PAROVÁ a<br />
a OLGA BLÁHOVÁ b<br />
a KODA VÝZKUM s.r.o., Tylova 57, Plze , 31600, R,<br />
b NTC Z U, Univerzitní 8, Plze , 306 14, R<br />
sarka.houdkova@skodavyzkum.cz , blahova@ntc.zcu.cz<br />
Klí ová slova: nanoindentace, HVOF, árové nást iky<br />
1. Úvod<br />
árový nást ik je ásticový proces vytvá ení povlak<br />
o tlou ce obvykle v t í ne 50 m, kdy je naná ený materiál<br />
ve form prá ku (p ípadn drátu) p ivád n do za ízení, kde<br />
dojde k jeho natavení a urychlení sm rem k povlakované<br />
sou ásti. Po dopadu na substrát dojde k výraznému plo nému<br />
rozprost ení ástice a k jejímu rychlému utuhnutí. Tím se<br />
vytvá í povlak s charakteristickou lamelární strukturou<br />
a specifickými vlastnostmi. Technologie árových nást ik<br />
umo uje vytvá et povlaky z t ch druh keramik, kov<br />
a jejich slitin, u kterých nedochází k rozpadu pod bodem tání,<br />
na prakticky v echny typy materiál substrátu. Technologický<br />
proces zaru uje teploty povlakované sou ásti hluboko pod<br />
teplotou fázov -strukturních pem n (cca 80 120 °C), co<br />
brání ne ádoucím deformacím sou ásti.<br />
Struktura povlaku je tvo ena jednotlivými deformovanými<br />
ásticemi. Míra porezity, stejn jako kvalita zakotvení<br />
povlaku k povrchu substrátu a výskyt nenatavených i zoxidovaných<br />
ástic jsou závislé na teplot a rychlosti dopadajících<br />
ástic. Teplota a rychlost ástic jsou nejd le it j ími parametry<br />
procesu árového nást iku, pímo ovliv ujícími kvalitu<br />
výsledného povlaku. Jednotlivé technologie árového nást iku<br />
dosahují v závislosti na pou itém zdroji tepelné energie, konstrukci<br />
a nastavení procesních parametr r zných hodnot<br />
teploty a rychlosti ástic. V p ípad technologie HVOF<br />
(vysokorychlostní nást ik plamenem) je díky unikátní konstrukci<br />
ho áku dosahováno vysokých rychlostí letících ástic<br />
za relativn nízkých teplot (v porovnání nap . s plazmatickým<br />
nást ikem, viz Smith a spol. 1 (1991)). To umo uje vytvá et<br />
husté povlaky s nízkou mírou dekompozice povlaku b hem<br />
nást iku a velmi vysokou adhezí k základnímu materiálu.<br />
Technologií árového nást iku mohou být p ipravovány<br />
povlaky z r zných typ materiál s rozsahem vlastností vhodných<br />
jak pro aplikaci v plynových turbínách, tak nap .<br />
v elektronickém pr myslu. Velkou skupinou povlak jsou<br />
povlaky ur ené jako ochrana proti opot ebení, asto<br />
v kombinaci s odolností proti vysokým teplotám nebo koroznímu<br />
napadení.<br />
Tato studie je zam ena na povlaky, jejich ú elem je<br />
zvý ení odolnosti povlakované sou ásti proti opot ebení.<br />
Materiálem t chto povlak jsou tzv. tvrdokovy, kompozity na<br />
bázi kovových slitin vyztu ených karbidickými ásticemi.<br />
s182<br />
Mikrostruktura HVOF st íkaných cermetových povlak je<br />
tvo ena tvrdými, obvykle karbidickými ásticemi a kovovou<br />
matricí, ve které jsou ástice zakotveny. Vlastnosti ástic<br />
a matrice a jejich vzájemná synergie jsou ur ující pro celkové<br />
vlastnosti povlaku. Studium mechanism opot ebení cermetových<br />
povlak vak prokázalo, e dle zp sobu opot ebení<br />
a vlastností konkrétních ástic a materiálu matrice dochází<br />
k opot ebení p ednostn u n kterých strukturních komponent.<br />
Proto byla pozornost zam ena na zji t ní vlastností jednotlivých<br />
komponent pomocí nanoindentoru, který umo nil stanovit<br />
jejich základní mechanické charakteristiky tvrdost<br />
a modul pru nosti. Jejich vzájemný pom r E/H charakterizuje<br />
elastickoplastické vlastnosti hodnocených materiál . Znalost<br />
t chto základních mechanických charakteristik umo uje<br />
nejen pímo predikovat jejich odolnost proti opot ebení<br />
a k ehkému poru ení, ale je nutná i ke stanovení dal ích materiálových<br />
konstant, jako je nap íklad odolnost proti í ení<br />
trhlin hodnocená metodou m ení indenta ní lomové hou evnatosti.<br />
Sou asn byly zmi ované mechanické charakteristiky<br />
hodnoceny u povlak , které byly vystaveny tepelnému zpracování.<br />
Vliv expozice tepelnému namáhání na strukturu<br />
a vlastnosti tvrdokov naná ených technologií árového nást<br />
iku je tématem celé ady studií 2 4 .<br />
2. Experimentální podmínky<br />
Mechanické vlastnosti strukturních komponent byly<br />
hodnoceny na dvou r zných HVOF st íkaných povlacích na<br />
bázi tvrdokovu: Cr3C2-NiCr a (Ti,Mo)(C,N)-NiCo. Povlaky<br />
byly nast íkány technologií HVOF, systémem TAFA JP-<br />
5000 na pracovi ti KODA VÝZKUM s.r.o. s vyu itím standardního<br />
postupu p ípravy vzork a optimalizovaných depozi<br />
ních parametr . Podmínky depozice jsou uvedeny jinde 5 .<br />
Materiál Cr3C2-NiCr ve form prá ku je komer n dostupný<br />
pod ozna ením 1375VM, materiál (Ti,Mo)(C,N)-NiCo<br />
s pracovním názvem S49 je experimentálním prá kem, vyvinutým<br />
v Fraunhofer Institute v Drá anech.<br />
ást vzork byla tepeln zpracována ve KODA VÝ-<br />
ZKUM s.r.o. íháním po dobu 8 h na teplotu 700 °C. Mikrostruktura<br />
vybraných árových nást ik byla hodnocena<br />
s pou itím SEM na pracovi ti KODA VÝZKUM s.r.o.<br />
M ení nanotvrdosti bylo realizováno na pracovi ti NTC<br />
Z U. Hodnocení mechanických vlastností bylo provedeno na<br />
p í ném metalografickém výbrusu povlakem. Pro m ení byl<br />
pou it nanoindentor Nano Indenter XP. V povlaku Cr3C2-<br />
NiCr bylo z d vodu velkého rozptylu nam ených výsledk<br />
provedeno celkem 200 m ení, 100 v oblasti matrice a 100<br />
v oblasti karbidických ástic, v povlaku (Ti,Mo)(C,N)-NiCo<br />
bylo provedeno celkem 60 jednotlivých m ení, v dy 30 m -<br />
ení v oblasti matrice a 30 m ení v oblastech karbidických<br />
ástic. Na základ analýzy výsledk , které neprokázaly vy í<br />
spolehlivost m ení v p ípad výb ru lokalit, bylo pro m ení<br />
tepeln zpracovaných povlak zvoleno hodnocení<br />
v náhodných lokalitách. V ka dém povlaku bylo provedeno<br />
60 m ení. V pr b hu m ení byla snímána velikost tvrdosti,
Chem. Listy 105, s182 s186 (2011) LMV <strong>2008</strong> Regular Lectures<br />
modulu pru nosti a zat ování na hloubce proniknutí. Ve<br />
v ech p ípadech byla pou ita konstantní hloubka proniknutí<br />
indentoru 1 m, pro indentaci byl pou it Berkovich v indentor.<br />
Po ukon ení m ení byla nam ená data t íd na pomocí<br />
programu TEST WORKS, kde byla provedena selekce a t íd<br />
ní dat na karbidickou a matri ní fázi.<br />
3. Výsledky m ení<br />
Mikrostruktura hodnocených árových nást ik v tepeln<br />
nezpracovaném stavu je zobrazena pomocí SEM na obr. 1.<br />
Mikrostruktura HVOF st íkaného povlaku Cr3C2-NiCr je<br />
relativn homogenní, s nízkým obsahem pór . Krom karbid<br />
Cr3C2 a NiCr matrice obsahuje i oxidickou fázi Cr2O3,<br />
vzniklou jako produkt oxidace bhem procesu nást iku,<br />
a pravd podobn té karbidy Cr7C3 a Cr23C6 s tvrdostí ni í<br />
ne výchozí Cr3C2, vzniklé oduhli ením bhem nást iku 6 .<br />
Vlivem rozpou t ní karbid v matrici b hem nást iku dochází<br />
ke zvý ení koncentrace C a Cr v matrici ve srovnání<br />
s výchozím prá kem. To umo uje tavenin solidifikovat jako<br />
kvaziamorfní nebo nanokrystalická struktura bohatá na Cr<br />
a C. Vlivem rychlého tuhnutí se ve struktu e povlaku objevují<br />
i dal í kovové nanokrystalické fáze s velikostí zrna cca<br />
10 nm, tvo ené 50 % Ni a 50 % Cr (cit. 7 ). Oxidace povlaku<br />
Cr3C2-NiCr za zvý ených teplot vytvá í oxidickou vrstvu<br />
Cr2O3, která je velmi dob e adhezn vázána na povrch povlaku<br />
a je velmi kompaktní.<br />
a<br />
b<br />
Obr. 1. Mikrostruktury árových nást ik ; a) Cr3C2-NiCr,<br />
b) (Ti,Mo)(C,N)-NiCo<br />
s183<br />
Mikrostruktura HVOF st íkaného povlaku (Ti,Mo)<br />
(C,N)-NiCo je podrobn popsána v cit. 6 . V prá ku byly detegovány<br />
core-rim kubické fáze, vlivem nedokon ené reakce<br />
p i sintrování se objevuje té Mo2C. Po nást iku se v povlaku<br />
objevuje té Ti2O3. Oxidací za vy ích teplot vzniká oxidická<br />
vrstva, tvo ená temi vrstvami. Vn j í je z Co3O4, st ední<br />
z CoMoO4 a vnit ní je tvo ená ásticemi Ti2O3 (rutil)<br />
v matrici CoMoO4. Ti2O3 se vyskytuje i v jiné modifikaci,<br />
jako tzv. anatas, ale ten je p echodový a objevuje se pouze p i<br />
teplotách do 500 °C.<br />
Výsledky nanoindenta ních m ení byly zpracovány do<br />
graf na obr. 2 5, zobrazujících závislost obou sledovaných<br />
charakteristik, tvrdosti a modulu pru nosti, na okam ité<br />
hloubce proniknutí indentoru. Z graf je patrné, e snímané<br />
charakteristiky se b hem pronikání indentoru do materiálu<br />
a zv t ováním oblasti ovlivn né vtiskem m ní od vlastností<br />
jednotlivých mikrostrukturních sou ástí (karbid i karbonitrid<br />
a matrice) sm rem k hodnotám, vyjad ujícím vlastnosti<br />
kompozitu tvrdokovu. U tvrdých fází byla za tvrdost a modul<br />
pru nosti brána nejvy í dosa ená hodnota, ke které byl stanoven<br />
interval hloubky proniknutí s nejvy í hodnotou sledované<br />
charakteristiky.<br />
Rozborem graf výsledk CSM metody nanoindenta ního<br />
m ení tepeln nezpracovaného povlaku Cr3C2-NiCr<br />
(obr. 2) byly identifikovány 4 fáze. Na základ 3 byl výskyt<br />
fází s vlastnostmi mezi vlastnostmi matrice a nejtvrd ího karbidu<br />
(pravd podobn Cr3C2) p ipsán existenci ni ích karbid<br />
Cr7C3 a Cr23C6 s tvrdostí ni í ne výchozí Cr3C2, vzniklé<br />
oduhli ením b hem nást iku.<br />
P i hodnocení tepeln zpracovaného povlaku Cr3C2-<br />
NiCr (obr. 3) nebylo mo né identifikovat v echny 4 fáze stejn<br />
jako u povlaku nezpracovaného. Na základ CSM metody<br />
byly identifikovány pouze ti fáze, z nich jedna odpovídá<br />
svým pr b hem matrici. Druhé dv jsou ozna eny karbid 20<br />
25 GPa a karbid 25 20 GPa dle hodnoty maximální dosa<br />
ené hodnoty tvrdosti. Spolehlivost identifikace jednotlivých<br />
fází je v ak výrazn závislá na mí e rozdílnosti jejich<br />
elasticko-plastického chování, a tudí m e být u r zných<br />
materiál rozdílná. Zna ná heterogenita árov st íkaných<br />
povlak sni uje p esnost identifikace a iní jí zna n obtí -<br />
nou.<br />
Rozborem graf výsledk CSM metody nanoindenta ní-<br />
Obr. 2. Pr b h tvrdosti v závislosti na hloubce proniknutí indentoru<br />
(CSM metoda) tepeln nezpracovaného povlaku Cr3C2-NiCr
Chem. Listy 105, s182 s186 (2011) LMV <strong>2008</strong> Regular Lectures<br />
Obr. 3. Pr b h tvrdosti v závislosti na hloubce proniknutí indentoru<br />
(CSM metoda) povlaku Cr3C2-NiCr íhaného p i teplot<br />
700 °C po dobu 8 hodin<br />
Obr. 4. Pr b h tvrdosti v závislosti na hloubce proniknutí indentoru<br />
(CSM metoda) tepeln nezpracovaného povlaku (Ti,Mo)<br />
(C,N)-NiCo<br />
ho m ení tepeln nezpracovaného povlaku (Ti,Mo)(C,N)-<br />
NiCo (obr. 4) byly identifikovány pouze 2 fáze fáze, její<br />
tvar k ivky H-h odpovídá matrici, a fáze, její tvar k ivky H-h<br />
odpovídá tvrdé fázi, ozna ené jako karbonitrid.<br />
P i hodnocení tepeln zpracovaného povlaku (Ti,Mo)<br />
s184<br />
Obr. 5. Pr b h tvrdosti v závislosti na hloubce proniknutí indentoru<br />
(CSM metoda) povlaku (Ti,Mo)(C,N)-NiCo íhaného pi<br />
teplot 700 °C po dobu 8 hodin<br />
(C,N)-NiCo (obr. 5) byly výsledky m ení rozt íd ny do 3<br />
skupin jedna odpovídající matrici a dv tvrdé fázi, ozna ené<br />
karbonitrid a ni í karbid .<br />
Výsledky m ení, hodnoty H a E [GPa] povlak Cr3C2-<br />
NiCr a (Ti,Mo)(C,N)-NiCo v tepeln nezpracovaném<br />
i íhaném stavu jsou pro jednotlivé fáze i pro kompozit uvedeny<br />
v tabulce I IV.<br />
3. Diskuse výsledk a záv r<br />
Výsledky m ení pomocí metody CSM, zobrazené<br />
Tabulka I<br />
Hodnoty sledovaných mechanických charakteristik povlaku Cr3C2-NiCr nam ených metodou CSM maximální nam ené hodnoty<br />
karbid (tvrdost H a modul pru nosti E)<br />
Cr3C2- NiCr H maximální H kone ná E maximální<br />
Assprayed<br />
Tabulka II<br />
Hodnoty sledovaných mechanických charakteristik povlaku<br />
Cr3C2-NiCr ur ených metodou Oliver-Pharr z odleh ovací<br />
ásti zat ovací k ivky p i zatí ení do hloubky 1 m<br />
Cr3C2-NiCr H [GPa] E [GPa] E/H<br />
As-sprayed 12,3±2,2 231±23 18,7<br />
íhaný 10,7±1,8 220±10 20,5<br />
E kone ný<br />
H [GPa] h [nm] H [GPa] h [nm] E [GPa] h [nm] E [GPa] h (nm)<br />
Cr3C2 25±3,4 87 14,6±2,8 820 362±45 37 247±24 820<br />
karbid 1 17±1,5 93 12,1±2,3 536 255±33 28 235±23 829<br />
karbid 2 21±2,3 83 13,6±3,1 829 301±34 28 233±14 713<br />
matrice 13,6±2,8 986 243±27 986<br />
íhaný karbid 20-25 20,6±0,6 169 10,4±2,3 750 302±47 23 207±10 750<br />
karbid 15-20 15,3±2,7 88 11,8±2,1 827 259±38 31 215±14 827<br />
matrice 12,4±1,9 796 218±14 796
Chem. Listy 105, s182 s186 (2011) LMV <strong>2008</strong> Regular Lectures<br />
v grafech na obr. 2 5, dávají dobrou pedstavu o pr b hu<br />
okam itých hodnot sledovaných mechanických vlastností<br />
v závislosti na hloubce proniknutí indentoru, tzn. v závislosti<br />
na velikosti oblasti ovlivn né vtiskem. V p ípad tvrdých fází<br />
je maxima sledovaných hodnot dosahováno poka dé v jiné<br />
hloubce proniknutí indentoru, v závislosti na velikosti strukturní<br />
komponenty a jejích vlastnostech.<br />
Informace o hloubkách proniknutí indentoru odpovídajících<br />
maximu sledované hodnoty tvrdosti, resp. modulu pru -<br />
nosti, jsou spolu s dal ími uvedeny v tabulce I a III. V p ípad<br />
povlaku Cr3C2-NiCr se hloubka proniknutí indentoru odpovídající<br />
maximální nam ené hodnot tvrdosti pohybovala<br />
v rozmezí 80 90 nm, zatímco pro maximální nam ené hodnoty<br />
modulu pru nosti v rozmezí 30 40 nm. V p ípad povlaku<br />
(Ti,Mo)(C,N)-NiCo se hloubka proniknutí indentoru odpovídající<br />
maximální nam ené hodnot tvrdosti pohybovala<br />
v rozmezí 45 90 nm, zatímco pro maximální nam ené hodnoty<br />
modulu pru nosti v rozmezí 17 65 nm. Rozdíl ve velikosti<br />
rozmezí mezi povlakem Cr3C2-NiCr a (Ti,Mo)(C,N)-<br />
NiCo je dán rozdílem mikrostruktur obou povlak . Zatímco<br />
mikrostrukturu povlaku Cr3C2-NiCr tvo í karbidy Cr3C2, p ípadn<br />
karbidy ni í vzniklé vyho íváním uhlíku p i nást iku<br />
s definovaným rozmezím velikosti karbid ve výchozím materiálu<br />
(prá ku), obsahuje komplexní mikrostruktura povlaku<br />
(Ti,Mo)(C,N)-NiCo tvrdé ástice karbonitrid ve form tzv.<br />
core-rim fází, jejich velikostní rozmezí je mnohem v t í. Z<br />
informací o hloubkách proniknutí indentoru se bude vycházet<br />
p i dal ích m eních vlastností konkrétních fází pomocí nanoindentace.<br />
Ani u jednoho materiálu nebyl pozorován vliv<br />
íhání na hloubku proniknutí indentoru odpovídající maximu<br />
sledovaných hodnot.<br />
V p ípad m ení nanoindentorem s hloubkou proniknutí<br />
1 µm, co odpovídá zatí ení cca 200 mN, se materiálové konstanty<br />
m í v rámci jednoho splatu. Na této strukturní úrovni<br />
bylo provedeno porovnání hodnot sledovaných vlastností<br />
stanovených pomocí r zných metod. Ukázalo se, e v p ípad<br />
tvrdosti je dosahováno nejvy ích hodnot pou itím metody<br />
CSM, metoda Oliver-Pharr dává hodnoty mírn ni í. Tento<br />
trend je platný pro oba hodnocené povlaky v tepeln nezpracovaném<br />
i íhaném stavu. V p ípad modulu pru nosti není<br />
situace tak jednozna ná. V tepeln nezpracovaném stavu dosahovaly<br />
hodnoty E stanovené metodou CSM vy ích hodnot<br />
ne pou itím metody Oliver-Pharr. U povlak , které byly<br />
íhány, je v ak situace opa ná: íhané povlaky dosahovaly<br />
vy ích hodnot E, ale rozdíl nebyl velký. Pom r E/H, který<br />
s185<br />
charakterizuje plasticitu, vychází vy í, pou ijeme-li výsledky<br />
H a E stanovené metodou Oliver-Pharr.<br />
Vliv tepelného zpracování na sledované hodnoty byl<br />
u v ech hodnocených vzork i metod stejný: tvrdost i modul<br />
pru nosti byly vy í u povlak po nást iku, tepelné zpracování<br />
zp sobilo jejich pokles. Tento pokles byl nejvýrazn j í<br />
u karbid povlaku Cr3C2-NiCr, kde tvrdost poklesla o 20 a<br />
25 % a modul pru nosti o 15 20 % (stanoveno metodou<br />
CSM). Pokles hodnot tvrdosti povlaku v rámci jednoho splatu<br />
inil 9 % pro metodu CSM a 14 % pro metodu Oliver-<br />
Pharr. Modul pru nosti klesl o 11 % pro metodu CSM a 5 %<br />
pro metodu Oliver-Pharr. Pokles u povlaku (Ti,Mo)(C,N)-<br />
NiCo byl v porovnání s Cr3C2-NiCr men í: u karbonitrid<br />
poklesla tvrdost o 4 % a modul pru nosti 10 24 % (m eno<br />
metodou CSM), v rámci jednoho splatu inil pokles pokles<br />
tvrdosti pouhé 1 % metodou CSM a 4 % metodou Oliver-<br />
Pharr, pokles modulu pru nosti 7 % metodou CSM a 4 %<br />
metodou Oliver-Pharr, co je zm na v rámci experimentální<br />
chyby tém zanedbatelná.<br />
Tato práce vznikla za podpory projektu MSM 4771868401<br />
a projektu MSM 4977751303.<br />
LITERATURA<br />
1. Smith E. B., Power T. J., Barber T. J.: United Technology<br />
Research Centre Report, p. 91. East Hartford, CT<br />
1991.<br />
2. Berger L.-M., Zieris R., Saaro S.: Conf. Proc. ITSC<br />
2005, Basel, Switzerland, 2-4 May 2005, CD, p. 969.<br />
3. En l R., Fiala P., Houdková ., Bláhová O.: Conf. Proc.<br />
ITSC 2002, DVS-Verlag, 2002.<br />
4. Houdková ., Zahálka F., Ka parová M.: Sborník konference<br />
Vrstvy a povlaky <strong>2007</strong>, 29.-30. October <strong>2007</strong>, Ro -<br />
Tabulka III<br />
Hodnoty sledovaných mechanických charakteristik povlaku (Ti,Mo)(C,N)-NiCo nam ených metodou CSM maximální nam ené<br />
hodnoty karbid (tvrdost H a modul pru nosti E)<br />
(Ti,Mo) (C,N)-NiCo H maximální H kone ná E maximální<br />
Assprayed<br />
Tabulka IV<br />
Hodnoty sledovaných mechanických charakteristik povlaku<br />
(Ti,Mo)(C,N)-NiCo ur ené metodou Oliver-Pharr z odlehovací<br />
ásti zat ovací k ivky p i zatí ení do hloubky 1 m<br />
(Ti,Mo)(C,N)-<br />
NiCo<br />
H [GPa] E [GPa] E/H<br />
As-sprayed 10,1±2 227±23 22,5<br />
íhaný 9,7±1,7 219±17 22,5<br />
E kone ný<br />
H [GPa] h [nm] H [GPa] h [nm] E [GPa] h [nm] E [GPa] h [nm]<br />
karbonitrid 23±2,7 45 11,3±1,9 885 396±51 17 232±23 855<br />
matrice 10,6±2,9 772 232±29 777<br />
íhaný karbonitrid 22,9±2,3 84 10,7±1,8 882 360±48 65 208±23 882<br />
ni í karbid 15,7±2,4 55 10,4±2,3 643 304±51 30 222±27 643<br />
matrice 10,5±1,8 779 217±26 779
Chem. Listy 105, s182 s186 (2011) LMV <strong>2008</strong> Regular Lectures<br />
nov pod Radho t m, p. 49.<br />
5. Houdková ., Zahálka F., Ka parová M.: Conf. Proc.<br />
ITSC <strong>2008</strong>, Maastricht, the Netherlands, 2-4 June <strong>2008</strong>,<br />
CD, p. 1497.<br />
6. Berger L.-M.: Int. Cong. On Adv. Mater., Proc. and Apl.,<br />
October 2001, München, CD, p. 10.<br />
7. Zimmermann S., Kreye H.: Proc. of the 9th National<br />
Thermal Spray Conf., Cincinnati, ASM International,<br />
Materials Park, Ohio, USA (1996), p. 147.<br />
s186<br />
. Houdková a , F. Zahálka a , M. Ka parová a ,<br />
and O. Bláhová b ( a KODA VÝZKUM s.r.o., Plze , Czech<br />
Republic, b NTC Z U, Plze , Czech Republic): Nanoindentation<br />
Measurement of HVOF Sprayed Coatings<br />
The influence of high temperature treatment on mechanical<br />
properties of Cr3C2-NiCr and (Ti,Mo)(C,N)-NiCo HVOF<br />
sprayed coatings were evalueted by nanoindentation measurement.
Chem. Listy 105, s187 s190 (2011) LMV <strong>2008</strong> Regular Lectures<br />
MICROHARDNESS OF PHASE CONSTITUENTS PRESENT IN CREEP-RESISTANT<br />
CAST STEEL<br />
MA GORZATA GARBIAK<br />
and RENATA CHYLI SKA<br />
Szczecin University of Technology, 70-310 Szczecin,<br />
Al. Piastów 17, Poland<br />
malgorzata.garbiak@ps.pl<br />
Keywords: microhardness, austenitic cast steel, precipitates<br />
1. Introduction<br />
The performance life of parts of machines and equipment<br />
operating at high temperatures depends to a great extent<br />
on the structural stability of material. The creep-resistant Ni-<br />
Cr cast steels used for operation at high temperatures are enriched<br />
with additions of niobium and titanium to improve<br />
their creep resistant behaviour. Compared with conventional<br />
cast steel, the phase composition of the stabilised cast steel is<br />
much more complex. The change of structure consists in partial<br />
or complete replacing of complex chromium carbides of<br />
the M7C3 or M23C6 type with the simple MC type carbides. At<br />
an operating temperature and in the presence of silicon, the<br />
content of which is higher in cast steel than in steel (for reasons<br />
of both technical and useful nature), the MC carbides are<br />
losing their stability and undergo phase transformations which<br />
result in the formation of a high-silicon Ni16(Nb,Ti)6Si7 phase,<br />
commonly called G phase. Liberated during this transformation,<br />
carbon and chromium, whose concentration in the matrix<br />
impoverished in nickel is growing, too, get combined to form<br />
on the phase boundaries chromium carbides of the M23C6<br />
type 1,2 . As a result of this effect, after certain time of annealing,<br />
complex precipitates composed of several phases start<br />
appearing in the alloy structure. Each of these phases has its<br />
own hardness, which makes their differentiation by the use of<br />
a microhardness tester possible.<br />
An attempt to differentiate the individual phase constituents<br />
was made, among others, in study 3 . Yet, because of<br />
a large scatter in the obtained results and small differences in<br />
the hardness values obtained for some phases (especially as<br />
regards M7C3 and M23C6 type carbides), the investigations did<br />
not give the expected positive results.<br />
The aim of the investigations undertaken in this study<br />
was to use microhardness measurements for the determination<br />
of phase constituents included in the composition of complex<br />
multi-phase precipitates present in the structure of stabilised<br />
austenitic cast steel after the annealing process.<br />
s187<br />
2. Experimental<br />
The choice of material and the method of taking measurements<br />
were dictated by the following objectives:<br />
To produce in alloy structure the precipitates of possibly<br />
large dimensions,<br />
To apply the load of a value such that would produce<br />
indentations only within a strictly determined and purposely<br />
chosen phase region.<br />
Material for investigations. Creep-resistant cast steel of the<br />
chemical composition given in Table I was melted in induction<br />
furnace and cast into sand moulds. Then, the specimens<br />
cut out from the test ingots were annealed in the atmosphere<br />
of air at a temperature of 900 °C for 300 hours. After this<br />
time, the structure contained precipitates of dimensions comprised<br />
in the range of 10 15 m, Fig. 1. The coarseness of<br />
the precipitates was also due to the appropriately high silicon<br />
content in alloy 4 .<br />
Table I<br />
Chemical composition of the cast steel, wt.%<br />
C Ni Cr Si Nb Ti Mn Cu<br />
0.30 29.30 17.80 4.26 1.59 1.07 1.02 0.21<br />
Content of other elements: P
Chem. Listy 105, s187 s190 (2011) LMV <strong>2008</strong> Regular Lectures<br />
a b<br />
3. Discussion of results<br />
An important consequence of transformations proceeding<br />
in the examined alloys due to the annealing process is the<br />
complex structure of the formed precipitates, which in their<br />
composition may include even four phase constituents.<br />
The sequence in which these precipitates are arranged is the<br />
following: the centre is TiCN carbide surrounded by a complex<br />
niobium-titanium carbide (Nb,Ti)C, next there is an envelope<br />
of the chemical composition corresponding to G<br />
phase, while the external layer is composed of the precipitates<br />
of chromium carbides of the M23C6 type, the presence of<br />
which is accompanying the MC G transformation, Fig. 3.<br />
Microhardness was measured in selected areas to which<br />
the individual phase compositions were ascribed, basing on<br />
the results of the metallographic examinations. The obtained<br />
distribution of the hardness values is consistent with the arrangement<br />
of phase constituents in a single precipitate,<br />
Figs. 2, 3 and 4. The highest hardness, considerably different<br />
than the hardness of the remaining carbides, has the TiCN<br />
carbide, located in the middle of a complex precipitate. The<br />
lowest hardness has the matrix. Very interesting in the obtained<br />
results is also the fact that the value of the standard<br />
deviation (Table II) is the highest (the largest scatter in re-<br />
10 m 10 m<br />
Fig. 1. a) Microstructure of the examined cast steel, b) indentations in precipitate areas and in the matrix<br />
Table II<br />
Results of the Student t test for measurement of microhardness on different phases, = 0.05<br />
Phase Average, HV Standard<br />
deviation<br />
TiCN 2853 636<br />
Number<br />
of groups, N<br />
s188<br />
Value<br />
test t<br />
df Probability, p<br />
(Nb,Ti)C 1427 275 10 8.612396 9 0.000012<br />
G phase 1127 303 10 4.092959 9 0.002705<br />
M23C6 774 202 10 2.580205 9 0.029687<br />
matrix 346 46 10 7.960378 9 0.000023<br />
sults) in the case of TiCN phase, and the lowest in the case of<br />
the matrix. This is due to both the size of an area occupied by<br />
these constituents on the metallographic specimen crosssection<br />
surface and to the hardness itself possessed by these<br />
phases.<br />
Intensity (counts)<br />
2000<br />
1000<br />
0<br />
40 45 50 55 60 65<br />
2Theta (°)<br />
Fig. 2. Phase compositions of precipitates; (Nb,Ti)C, G phase,<br />
Cr23C6, TiCN
Chem. Listy 105, s187 s190 (2011) LMV <strong>2008</strong> Regular Lectures<br />
a<br />
b<br />
c<br />
5 m<br />
Si N<br />
T<br />
C<br />
wt.% Si Cr Nb Ni Ti Fe Mn<br />
1 0.31 1.13 34.55 0.80 62.13 1.20 0.12<br />
2 0.41 1.45 56.58 1.81 38.08 1.57 0.10<br />
3 11.97 2.45 16.47 53.35 8.72 6.88 0.16<br />
4 3.70 18.88 0.18 28.43 0.53 47.51 0.78<br />
Fig. 3. a) Microstructure, b) distribution of elements, c) punctual<br />
chemical analysis of precipitates<br />
SEI (TiNb)C<br />
G<br />
BEI<br />
2 point 3 point<br />
N<br />
Fe<br />
s189<br />
TiCN<br />
1 point<br />
Of some importance is also the application of small load<br />
during the measurements. With increasing load, the error of<br />
the measurements of the indentation diameter decreases.<br />
Probably, larger number of the measurements would render<br />
the same effect, giving smaller standard deviation.<br />
In spite of a large scatter in the results, especially as<br />
regards the TiCN phase, and relatively small differences in<br />
hardness between the G phase and (NbTi)C carbides, the<br />
value of the probability p (the occurrence of test statistics t) is<br />
lower than the accepted level of significance = 0.05, which<br />
indicates that in all the cases of comparable mean hardness<br />
values, the difference between them is still significant enough<br />
to enable them to be regarded as the values of the hardness of<br />
the individual phase constituents, Fig. 5.<br />
4. Conclusions<br />
Cr23C6<br />
4 point<br />
Fig. 4. Distribution of microhardness in phase constituents of the<br />
examined cast steel<br />
The performed investigations have proved that it is possible<br />
to differentiate between the individual phase constituents<br />
present in microstructure of the annealed cast steel. The application<br />
of statistical analysis enables determining, even when<br />
the scatter in results is relatively large, the mean hardness of
Chem. Listy 105, s187 s190 (2011) LMV <strong>2008</strong> Regular Lectures<br />
HV<br />
TiC vs (Nb,Ti)C (Nb,Ti)C vs G phase G phase vs M23C6 3400<br />
1700<br />
1400<br />
3000<br />
2600<br />
2200<br />
1800<br />
1400<br />
1000<br />
each of the phases, providing that these are not the similar<br />
values.<br />
So, it is possible to describe the microstructure quantitatively<br />
by random measurements of microhardness taken on<br />
the metallographic specimen cross-section and their presentation<br />
in the form of a distribution of the microhardness values,<br />
where the individual phase constitutents can be isolated and<br />
their quantitative content can be determined all from the<br />
obtained hardness values.<br />
The condition is, however, properly chosen value of the<br />
load, which enables eliminating the measurements giving<br />
averaged hardness values for two or more phases.<br />
REFERENCES<br />
1500<br />
1300<br />
1100<br />
900 600<br />
TiC (Nb,Ti)C (Nb,Ti)C G phase G phase M23C6 HV<br />
TiC vs matrix<br />
1000<br />
800<br />
600<br />
400<br />
200<br />
TiC matrix<br />
1. Powell D. J., Pilkington R., Miller D. A.: Acta Metall.<br />
713, 36 (1988).<br />
2. Almeida L. H., Ribeiro A. F., Le May I.: Mat.Char. 219,<br />
49 (2003).<br />
3. Aydin I., Bühler H.-E., Rahmel A.: Arch.<br />
Eisenhüttenwes. 421, 310 (1983).<br />
s190<br />
1200<br />
1000<br />
800<br />
Average<br />
Fig. 5. Comparison of average microhardness between phase constituents of the examined cast steel<br />
Standard deviation<br />
Standard deviation * 1.96<br />
4. Garbiak M., Piekarski B.: In . Mater. 704, 3 (2006).<br />
5. Chyli ska R., Garbiak M., Piekarski B.: Mat. Sc. 348, 4<br />
(2005).<br />
M. Garbiak and R. Chyli ska (Szczecin University of<br />
Technology, Szczecin, Poland) Microhardness of Phase<br />
Constituents Present in Creep-Resistant Cast Steel<br />
The study presents the results of microhardness measurements<br />
of the phase constituents present in creep-resistant cast<br />
steel. The measurements were taken by the Vickers method,<br />
and their main aim was to make a distinction between individual<br />
phases included in the composition of complex precipitates<br />
formed as a result of ageing the 0.3C-30Ni-18Cr creepresistant<br />
cast steel. The statistical analysis of the results of<br />
microhardness measurements has indicated that the averaged<br />
values of HV obtained for individual phases are characterised<br />
by very significant differences at the adopted level of confidence<br />
= 0.05. Hence they can be treated as separate values<br />
and as such can be ascribed to the individual phase constituent.
Chem. Listy 105, s191 s194 (2011) LMV <strong>2008</strong> Regular Lectures<br />
THERMAL SHOCK RESISTANCE OF SiC+Si3N4 COMPOSITES EVALUATED<br />
BY INDENTATION TECHNIQUE<br />
ALEXANDRA KOVAL ÍKOVÁ<br />
and JÁN DUSZA<br />
Institute of Materials Research, Slovak Academy of Sciences,<br />
Watsonova 47, 040 01 Ko ice, Slovak Republic<br />
avysocka@imr.saske.sk, jdusza@imr.saske.sk<br />
Keywords: SiC, SiC+Si3N4 composites, mechanical properties,<br />
thermal shock resistance<br />
1. Introduction<br />
Silicon carbide and silicon nitride have been recognised<br />
as important structural ceramics because of their good combination<br />
of mechanical and thermal properties 1 . Components to<br />
be properly applied in high temperature need to have a high<br />
resistance to thermal shock, thermal fatigue, corrosion, and<br />
resistance to creep deformation. Si-based ceramics such as<br />
silicon carbide and silicon nitride due to their covalent bonding<br />
exhibit a high strength at elevated temperature (up to<br />
1000 °C), as well as low thermal expansion coefficient and<br />
high thermal conductivity, and therefore a high resistance to<br />
thermal shock 2 4 . A new approach that has received much less<br />
attention is the incorporation of Si3N4 in SiC with oxide additives.<br />
SiC has higher hardness and oxidation resistance,<br />
whereas Si3N4 has better strength and thermal shock behaviour.<br />
Kim et al. 5 investigated microstructure and mechanical<br />
properties of SiC composites that contained up to 50 wt.% of<br />
Si3N4 particles. The fracture toughness increased as the Si3N4<br />
content increased and the effect of Si3N4 addition on toughening<br />
became apparent as Si3N4 contents of 30 wt.%. The<br />
strength increased with Si3N4 content and showed a maximum<br />
of 1020 MPa at 35 wt.% of silicon nitride. Shaoming 6 reported<br />
maximum strength and toughness values of 810 MPa<br />
and 5, 5 MPa m 1/2 in specimens with different additive compositions<br />
of La2O3 and Y2O3. However, the thermal shock<br />
resistance of SiC+Si3N4 composites has not yet been reported.<br />
Takeda and Maeda 7 showed that the thermal shock resistance<br />
of hot pressed SiC sintered with BeO and AlN depends on the<br />
thermal conductivity. At 100 W m 1 K 1 was Tc = 680 °C<br />
and at 65 W m 1 K 1 was Tc = 450 °C. Wang and Singh 8<br />
measured Tc = 500 °C at thermal conductivity of 87 W m 1 K 1<br />
of HP SiC. Pettersson et al. 9 studied the best parameters for<br />
measuring the thermal shock resistance of Si 3N4 based materials<br />
with an indentation-quench method. Many other authors<br />
have studied thermal shock resistance of different ceramic<br />
materials by water quenching or indentation tests 10 14 .<br />
Most ceramic materials are sensitive to thermal shock<br />
and thermal fatigue. Due to inhomogenous temperature distributions<br />
in rapidly cooled or heated ceramic components, high<br />
thermal stresses are generated, which are responsible for the<br />
extension of existing cracks. The calculation of thermal<br />
s191<br />
stresses is an important step necessary for design with ceramic<br />
materials. Thermal stresses depend on physical properties<br />
(thermal expansion coefficient elastic constants E and<br />
thermal conductivity specific heat Cp, density geometric<br />
boundary conditions, and thermal boundary conditions.<br />
Failure occurs when the maximum thermal stress reaches<br />
a critical value c (strength) or, in terms of fracture mechanics,<br />
when the stress intensity factor KI reaches the fracture<br />
toughness KIC. The thermal shock sensitivity of a material<br />
consequently depends on the physical properties and on c<br />
and KIC. Depending on the special boundary conditions, different<br />
shock parameters were defined 15 . In addition to these<br />
material properties, which can be tabulated, the microstructure<br />
character is also of importance and influences the thermal<br />
shock behaviour of the material 9 . The investigation of the<br />
behaviour of Vickers indentation cracks under quenching<br />
condition has raised interest during the last years. An indentation-quench<br />
method has been developed by Andersson and<br />
Rowcliffe 16 . Compared to the Hasselman quench-strength<br />
method 17 , the evaluation procedure is simple, the sample<br />
preparation is easy and only a small number of samples are<br />
needed for a series of measurements at different temperatures.<br />
The indentation-quench method can be used for the characterization<br />
of materials and as a diagnostic tool to predict the<br />
thermal shock damage occurrence in a component 18 . To<br />
evaluate the thermal stress crack initiation and propagation<br />
behaviour of ceramics, two thermal shock resistance parameters<br />
are usually used 19 . First is the resistance to initiation of<br />
crack, expressed by parameter R<br />
1<br />
f<br />
R Tc<br />
E<br />
where f is the fracture strength, E is the Young s modulus,<br />
is the coefficient of thermal expansion and is the Poisson s<br />
ratio.<br />
Higher R represents a greater resistance to the initiation<br />
of fracture during rapid quenching and during steady-state<br />
heat flow down a steep temperature gradient. The second is<br />
the resistance to propagation of crack expressed by the parameter<br />
R´´´´<br />
K<br />
IC R´´´´ (1 )<br />
f<br />
2<br />
which dedicates the resistance to catastrophic crack propagation<br />
of ceramics under a critical temperature difference, Tc.<br />
From the above two equations, it is clearly visible that<br />
the thermal shock resistance can be improved by the increased<br />
flexural strength and fracture toughness and by decreased<br />
Young s modulus and coefficient of thermal expansion.<br />
The main aim of this work is to study thermal shock<br />
behaviour of SiC+Si3N4 composites using indentation method<br />
and to compare to the behaviour of the reference silicon carbide,<br />
prepared by the same fabrication route.
Chem. Listy 105, s191 s194 (2011) LMV <strong>2008</strong> Regular Lectures<br />
2. Experimental procedures<br />
Material preparation<br />
SiC materials were prepared by mixing -SiC powder (HSC-<br />
059, Superior Graphite) with sintering additives Al2O3 (A 16<br />
SG, Alcoa) and Y2O3 (grade C, H.C. Starck). In the case of<br />
composites -SiC powder was mixed with Si3N4 powder<br />
(AlY-3/54, Grade C, Plasma & Ceramic Technologies Ltd.),<br />
which contained Y2O3 and Al2O3 sintering additives in weight<br />
ratio 6:3. The final chemical compositions of the investigated<br />
materials are listed in Table I. The powder mixtures were ball<br />
milled in isopropanol with SiC balls for 24 hours. The suspensions<br />
were dried and subsequently sieved through 25 m<br />
sieve screen in order to avoid hard agglomerates. The samples<br />
were sintered by hot pressing at 1850 °C /1h under mechanical<br />
pressure of 30 MPa in N2 atmosphere. The hot pressed<br />
samples were subsequently heat treated at 1850 °C/5 h.<br />
Microstructure and mechanical properties<br />
For microstructural observation the specimens were cut,<br />
polished to a 1 m finish and plasma etched. The microstructures<br />
were studied using an SEM (JEOL JSM-7000F). The<br />
densities of the sintered and annealed specimens were measured<br />
according to Archimedes´ principle. Hardness was determined<br />
by Vickers indentation (hardness testers LECO<br />
700AT) under a load of 49.05 N with a dwell time of 10 s. In<br />
order to determine the indentation toughness at least 15 Vickers<br />
indentations per specimen were introduced with the load<br />
of 49.05 N. The indentation toughness was calculated from<br />
the lengths of radial cracks and indents diagonals using<br />
a formula valid for semi-circular crack systems as proposed<br />
by Anstis et al. 20 . The strength was measured using specimens<br />
with dimensions 3 4 45 mm, tested in the four point bending<br />
mode. They were ground by 15 m diamond grinding wheel<br />
before testing. The two edges on the tensile surface were<br />
rounded with a radius about 0.15 mm in order to eliminate<br />
a failure initiated from an edge of the specimen. At least ten<br />
specimens were tested for each material.<br />
Indentation thermal shock resistance<br />
For the investigation of thermal shock resistance the<br />
indentation-quench method was used. The indentations were<br />
made, using the load 49.05 N to obtain pre-cracks approxi-<br />
Table I<br />
Chemical composition of prepared materials<br />
s192<br />
mately in the same length. Four indents were made in each<br />
specimen with dimensions 3 4 20 mm. The lengths of the<br />
cracks were measured with the same equipment as in the<br />
hardness and fracture toughness test. After the indentation the<br />
samples were heated in a vertical tube furnace in air to the<br />
required temperature and held there for 25 min. Then the<br />
specimens were rapidly immersed into a ~20 °C water bath.<br />
Final radial crack lengths were again measured. The procedure<br />
was repeated at increasing quenching temperatures T,<br />
up to the critical value of Tc at which radial crack became<br />
unstable and the specimen failed.<br />
Fig. 1. SEM micrographs of (a) hot pressed SC-N5-HP and (b)<br />
annealed SC-N5-1850 composites<br />
Samples Heat treatment Composition [wt. %]<br />
SIC SI3N4 Y2O3 AL2O3<br />
SC-N0-HP HP (1850°C/1h) 91.0 0 6.0 3.0<br />
SC-N5-HP HP (1850°C/1h) 86.5 5 5.7 2.8<br />
SC-N10-HP HP (1850°C/1h) 81.9 10 5.4 2.7<br />
SC-N0-AN HP (1850°C/1h) +AN (1850°C/5h) 91.0 0 6.0 3.0<br />
SC-N5-AN HP (1850°C/1h) +AN (1850°C/5h) 86.5 5 5.7 2.8<br />
SC-N10-AN HP (1850°C/1h) +AN (1850°C/5h) 81.9 10 5.4 2.7<br />
a<br />
b
Chem. Listy 105, s191 s194 (2011) LMV <strong>2008</strong> Regular Lectures<br />
3. Results and Discussion<br />
Microstructure and mechanical properties<br />
Representative SEM micrographs of a polished and<br />
plasma etched surface of the hot pressed and annealed<br />
SiC+Si3N4 composites are shown in Fig. 1. The microstructures<br />
of hot pressed SC-N5-HP (Fig. 1a) consist of fine submicron-sized<br />
equiaxed SiC grains with a low aspect ratio<br />
(~1). The microstructures of the SiC material and SiC+Si3N4<br />
composites significantly changed after their post-sintering<br />
high temperature treatment at 1850 °C, Fig. 1b. They have a<br />
bimodal distribution and consist of elongated SiC grains with<br />
higher aspect ratio (4.4) and of smaller SiC grains. In the case<br />
of SiC+Si3N4 composites the addition of silicon nitride resulted<br />
in a finer microstructure of investigated materials.<br />
The basic properties of the materials are summarized in the<br />
Table II. All materials are almost full dense (more than 97 %<br />
theoretical density). By increasing of Si3N4 content the density<br />
increased. In our case the addition of Si3N4 does not play<br />
a role in hardness and fracture toughness values. The effect of<br />
Si3N4 addition on fracture toughness became apparent at Si3N4<br />
content of 30 wt.% (ref. 5 ). The mechanical properties are<br />
strongly affected to their microstructural character. For finegrained<br />
globular microstructure of hot pressed SiC and<br />
SiC+Si3N4 composites the fracture toughness had a value of<br />
KIC between 2.8 2.9 MPa m 1/2 . For annealed materials with<br />
plate-like microstructure higher fracture toughness was obtained<br />
(4.3 5.4 MPa m 1/2 ). Sciti 21 showed the increase of KIC<br />
from 3 up to 5.5 MPa m 1/2 after annealing treatment at 1900 °<br />
C. In materials with fine microstructure and globular grains,<br />
the crack propagates mainly intergranularly with relatively<br />
small deflection from the main crack direction. Toughening<br />
mechanisms are absent in such microstructures. The crack<br />
propagation in the materials with coarse plate-like grains and<br />
microstructure is significantly different. The crack deflection<br />
is enhanced (often up to approximately 10 m from the main<br />
crack direction). The toughening mechanisms in the form of<br />
crack branching and crack deflection have been observed 22 .<br />
Such toughening mechanisms are probably responsible for the<br />
increase of fracture toughness. The flexural strength decreases<br />
with annealing and aspect ratio of SiC grains but slightly increases<br />
with Si3N4 addition. Kim 5 estimated a maximum<br />
strength value of 1020 MPa at a Si3N4 content of 35 wt.%.<br />
Table II<br />
Selected properties of SiC and SiC+Si3N4 composites<br />
Samples Density<br />
[g cm 3 ]<br />
Hardness<br />
HV5 [GPa]<br />
Fracture<br />
toughness<br />
KIC [MPa m 1/2 ]<br />
s193<br />
Fig. 2. Crack growth behaviour in the prepared materials<br />
after single quenches into water<br />
Fig. 3. Optical micrograph of 50 N contact impressions of (a) hot<br />
pressed SC-N10-HP and (b) annealed SC-N10-1850 composites<br />
Fracture<br />
Strength [MPa]<br />
RTHEORETIC<br />
[°C]<br />
REXPERIMENTAL<br />
[°C]<br />
SC-N0-HP 3.220 20.4 ± 0.9 2.90 ± 0.2 359.2 228 320<br />
SC-N5-HP 3.236 19.7 ± 0.6 2.88 ± 0.2 464.7 333 350<br />
SC-N10-HP 3.249 20.6 ± 0.7 2.89 ± 0.1 541.9 359 500<br />
SC-N0-AN 3.189 20.6 ± 0.3 4.54 ± 0.4 122.6 90 650<br />
SC-N5-AN 3.196 22.5 ± 0.8 5.39 ± 0.3 352.3 206 850<br />
SC-N10-AN 3.204 20.7 ± 1.1 4.38 ± 0.4 193.9 136 760<br />
a<br />
b
Chem. Listy 105, s191 s194 (2011) LMV <strong>2008</strong> Regular Lectures<br />
Further addition of Si3N4 up to 50 wt.%, decreased the<br />
strength to 855 MPa. To the 10 wt.% of silicon nitride were<br />
values of strength less than 700 MPa. In our case the values of<br />
flexural strength are significantly lower.<br />
Indentation thermal shock resistance<br />
For all tested specimens the rise in thermal shock resistance<br />
with a higher amount of silicon nitride was observed (Fig. 2).<br />
This means that the composite SiC+Si3N4 have better thermal<br />
shock resistance than the monolithic silicon carbide. The initiation<br />
crack length of annealed materials was 20 m shorter<br />
than to the hot pressed specimens (Fig. 3). Thermal shock<br />
tests, studied by indentation-quench method show enhanced<br />
resistance of the SiC+Si3N4 composite and the monolithic SiC<br />
material with coarse microstructure, with higher fracture<br />
toughness. The explanation of this fact could bee described by<br />
the Rth parameter. 23 This parameter reflects the fact that, to<br />
resist a given thermal shock, a material has to exhibit a high<br />
resistance to cracking, i.e. a high toughness, and has to have<br />
a low thermal stress. Therefore, it is important to design materials<br />
with specific microstructures to obtain an optimal state<br />
between resistance to initiation (R) and resistance to propagation<br />
of crack (R´´´´). Kalantar and Fantozzi 2 showed that materials<br />
with elongated grains (with higher aspect ratio) had<br />
higher Tc. The materials with elongated grains show several<br />
mechanisms of toughening, and so they may have stable crack<br />
propagation. If the experimental measured Tc values are<br />
compared with the calculated R parameter (Table II), in most<br />
cases the level of theoretic values is less than measured values<br />
and a linear relation exists between them 2 . In our case, the Tc<br />
values are lower for all tested specimens, but the largest difference<br />
is between theoretical R parameter and experimental<br />
estimated Tc of annealed monolithic SiC and SiC+Si3N4<br />
composites. These materials have lower flexural strength<br />
values compared with fine-grained materials because the biggest<br />
and more strength degrading flaws were found mainly in<br />
form of pores and agglomerates on SiC grains.<br />
4. Conclusions<br />
The Si3N4 addition has no influence on the hardness and<br />
fracture toughness but the heat treatment at 1850 °C results in<br />
the coarsening of the microstructure which leads to the increase<br />
of the indentation toughness. This increase is connected<br />
with the present toughening mechanisms in the form of<br />
crack deflection and crack branching. The flexural strength<br />
decreased for annealed materials with increased aspect ratio<br />
of their SiC grains, but slightly increased with Si3N4 addition.<br />
It was found that both the silicon nitride addition and the<br />
heat treatment have a positive effect on the improvement of<br />
the thermal shock resistance of the investigated composites.<br />
However, more experiments are necessary to understand and<br />
explain the effect of the silicon nitride addition on the improvement<br />
of the thermal shock resistance.<br />
This work was partly supported by the National Slovak Grant<br />
Agency VEGA, project No. 2/7194/27, APVV-0171-06, LPP-<br />
0203-07, and NANOSMART, Centre of Excellence, SAS.<br />
s194<br />
REFERENCES<br />
1. Falk L. K. L. : J. Eur. Ceram. Soc. 17, 983 (1997).<br />
2. Kalantar M., Fantozzi G. : Mat. Sci. Eng., A 472, 237<br />
(<strong>2008</strong>).<br />
3. Hoffmann M. J., Schneider G. A., Petzow G., in: The<br />
Potential of Si3N4 for Shock Applications (Schneider,<br />
Petzow, ed.), 49. Kluwer Academic, Boston 1993.<br />
4. Becher F.: J. Am. Ceram. Soc. 74, 255 (1991).<br />
5. Kim Y.-W., Lee Y.-I., Mitomo M., Choi H.-J., Lee J.-G.:<br />
J. Am. Ceram. Soc. 82, 1058 (1999).<br />
6. Shaoming D., Dongliang J., Shouhong T., Jingkun G.:<br />
Ceram. Int. 21, 451 (1995).<br />
7. Takeda Y., Maeda K.: J. Ceram. Soc., Jpn, Intl. 99, 1113<br />
(1991).<br />
8. Wang H., Singh R. N.: Intl. Mater. Rev. 39, 228 (1994).<br />
9. Pettersson P., Johnsson P., Shen Z.: J. Europ. Ceram.<br />
Soc. 22, 1883 (2002).<br />
10. Maensiri S., Roberts S. G.: J. Am. Ceram. Soc. 85, 1971<br />
(2002).<br />
11. Hvizdo P., Jonsson D., Anglada M., Anné G., Van Der<br />
Biest O.: J. Europ. Ceram. Soc. 27, 1365 (<strong>2007</strong>).<br />
12. Rui-Xia S., Yan-Sheng Y., Jia L., Dong-Zhi W.: Mat.<br />
Res. Bull., <strong>2008</strong>, doi: 10,1016/<br />
j,mater.resbull.<strong>2007</strong>.11.001.<br />
13. Yang Z.-H., Jia D.-Ch., Zhou Y., Meng Q.-Ch., Shi P.-<br />
Y., Song Ch.-B.: Mater. Chem. Phys. 107, 476 (<strong>2008</strong>).<br />
14. Ding S., Zeng Y.-P., Jiang, D.: Mat. Sci. Eng., A 425,<br />
326 (2006).<br />
15. Munz D., Fett T.: In Springer series in Materials Science,<br />
Hull R., Osgood R. M., Sakaki H., Zunger A. (ed.), Ceramics,<br />
229, Springer-Verlag, Berlin 1999.<br />
16. Andersson T., Rowcliffe D. J.: J. Am. Ceram. Soc. 79,<br />
1509 (1996).<br />
17. Hasselman D. P. H.: J. Am. Ceram. Soc. 52, 600 (1969).<br />
18. Collin M., Rowcliffe D.: Acta Mater. 48, 1655 (2000).<br />
19. Hasselman D. P. H.: Am. Ceram. Soc. Bull. 49, 1033<br />
(1970).<br />
20. Anstis G. R., Chantikul P., Lawn B. R., Marshall D. B.:<br />
J. Am. Ceram. Soc. 64, 533 (1981).<br />
21. Sciti D., Guicciardi S., Bellosi A.: J. Europ. Ceram. Soc.<br />
21, 621 (2001).<br />
22. Vysocká A., paková J., Dusza J., Balog M., ajgalík P.:<br />
Kovové Materiály 45, 223 (<strong>2007</strong>).<br />
23. Tancret F.: J. Europ. Ceram. Soc. 26, 1517 (2006).<br />
A. Koval íková and J. Dusza (Institute of Materials<br />
Research, Slovak Academy of Sciences, Ko ice, Slovak Republic):<br />
Thermal Shock Resistance of SiC+Si3N4 Composites<br />
Evaluated by Indentation Technique<br />
The thermal shock resistance of SiC+Si3N4 composites<br />
was investigated by indentation technique. The results were<br />
compared with thermal shock behaviour of SiC prepared by<br />
the same technological route. It was found that the silicon<br />
nitride addition has a positive effect in the improvement of the<br />
thermal shock resistance of the investigated composites.
Chem. Listy 105, s195 s197 (2011) LMV <strong>2008</strong> Regular Lectures<br />
HOLOGRAFICKÁ METÓDA UR ENIA YOUNGOVHO MODULU PRU NOSTI<br />
JOZEF KRAJ OVI<br />
a IGOR JAN U KA<br />
Materiálovotechnologická fakulta STU, Ústav materiálov,<br />
J. Bottu 25, 91724 Trnava, Slovensko<br />
jozef_krajcovic@stuba.sk, igor.jancuska@stuba.sk<br />
K ú ové slová: optické metódy, deformácia, holografická<br />
interferometria, regresná analýza, Youngov modul pru -<br />
nosti<br />
1. Deformácia ohybom<br />
Mechanické vlastnosti materiálu sa asto zis ujú de -<br />
truk nou (trhacou) skú kou v jednoosovom ahu. Trhací stroj<br />
plynulo zvy uje za a enie normalizovanej ty e<br />
a zaznamenáva závislos ahového napätia od pomerného<br />
pred enia . Pri skú ke mo no postupne nájs napätie<br />
U (medzu úmernosti), po ktoré je závislos lineárna, napätie<br />
E (medzu pru nosti), po ktoré je deformácia pru ná<br />
(elastická), napätie K (medzu klzu), pri ktorom za ína plastická<br />
deformácia a maximálne napätie P (medzu pevnosti) pri<br />
takej skú ke. Nás zaujíma prvá oblas , v ktorej je závislos<br />
ahového napätia od pomerného pred enia lineárna:<br />
E<br />
Vz ah (1) sa nazýva Hookov zákon a kon tanta E je Youngov<br />
modul pru nosti v ahu. V princípe mô eme Youngov modul<br />
pru nosti v ahu ur i aj z iných známych druhov namáhania<br />
telesa. Spomedzi základných druhov namáhania telies ( ah,<br />
myk, krut, ohyb a vzper) sme sa zamerali na ohyb votknutého<br />
nosníka pod vplyvom osamelej prie nej vonkaj ej sily F<br />
pôsobiacej vodorovne vo vzdialenosti l od upevneného konca<br />
nosníka, pozri obr. 1.<br />
Pri ve mi malých priehyboch nosníka (y´ 2
Chem. Listy 105, s195 s197 (2011) LMV <strong>2008</strong> Regular Lectures<br />
diel optických dráh interferujúcich vlnení. V prípade interferometrie<br />
neprieh adných objektov je ve kos fázového rozdielu<br />
medzi interferujúcimi vlnami ur ená vektorom deformácie<br />
r ve kosti y v ka dom mieste sledovaného povrchu,<br />
smerom osvetlenia ki skúmaného povrchu a smerom<br />
pozorovania ks interferogramu 2<br />
r<br />
( ks<br />
ki<br />
Symbolom k sú ozna ené vlnové vektory príslu ných<br />
svetelných v n. Ich absolútne hodnoty sú rovnaké, nako ko sú<br />
rovnaké vlnové d ky svetla. Oba vektory sa lí ia len smermi.<br />
V na om prípade bol dvojexpozi ný záznam na holografickú<br />
dosku vykonaný tak, e vektory kS a ki boli prakticky nesúhlasne<br />
orientované a vektor deformácie r bol nesúhlasne<br />
orientovaný s vektorom ki osvetlenia skúmaného povrchu<br />
nosníka so spodným upevneným koncom, preto<br />
a po dosadení (8) do (6) a úprave pre ohyb y v miestach interferen<br />
ných miním platí<br />
y<br />
kde rády m = 0, 1, 2, prira ujeme minimám na interferograme<br />
v smere od upevneného konca k pôsobisku sily. Ak by<br />
sa pôsobisko sily nachádzalo presne v minime rádu n, potom<br />
y*<br />
a po dosadení (10) do (5) získame<br />
E<br />
)<br />
r ( ks<br />
ki<br />
)<br />
y2k<br />
y4<br />
2m 1 , m 0,<br />
1,<br />
2,...<br />
4<br />
2n<br />
4Fl<br />
3J<br />
2n<br />
1<br />
4<br />
3<br />
1<br />
Ak by sa pôsobisko sily nachádzalo nad interferen ným minimom<br />
rádu n, je mo né odhadnú hodnotu rádu v pôsobisku<br />
sily reálnym íslom z otvoreného intervalu od n do n+1 a toto<br />
reálne íslo dosadzova do vz ahu (11) miesto n. Odhad<br />
mô e by zalo ený na meraní priebehu intenzity<br />
v interferograme. Rozlo enie intenzity je ur ené funkciou cos<br />
( ). Ve kos deforma nej sily F spôsobujúcej ohyb predmetu<br />
je potrebné voli tak, aby sa dal jednozna ne ur i po et<br />
tmavých interferen ných prú kov vznikajúcich pri rekontrukcii<br />
interferogramu (obr. 2).<br />
Druhý spôsob, ako mô eme ur i ohyb y* v pôsobisku<br />
sily spo íva vo vyu ití lineárnej regresie. Pomocou softvéru<br />
pre obrazové spracovanie mô eme mera vzdialenos xm<br />
medzi upevneným koncom a minimom rádu m s ohybom ym<br />
vypo ítaným pod a vz ahu (9). Takto získame N dvojíc súradníc<br />
(xm, ym) pre ur enie regresných koeficientov a a b<br />
v regresnej funkcii (3). Akonáhle sú regresné koeficienty<br />
ur ené, ohyb y* v mieste pôsobiska sily vypo ítame pod a<br />
vz ahu<br />
3 2<br />
y*<br />
al bl<br />
(7)<br />
(8)<br />
(9)<br />
(10)<br />
(11)<br />
(12)<br />
s196<br />
Obr. 2. Digitálna fotografia interferogramu<br />
a dosadíme do vz ahu (5) pre výpo et Youngovho modulu<br />
pru nosti. Regresná krivka poskytuje informáciu o ohybe<br />
v ubovo nom bode nosníka (obr. 3).<br />
2,0<br />
1,5<br />
1,0<br />
0,5<br />
y m<br />
0,0<br />
0 20000 40000 60000 x m<br />
Obr. 3. Regresná Obr. krivka 3. Regresná regresnej krivka regresnej funkcie (3)<br />
funkcie (3)<br />
3. Analýza experimentálnych výsledkov<br />
Uvedenými spôsobmi sme ur ovali Youngov modul<br />
pru nosti E eutektického kompozitu pripraveného riadenou<br />
kry talizáciou 3 . Vzorka mala obd nikový prierez. Hrúbku h<br />
a írku prierezu sme merali mikrometrom 8-krát v rôznych<br />
miestach pozd celej d ky vzorky. Prístrojovú chybu mikrometra<br />
(1 m) sme zanedbali kvôli pomerne ve kému rozptylu<br />
nameraných hodnôt. Stredné hodnoty boli h = 2937,5 m<br />
a = 2906,6 m, so strednými kvadratickými chybami<br />
h = 20,7 m a = 14,0 m. Vlnová d ka monochromatického<br />
laserového iarenia bola = 632,8 nm. Výrobca lasera<br />
udáva chybu v ur ení vlnovej d ky = 1 nm. Silu pôsobiacu<br />
na nosník sme nastavovali v rozpätí od 30 mN do 80 mN<br />
a merali silomerom s chybou F = 5 mN. Vzdialenos l pôsobiska<br />
sily od upevneného konca sme merali posuvným meradlom<br />
s chybou l = 0,1 mm. Kvôli obmedzenej d ke vzorky<br />
sme vzdialenos l nastavovali na hodnoty 6 cm a 7 cm. Vzorku<br />
sme merali v dvoch pozíciách. V prvej pozícii sila pôsobila
Chem. Listy 105, s195 s197 (2011) LMV <strong>2008</strong> Regular Lectures<br />
pozd ne s hrúbkou, preto bol plo ný moment zotrva nosti<br />
prierezu rovný J = h 3 /12. V druhej pozícii sila pôsobila pozd<br />
ne so írkou, preto bol plo ný moment zotrva nosti rovný<br />
J = h 3 /12. Po dosadení momentov do vz ahu (5) získame<br />
v adekvátnom poradí pre prvú a druhú pozíciu vz ahy<br />
E<br />
3<br />
4Fl<br />
,<br />
3<br />
h y *<br />
E<br />
3<br />
4Fl<br />
3<br />
h y *<br />
(13, 14)<br />
Pri vyu ití lineárnej regresie relatívne chyby E/E<br />
v adekvátnom poradí pre obe pozície odvodíme z vety<br />
o prenose chýb<br />
E<br />
E<br />
E<br />
E<br />
F<br />
F<br />
F<br />
F<br />
2<br />
2<br />
3 l<br />
l<br />
3 l<br />
l<br />
2<br />
2<br />
pri om nevychýleným odhadom pre strednú kvadratickú chybu<br />
y* je tatistika<br />
y*<br />
N<br />
yi<br />
i 1<br />
y xi<br />
2<br />
N m<br />
kde N je po et dvojíc súradníc (xi , yi) vyu itých na nájdenie<br />
regresných koeficientov a a b, y(xi) sú funk né hodnoty regresnej<br />
funkcie (3) v bodoch so súradnicami xi a m = 2 je<br />
po et regresných koeficientov.<br />
Pri vyu ití odhadu rádu minima v mieste pôsobiska sily<br />
dosadíme plo né momenty prierezu pre prvú a druhú pozíciu<br />
vzorky v adekvátnom poradí do vz ahu (11) a získame<br />
16Fl<br />
E ,<br />
3<br />
h 2n<br />
1<br />
a s vyu itím vety o prenose chýb získame v adekvátnom poradí<br />
vz ahy pre relatívne chyby E/E merania<br />
E<br />
E<br />
E<br />
E<br />
3<br />
E<br />
h<br />
Rád interferen ného minima v pôsobisku sily sme odhadovali<br />
s chybou n = 0,5. Vzorku sme merali 7-krát v prvej<br />
pozícii a 5-krát v druhej pozícii, tak e sme mali k dispozícii<br />
12 interferogramov. Z i-teho interferogramu sme modul pru -<br />
nosti Ei a chybu v jeho ur ení Ei vypo ítali dvomi spôsobmi.<br />
Výsledný odhad E modulu pru nosti a chybu odhadu E pre<br />
daný spôsob sme stanovili pod a vz ahov<br />
E<br />
F<br />
F<br />
F<br />
F<br />
2<br />
2<br />
3 l<br />
l<br />
3 l<br />
l<br />
1 12<br />
Ei<br />
,<br />
12 i 1<br />
2<br />
2<br />
3<br />
E<br />
2<br />
2<br />
1<br />
12<br />
3<br />
16Fl<br />
3<br />
2n<br />
3 h<br />
2<br />
h<br />
h<br />
h<br />
2<br />
3<br />
12<br />
2<br />
Ei<br />
i 1<br />
2<br />
1<br />
2<br />
n<br />
n<br />
n<br />
n<br />
2<br />
2<br />
3 h<br />
h<br />
h<br />
h<br />
2<br />
2<br />
2<br />
2<br />
y*<br />
y*<br />
y *<br />
y *<br />
2<br />
2<br />
(15)<br />
(16, 17)<br />
(18)<br />
(19)<br />
(20, 21)<br />
s197<br />
Tabu ka I<br />
Odhady a chyby odhadov Youngovho modulu pru nosti eutektického<br />
kompozitu<br />
Pod a odhadu rádu minima<br />
E [GPa]<br />
Pod a lineárnej regresie<br />
E [GPa]<br />
198,5 ± 8,1 204,8 ± 7,9<br />
Výsledky sú uvedené v tabu ke I. Chyby merania pri<br />
oboch spôsoboch ur enia Youngovho modulu pru nosti sú<br />
porovnate né. Prvou výhodou lineárnej regresie je v ak to, e<br />
umo uje ur i modul pru nosti aj v prípade, e sa tmavé<br />
interferen né prú ky v hornej asti interferogramu vplyvom<br />
ich ve kej hustoty zlievajú do tmavého priestoru a nie je mo -<br />
né urobi odhad rádu minima v mieste pôsobiska sily, resp.<br />
nie je mo né ur i po et interferen ných miním od upevneného<br />
konca po pôsobisko sily. Druhou výhodou lineárnej regresie<br />
je to, e regresná krivka poskytuje informáciu o ohybe<br />
vzorky v ka dom bode pozd vzorky. Metóda dvojexpozi nej<br />
interferometrie je pomerne citlivá a je vhodné ju pou i na<br />
skúmanie predmetov pravidelných tvarov vyrobených<br />
z kovových aj keramických materiálov 4 . Interferogramy, na<br />
ktorých boli zjavné nedokonalosti upnutia spodného konca<br />
vzorky, sme z merania vylú ili. Metódu je mo né vyu i aj<br />
vtedy, ak má skúmaná vzorka komplikovaný tvar. V takomto<br />
prípade je mo né metódu doplni o numerické modelovanie<br />
a pomocou programu ANSYS ur i Youngov modul pru nosti<br />
a Poissonovo íslo daného materiálu.<br />
Prácu na tomto príspevku podporila Vedecká grantová agentúra<br />
projektom . 1/0173/08.<br />
LITERATÚRA<br />
1. Puchner O. a kol.: Pru nos a pevnos I. Edi né stredisko<br />
SV T, Bratislava 1987.<br />
2. Vest Ch. M.: Holographic Interferometry. J. Wiley &<br />
Sons, New York 1979 (in Russian: Mir, Moskva 1982).<br />
3. i ka R., Trnovcová V., Starostin M. J., Laba V., Minárik<br />
S., Kubliha M., Bo ák O.: Directional solidification<br />
in system Al2O3-(Y2O3)ZrO2. Materials science and technology<br />
2 (2004).<br />
4. Bala J., Szabó V.: Holografická interferometria<br />
v experimentálnej mechanike. VEDA, Bratislava 1986.<br />
J. Kraj ovi and I. Jan u ka (Institute of Materials<br />
Science, Faculty of Materials Science and Technology in<br />
Trnava, Slovak University of Technology Bratislava, Slovakia):<br />
Holography Method of Young's Elasticity Modulus<br />
Determination<br />
The paper deals with the comparison of two approaches<br />
to the determination of the Young´s elasticity modulus. The<br />
first approach is based on the determination of number of the<br />
interference minima between the fixed end and the force action<br />
point. In the second approach the linear regression is<br />
used. Both the approaches are based on the application of the<br />
two-exposure holography interferometry. The investigated<br />
balk shape sample was made from the eutectic Al2O3 (Y2O3)<br />
ZrO2 composite. It was shown how the obtained regression<br />
curve describes the non-damage deformation of the parallelepiped<br />
girder with the fixed down end.
Chem. Listy 105, s198 s201 (2011) LMV <strong>2008</strong> Regular Lectures<br />
LOCALIZED VISCOUS FLOW IN THE OXIDE AND OXYNITRIDE GLASSES<br />
BY INDENTATION CREEP<br />
FRANTI EK LOFAJ<br />
Institute of Materials Research of SAS, Watsonova 47, 040 01<br />
Ko ice, Slovakia<br />
flofaj@imr.saske.sk<br />
Keywords: indentation creep, viscosity, oxynitride glass, rareearth<br />
additives<br />
1. Introduction<br />
Vickers, Brinell or Rockwell hardness tests are common<br />
methods for the investigation of the hardness, elastic, elastoplastic<br />
and plastic behavior, yield strength, etc., of wide range<br />
of materials from soft and ductile metals up to brittle and very<br />
hards ceramics and glasses 1 . These tests are simple and the<br />
information is obtained from very small volume of the material.<br />
Instrumented indentation developed over last two decades<br />
based on the model of Oliver and Pharr 2 resulted in the<br />
measurement of a range of properties and parameters, which<br />
are not available from conventional hardness. Besides reduced<br />
elastic modulus, elastic and plastic work and several others,<br />
indentation creep data became available. However, the indentation<br />
creep used in the instrumented indentation is related to<br />
the deformation under the sharp indenter over relatively short<br />
period of time of tens of secondes up to several minutes at<br />
room temperature. Highly localized and concentrated stresses<br />
in brittle materials result in the formation of indentation damage,<br />
which contributes to the plasticity data. The tests without<br />
damage contribution are desirable to obtain concise data on<br />
plasticity of the studied materials. Creep resistance, viscous<br />
flow as well as time dependence of hardness can be successfuly<br />
determined at high temperatures using a modified indentation<br />
creep, which is a combination of the compressive creep<br />
testing and instrumented indentation with blunt indenter 3 8 .<br />
The first tests of this type with hemishperical indenter were<br />
performed by Heynes and Rawson in the 60-s to measure the<br />
viscosity of glasses 3 . The theoretical interpretation of this<br />
measurement was worked out by Douglas 4 . The flat ended<br />
cylindrical punch was used Yu and Li in the 70-s for investigation<br />
of creep properties of single crystals and they have<br />
proved that its results are equivalent to those of the tensile<br />
creep test 5,6 . During this measurement, a cylinder with the<br />
diameter d is pressed with the force F into the flat surface of<br />
the sample (Fig. 1) at the test temperature, T, and the depth of<br />
the indentation, h(t) is recorded as the function of elapsed<br />
time, t. The result is a conventional creep curve with an initial<br />
transient stage followed by a stage with the constant impression<br />
velocity, v = dh/dt. It was shown on various metals,<br />
glasses and ceramics that the indentation tests provide the<br />
same information on viscosity as tensile tests 5 8 . Viscosity of<br />
the glasses, h, was found to follow the relationship:<br />
= d k1 p/3 k2 v<br />
s198<br />
Fig. 1. Schematic representation of the flat cylindrical punch<br />
indentation creep geometry<br />
where k1 and k2 are the geometrical coefficients and p is the<br />
pressure on the indentor. The values of k1 and k2 were determined<br />
experimentally and by FEM and they are in the range<br />
0.3 0.4 and 0.76 1.0, respectively 9 . Thus, viscosity measured<br />
by the indentor with the diameter d and pressure<br />
p = 4F/ d 2 , is<br />
= c. p/ v (1)<br />
where c = k1d/3 k2. For the FEM values k1 = 0.3 and k2 =<br />
0.76 9 , the value c = 0.13 d is a constant of the indentor. The<br />
activation energy, Q, is given by the formula<br />
= 0 exp (Q/kT), resp. ln v = ln p ln(c 0) Q/kT (2)<br />
where h0 is a constant and kT has its usual meaning.<br />
Oxynitride glasses present in the advanced structural<br />
ceramics at the grain boundaries, originate from sintering<br />
additives. Despite being as only 1 nm thin films, they control<br />
high temperature behavior of these ceramics and the increase<br />
of their viscosity is crucial for the improvement of creep resistance<br />
of the whole material. The measurement of the viscosity<br />
of such thin films is currently experimentally not possible but<br />
it can be measured on the model bulk oxynitride glasses 10 12 .<br />
Viscosities of such glasses were already measured by compressive<br />
tests and it was shown that both, rare-earth additives<br />
and nitrogen content have significant influence on viscosity<br />
and transition temperature of these glasses 10 12 .<br />
The aim of the current work is to investigate viscosities<br />
of the selected oxynitride glasses by indentation method, to<br />
compare the obtained results with those from other methods<br />
and to prove suitability of indentation method for viscosity<br />
measurement of the oxynitride glasses.<br />
2. Experimental part<br />
Glass preparation<br />
Four oxide and four oxynitride glasses were prepared<br />
from the mixture of powders of SiO2 (Aerosil OX 50, Degussa-Hüls<br />
AG, Germany), MgO (MgO 500 A, UBE Ind.
Chem. Listy 105, s198 s201 (2011) LMV <strong>2008</strong> Regular Lectures<br />
Ltd., Japan), -Si3N4 (SN-E10, UBE Ind. Ltd., Japan) and<br />
rare-earth oxides RE2O3 (RE = La, Sm, Yb, Lu). The ratio<br />
Mg: RE of 1:1 was constant and 20 e/o (equivalent %) for<br />
each element. The amount of silicon nitride powder was calculated<br />
in such a way that the resulting nitrogen contents were<br />
0 e/o in the oxide and 20 e/o in the oxynitride glasses. The<br />
powders were homogenized, dried, uniaxially pressed, cold<br />
isostatic pressed and finally sintered in gas pressure sintering<br />
furnace at 1700 °C under 2 MPa of nitrogen pressure for 0.5 h<br />
(ref. 11,12 ). The obtained pellets were cut on 3 mm thick slices<br />
ground and polished to obtain two parallel surfaces for the<br />
indentation tests.<br />
Indentation creep<br />
The tests were performed in the HTTF2 creep furnace in<br />
the temperature range 760 925 °C in air using SiC indenter<br />
with the diameter d = 2.1 mm under the stress p = 20 MPa.<br />
Experimental set-up is shown in Fig. 2. Penetration depth was<br />
measured as a difference between the data from two linear<br />
variable differential transducers (LVDT). They were out of<br />
the furnace attached to the loading punches via thin alumina<br />
rods to compensate errors due to thermal expansion. The tests<br />
run from < 1 min at the highest temperatures up to around<br />
20 hours at the lowest temperatures.<br />
3. Results<br />
furnace<br />
indenter<br />
sample<br />
LVDT<br />
Fig. 2. Schematic representation of the indentation creep test set-up<br />
Creep curves corresponding to the time dependence of<br />
the penetration depth of the indenter in the La-Si-Mg-O glass<br />
s199<br />
are compared in Fig. 3. Penetration rates in the studied temperature<br />
range 790 840 °C vary over three orders of magnitude.<br />
Similar differences were measured in the case of the<br />
corresponding oxynitride glasses, however, with a shift toward<br />
higher temperatures. As shown in Fig. 4, penetration<br />
rates of around 110 5 mm s 1 obtained in La-oxide glass at<br />
~ 805 °C occur at around 890 °C in Lu-Si-Mg-O-20 % N<br />
glasses.<br />
Penetration rates were transferred into viscosity using<br />
Eq. (1) with c = 0.273 mm. Fig. 5 shows temperature dependence<br />
of viscosity of the La-Si-Mg-O glass. Glass transition<br />
temperature, Tg, was determined as a temperature in the middle<br />
of the range when viscosity changes from 10 12 Pa s to<br />
10 12.6 Pa s. The viscosities of all glasses are summarized in<br />
Fig. 6. The viscosities of the oxide glasses are significantly<br />
lower than those of the corresponding oxynitride glasses. The<br />
Penetration depth, h, [mm]<br />
-0.08<br />
-0.06<br />
-0.04<br />
-0.02<br />
840 o C - 1.7x10 -3 mm/s<br />
830 o C - 5.8x10 -4<br />
La-Si-Mg-O glass<br />
820 o C - 1.8x10 -4<br />
810 o C - 3.6x10 -5<br />
790<br />
0.00<br />
0 100 200 300 400 500<br />
o C - 5.0x10 -7 mm/s<br />
Time, t [s]<br />
800 o C - 1.0x10 -5<br />
Fig. 3. Time dependence of the penetration depth in La-Si-Mg-O<br />
glasses under stress of 20 MPa<br />
Penetration depth, h [mm]<br />
-0.02<br />
-0.01<br />
890 o C - 8,8x10 -6 mm/s<br />
895 o C - 1,4x10 -5<br />
900 o C - 6,6 x10 -5<br />
910 o C - 1,1x10 -4<br />
920 o C - 1,8x 10 -4<br />
925 o C - 2,3x10 -4<br />
0.00<br />
0 100 200 300 400 500<br />
Time, t [s]<br />
Lu-Si-Mg-O-20N<br />
glass<br />
Fig. 4. Indentation creep curves in Lu-Si-Mg-O-N glass under<br />
stress of 20 MPa
Chem. Listy 105, s198 s201 (2011) LMV <strong>2008</strong> Regular Lectures<br />
Viscosity, [Pa.s]<br />
1E14<br />
1E13<br />
1E12<br />
1E11<br />
1E10<br />
1E9<br />
differences are up to 70 °C. However, the variations in Tg up<br />
to 45 °C can also be seen within each group. The lowest Tg<br />
belongs to La- and Yb-containing glasses whereas Lucontaining<br />
glasses always exhibit the highest Tg. The values<br />
Tg of as well as of the activation energies, which were determined<br />
from the Eq.(2), are summarized in Table I and compared<br />
with the values obtained earlier from the compressive<br />
creep tests on the same materials 11 .<br />
4. Discussion<br />
comp o<br />
T = 777 C<br />
g<br />
La-Si-Mg-O glass<br />
ind o<br />
T = 793 C<br />
g<br />
750 760 770 780 790 800 810 820 830 840<br />
Temperature, [ o C]<br />
compression<br />
indentation<br />
Fig. 5. Temperature dependencies of viscosities obtained by<br />
indentation and compressive creep 11 methods<br />
Viscosity [Pa.s]<br />
1E13<br />
1E12<br />
1E11<br />
1E10<br />
1E9<br />
Yb<br />
Lu<br />
Sm<br />
La<br />
La-N20<br />
Yb-N20<br />
760 780 800 820 840 860 880 900 920<br />
Temperature, [ o C]<br />
Sm-N20<br />
Lu-N20<br />
Fig. 6. Summary of the temperature dependencies of viscosities of<br />
the studied oxide and oxynitride glasses obtained by indentation<br />
creep<br />
The results indicate that the indentation creep method<br />
is capable of the determination of the viscosity of oxide and<br />
oxynitride glasses over five orders of magnitude and its results<br />
are comparable with those obtained by compressive<br />
creep method from considerably larger volumes of glass.<br />
However, some systematic differences were observed (see<br />
Fig. 5). Tg and viscosity from indentation creep are usually<br />
higher in the case of oxide and lower in the case of oxynitride<br />
s200<br />
Table I<br />
Summary of the indentation and earlier compressive creep<br />
tests in terms of Tg and activation energies<br />
Material<br />
Tg indentation<br />
[ o C]<br />
glasses while the activation energies are essentially the same.<br />
The differences in Tg are from 3 °C up to 24 °C and can be<br />
attributed to the differences in the coefficients k 1 and k2 and to<br />
local inhomogeneities in the glasses. The activation energies<br />
obtained by indentation are in the range from 1050 kJ mol 1<br />
up to 1400 kJ mol 1 with the highest values in the case of La-<br />
and lowest in Yb- and Lu-containing glasses. Note that these<br />
values are considerably higher than 400 550 kJ mol 1 reported<br />
for common Mg- or Pb-silicate glasses 7 . Such high<br />
activation energies reflect significantly stronger bonds in<br />
these glasses when RE and N are incorporated. The data in<br />
Table I indicate small but systematic decrease of activation<br />
energy of viscous flow in oxide glasses from 1400 kJ mol 1 to<br />
1170 kJ mol 1 when the largest cation La is replaced by the<br />
smallest Lu cation, with the exclusion of Yb. Change of the<br />
RE type has exactly opposite effect on Tg (Yb is an exclusion<br />
12 ). Similar tendencies were observed in the oxynitride<br />
glasses and also in compressive creep tests 10 12 . Thus, viscous<br />
flow is influenced by at least three effects:<br />
1. type of the cation modifier<br />
2. RE cation size, and<br />
3. N content.<br />
Chemistry, resp. electronic structure of the RE modifiers<br />
seems to weaken the bonding with the ionic size decrease. On<br />
the other side, ionic size reduction results in density increase<br />
and tightening of the glass network, which partially compensate<br />
for the above weakening. Finally, nitrogen significantly<br />
increases cross-linking of the network which results in much<br />
larger increase of viscosity and transition temperatures than<br />
the modification of RE 12 . However, the reason why the activation<br />
energies of viscous flow in the oxynitride glasses are<br />
lower than in the corresponding oxide glasses is not clear.<br />
5. Conclusions<br />
Tg compression<br />
[ o C]<br />
Q ind<br />
[kJ mol 1 ]<br />
Q comp<br />
[kJ mol 1 ]<br />
La-N0 793 ± 5 777 ± 5 1406±130 1373±129<br />
La-N20 829 ± 6 853 ± 6 1095±91 1151±94<br />
Sm-N0 790 ± 5 773 ± 5 1347±124 1313±122<br />
Sm-N20 841 ± 7 859 ± 6 1096±90 1140±93<br />
Yb-N0 782 ± 6 778 ± 6 1077±95 1097±97<br />
Yb-N20 837 ± 7 857 ± 7 1007±81 1120±91<br />
Lu-N0 800 ± 6 803 ± 6 1167±102 1151±100<br />
Lu-N20 873 ± 7 889 ± 7 1055±82 1110±87<br />
It was shown that the indentation creep method with flat<br />
indenter is suitable for the determination of viscosity, Tg and<br />
activation energy of oxide and oxynitride glasses. The effects<br />
of RE-type and nitrogen content on the viscosity and glass<br />
transition temperature, which were measured earlier by the<br />
compressive creep method, were also confirmed. The differ-
Chem. Listy 105, s198 s201 (2011) LMV <strong>2008</strong> Regular Lectures<br />
ences in the measured viscosities result in the differences in<br />
Tg values up to 25 °C whereas the values of the activation<br />
energy remain identical. The variations in viscosity can be<br />
attributed to the differences in the coefficients k 1 and k2 and to<br />
local inhomogeneities in the glasses. The effects of nitrogen<br />
and RE-type were attributed to the increase of network crosslinking<br />
and tightening of the glass structure when nitrogen<br />
and RE with smaller ionic radii are incorporated in the glass<br />
network, respectively.<br />
This work was supported by the Slovak Research and Development<br />
Agency under the contract No. APVV-0034-07 and<br />
Slovak Grant Agency for Science under the contracts No.<br />
VEGA 1/4160/07 and VEGA 2/0088/08. The help<br />
of F. Dor áková is appreciated.<br />
REFERENCES<br />
1. ONeill H.: Hardness Measurements of Metals and Alloys,<br />
Chapman and Hall, London 1967.<br />
2. Oliver W. C., Pharr G. M.: J. Mater Res. 7, 1564 (1992).<br />
3. Heynes M. S. R., Rawson H.: Phys. Chem. Glass. 2/1, 1<br />
(1961).<br />
4. Douglas R. W., Armstrong W. L., Edward J. P., Hall D.:<br />
Glass Tech. 6/2, 52 (1965).<br />
5. Yu E. C., Li J. C. M.: Phil. Mag. 36, 9 (1977).<br />
6. Yu E. C., Li J. C. M.: J. Mater. Sci. 12, 2200 (1977).<br />
7. Cseh G., Chinh N.Q., Tasnádi P., Szommer P., Juhász<br />
A.: J. Mater. Sci. 32, (1997) 1733.<br />
s201<br />
8. Cseh G, Bär J., Gudladt H.-J., Lendvai J., Juhász A.:<br />
Mater. Sci. Eng., A 272, 145 (1999).<br />
9. Han W. T., Tomozawa M.: J. Am. Ceram. Soc. 73, 3626<br />
(1990).<br />
10. Becher P. F., Ferber M. K.: J. Amer. Ceram. Soc. 87,<br />
1274 (2003).<br />
11. Lofaj F., Dor áková F., Hoffmann M. J.: J. Mat. Sci. 40,<br />
47 (2005).<br />
12. Lofaj F., Dériano S., LeFloch M., Rouxel T., Hoffmann<br />
M. J.: J. Non-Cryst. Solids 344, 8 (2004).<br />
F. Lofaj (Institute of Materials Research of SAS, Watsonova<br />
47, 040 01 Ko ice, Slovakia): Localized Viscous<br />
Flow in the Oxide and Oxynitride Glasses by Indentation<br />
Creep<br />
Localized viscous flows in the oxide and oxynitride<br />
glasses were investigated by the indentation creep and the<br />
results were compared with the data obtained in compression.<br />
Despite general agreement between both methods, the observed<br />
differences can be attributed to geometrical factors and<br />
local inhomogeneities in the glass. RE type and nitrogen content<br />
exhibit strong influence on the glass viscosity. Their effects<br />
were related to the increase of network cross-linking and<br />
tightening of the glass structure when nitrogen and RE with<br />
smaller ionic radii are incorporated in the glass network, respectively.
Chem. Listy 105, s202 s205 (2011) LMV <strong>2008</strong> Regular Lectures<br />
MICROSTRUCTURE AND LOCAL MECHANICAL CHARACTERISTICS OF Zr1Nb<br />
ALLOY AFTER HARDENING<br />
ROSTISLAV MEDLÍN, JAN ÍHA,<br />
and OLGA BLÁHOVÁ<br />
New Technology Research Centre, University of West Bohemia,<br />
Univerzitní 8, 306 14 Plze , Czech Republic<br />
medlin@ntc.zcu.cz<br />
Key words: Zr1Nb, Zr alloys, LOCA, nanoindentation, X-Ray<br />
microanalysis, EPMA, X-Ray diffraction<br />
1. Introduction<br />
Zirconium alloys are used as cladding materials for fissionable<br />
fuel in nuclear reactors mainly for their mechanical<br />
properties. Their characteristics after long-term oxidation<br />
under service conditions in a reactor are intensively investigated.<br />
In order to define their fail-safety, it is necessary to<br />
know their mechanical characteristics after long-term service<br />
and high temperature oxidation, as well as the reasons for<br />
changes in those characteristics.<br />
This paper presents the summary of mechanical properties,<br />
results of X-ray diffraction and electron microprobe<br />
measurements of the Zr1Nb alloy after various exposition<br />
time prior to hardening, which simulated the LOCA conditions<br />
(Loss Of Coolant Accident). Correlations between the<br />
measurements are discussed.<br />
2. Experimental<br />
The samples were small tubes from Zr1Nb material with<br />
600 m wall thickness, which are identical to actual cladding<br />
tubes. LOCA was simulated by heating at 950 °C in steam for<br />
0, 3, 6, 9, 15, 30, 60 and 120 minutes and subsequent hardening<br />
in water with ice.<br />
Regarding to the previous results 1 3 , this article contains<br />
new measured data. Samples were examined by X-Ray diffractometer<br />
Panalytical XPert PRO equipped with hightemperature<br />
chamber Anton Paar HTK 1200 N, Nanoindenter<br />
XP and scanning electron microscope (SEM)<br />
Quanta 200 with EDAX EDS and WDS X-Ray detectors,<br />
mostly termed Electron Probe MicroAnalysis (EPMA).<br />
Nanoindentation and microprobe data were measured on<br />
the cross-section of the tube wall. Nanoindentation measurements<br />
were taken with the load of 8 mN in 5 m intervals<br />
using the Berkovich indenter 4 . The indentation hardness HIT<br />
and indentation modulus EIT were measured by the IIT<br />
(Instrumented Indentation Testing) method 5,6 .<br />
As it can be seen in the picture of the cross-section in<br />
Fig. 1, there are different layers in the material: an oxide layer<br />
under the surface and two different regions in the metal. The<br />
picture was taken by the BSE (Back Scattering Electrons)<br />
detector in SEM. The various grey levels correspond to various<br />
values of atomic weight of elements in the material:<br />
lighter elements appear darker.<br />
s202<br />
Fig. 1. Typical cross-section of the hardened sample (exposition<br />
time 3 min) with marked oxides, Alpha Zr(O) and Alpha Zr phases<br />
and locations of hardness and EPMA measurements. The SEM micrograph<br />
was taken by the BSE<br />
Under the oxide layer, there is an oxygen-stabilized Zr in<br />
the Alpha phase Zr(O). In greater depth, there is Alpha phase<br />
where there is not enough oxygen to prevent the phase transformation<br />
from Alpha to Beta phase at high temperature. The<br />
oxygen-poor structure in the middle of the wall thickness is<br />
called the Prior Beta phase 7 .<br />
Problem is that X-Ray diffraction after high-temperature<br />
experiments (discussed in other paper 8 ) showed certain<br />
amount of undissolved Beta phase in that region. That is why<br />
calling all the material as Beta phase may cause misunderstanding.<br />
Identified Beta phase by X-Ray diffraction was<br />
located in Alpha Zr phase region. The oxygen-rich region<br />
Alpha Zr(O) phase and the oxygen-poor region Alpha Zr were<br />
marked with arrows (Fig. 1).<br />
The differences between the layers correspond to different<br />
amounts of oxygen. However, the oxygen solubility is<br />
also affected by other influences 9 , such as hydrogen content<br />
and its solubility in the material. EPMA results in [au %]<br />
percentage represent [wt.%] (weight percentage). Standardized<br />
percentage by weight during the low content volume of<br />
oxygen has to be compared very carefully with values measured<br />
by other methods. This cautions us to be very careful and<br />
determine the oxygen content in Auxiliary Units (au). EPMA<br />
measurements were carried out from the edging of the sample<br />
towards to the centre (Fig. 1).<br />
Lattice parameters and unit cell volumes were calculated<br />
by Rietveld s method from diffraction patterns. Biaxial lattice<br />
stress was calculated only from the -Zr diffraction line (102)<br />
drift from the reference position according to formula:<br />
1<br />
2<br />
E<br />
d d0<br />
d<br />
where E is Young modulus, is Poisson number, d0 is reference<br />
interplanar distance, d is measured interplanar distance.<br />
3. Results of Measurements<br />
0<br />
EPMA data measured on the cross-section of samples<br />
are shown in Fig. 2 in micrometers from the Alpha Zr(O)/<br />
Alpha Zr layer interface. Higher oxygen content in the Al-
Chem. Listy 105, s202 s205 (2011) LMV <strong>2008</strong> Regular Lectures<br />
pha Zr(O) phase is clearly visible as well as the difference<br />
between the distributions of oxygen in dependence on various<br />
exposition times prior to hardening.<br />
EPMA values were measured along the same measuring<br />
line as the indentation hardness. The summary results for all<br />
samples are shown in Fig. 3a h. The beginning of coordinates<br />
is in the Alpha Zr(O)/Alpha Zr layer interface. The correlation<br />
between the oxygen content and indentation hardness values<br />
in Fig. 3 is evident.<br />
Fig. 2. Oxygen depth-profiles on the cross-sections in dependence<br />
on different exposition time prior to hardening<br />
a) t = 0 min<br />
b) t = 3 min<br />
c) t = 6 min<br />
s203<br />
d) t = 9 min<br />
e) t = 15 min<br />
f) t = 30 min<br />
g) t = 60 min<br />
h) t = 120 min<br />
Fig. 3a h. Oxygen depth-profiles and indentation hardness values<br />
measured by the nanoindentation method
Chem. Listy 105, s202 s205 (2011) LMV <strong>2008</strong> Regular Lectures<br />
Fig. 4. Indentation hardness and indentation modulus measured<br />
in Alpha Zr<br />
Fig. 5. Indentation hardness measured by nanoindentation and<br />
corresponding oxygen content measured by EPMA in Alpha Zr<br />
Fig. 4 shows a comparison of the indentation hardness<br />
and indentation modulus values in the Alpha Zr phase in all<br />
samples. Fig. 5 contains the EPMA-measured oxygen content<br />
compared with corresponding indentation hardness values in<br />
the Alpha Zr phase. There is a close correspondence between<br />
oxygen content and indentation hardness.<br />
Fig. 6 contains X-ray diffraction patterns (in detail mentioned<br />
in 8 ) for all samples with very weak oxide signal related<br />
to ZrO2. Quantification of the oxide signal using the phase<br />
analysis was attempted, even though this was very difficult<br />
due to weak signal. Tab. I shows these results together with<br />
the EPMA results from the same region.<br />
Fig. 6. X-Ray diffraction patterns measured in the centre of each<br />
sample. Weak oxide signals are only detectable at the longest exposition<br />
times prior to hardening<br />
s204<br />
Table I<br />
X-Ray quantitative phase analysis of ZrO2 content together<br />
with results of EPMA measurement of the oxygen content<br />
Exposition time<br />
[min]<br />
X-Ray ZrO2<br />
[wt.%]<br />
EPMA O<br />
[au.%]<br />
0 0 1.39<br />
3 0 1.30<br />
6 0 2.03<br />
9 0.5 1.49<br />
15 0.28 1.75<br />
30 0.54 1.61<br />
60 0.44 1.64<br />
120 1.35 1.90<br />
High local hardness is accompanied by high local oxygen<br />
concentration (Fig. 5). Biaxial stress and unit cell volume<br />
determined from X-Ray diffraction have almost the same<br />
tendency (Fig. 7). Hardness course have increasing tendency<br />
with increasing exposition time except samples exposed for 6<br />
and 9 minutes (Fig. 8). The sample exposed for 6 minutes has<br />
the smallest unit cell volume together with the highest amount<br />
of oxygen (Fig. 9). This could be caused by presence of oxy-<br />
Fig. 7. Cell volume measured by X-Ray together with stress for<br />
various exposition times prior to hardening measured in Alpha<br />
Zr<br />
Fig. 8. Cell volume measured by X-Ray together with indentation<br />
hardness for various exposition times prior hardening measured<br />
in Alpha Zr
Chem. Listy 105, s202 s205 (2011) LMV <strong>2008</strong> Regular Lectures<br />
Fig. 9. Cell volume measured by X-Ray together with oxygen<br />
content for various exposition times prior hardening measured by<br />
EPMA in Alpha Zr<br />
gen in grain boundaries, not in interstitial positions in crystallographic<br />
lattice.<br />
Under various conditions 9 , which had been investigated<br />
before, there was some amount of hydrogen in the material,<br />
which might have changed its mechanical characteristics independently<br />
on the oxygen content. However, no such influence<br />
was observed in these samples, in which hydrogen content<br />
was negligible.<br />
4. Conclusions<br />
This paper is based on a part of long-time investigation<br />
and characterization of mechanical and other properties of<br />
a new Zr1Nb alloy. In this article were evaluated the relations<br />
of oxygen content, unit cell parameters and biaxial stress together<br />
with nanoindentation hardness. There is a close correspondence<br />
between oxygen volume and microhardness.<br />
This work was supported by the project MPO R No. 2A<br />
1TP1/037 and project Kontakt AIP No. MEB 080869.<br />
REFERENCES<br />
1. Vrtílková, V. et al.: Vliv rozpou t ní oxidu vytvo eného<br />
na povlakové trubce ze Zr-slitin na termomechanické<br />
vlastnosti povlakové trubky po vysokoteplotních p echodech<br />
(The Influence of Dissolution of the Oxide Formed<br />
on the Fuel-Cladding Tube from Zr-Alloy upon the Ther-<br />
s205<br />
momechanical Properties of the Tube upon High-<br />
Temperature Transitions): Výzkumná zpráva 1164<br />
(Research report). UJP Praha, Praha 2005.<br />
2. Medlín R., Vrtílková V.: Proceedings of the 12th international<br />
workshop on Applied physics of condensed matter.<br />
Bratislava, 2006, pp. 129 132. Slovak University of<br />
Technology, Bratislava 2006.<br />
3. Medlín R., Zubko P., Bláhová O.: Lokální mechanické<br />
vlastnosti 2006 (Local Mechanical Properties), Plze<br />
2006, pp. 111 115. ZCU, Plze 2006.<br />
4. Bláhová O., ugár M.: Investigation of Nano-Mechanical<br />
Properties of Zirconium Alloys Using Nanoindentation.<br />
In this issue.<br />
5. Pe ek L., Zubko P., Kalmár P.: Acta Metallugica Slovaca<br />
spec. iss. 1, 10, 203 207 (2004).<br />
6. Metallic materials Instrumented indentation test for<br />
hardness and materials parameters Part 1: Test<br />
method.<br />
7. Chung H. M.: Nuclear Eng. Technol. 37, 327 (2005).<br />
8. íha J., Bláhová O., utta P.: Fázové zm ny slitiny<br />
Zr1Nb a jejich vliv na lokální mechanické vlastnosti<br />
(Phase Changes in the Zr1Nb Alloy and their Impact on<br />
the Local Mechanical Properties). In this issue.<br />
9. Medlín R., Zubko P.: Proceedings of the 13th international<br />
workshop on Applied physics of condensed matter.<br />
ilina <strong>2007</strong>, pp. 239 242. University of ilina, Slovakia<br />
<strong>2007</strong>.<br />
R. Medlín, J. íha, and O. Bláhová (New Technology<br />
Research Centre, West Bohemia University, Plze , Czech<br />
Republic): Microstructure and Local Mechanical Characteristics<br />
of Zr1Nb Alloy after Hardening<br />
Zirconium alloys are used as cladding materials for<br />
atomic fuel in nuclear reactors mainly for their mechanical<br />
properties. Their characteristics after long time oxidation<br />
under service conditions in a reactor are intensively investigated.<br />
In order to define their fail-safety and damage tolerance,<br />
it is necessary to know their mechanical characteristics<br />
after long-term service and high temperature oxidation as well<br />
as the reasons for changes in those characteristics.<br />
This paper presents the summary of mechanical properties,<br />
results of X-ray diffraction and electron microprobe<br />
measurements of the Zr1Nb alloy after various exposition<br />
times prior to hardening, which simulated the LOCA (loss of<br />
coolant accident) conditions. Correlations between the measurements<br />
are discussed.
Chem. Listy 105, s206 s209 (2011) LMV <strong>2008</strong> Regular Lectures<br />
STANOVENIE VE KOSTI PLASTICKEJ ZÓNY VIDEOEXTENZOMETRICKOU<br />
METÓDOU<br />
MÁRIA MIHALIKOVÁ a UBOMÍR<br />
AMBRI KO<br />
Technická univerzita v Ko iciach, Hutnícka fakulta, Katedra<br />
náuky o materiáloch, Park Komenského 11, 043 85 Ko ice,<br />
Slovensko<br />
maria.mihalikova@tuke.sk, lubomir.ambrisko@tuke.sk<br />
K u ové slová: plastická zóna, videoextenzometrické meranie,<br />
hlboko a ný plech<br />
1. Úvod<br />
Hlboko a né ocele pova ujeme za ocele hromadnej<br />
spotreby nielen pre ich priaznivé ekonomické charakteristiky<br />
výroby, ale hlavne pre ich dobré pevnostné vlastnosti, v etky<br />
poznatky o nich majú ve ký praktický význam. Príspevok si<br />
kladie za cie posúdi , ako sa dané vlastnosti budú meni<br />
v prípade materiálu s koncentrátormi napätia.<br />
V práci bolo pozorované správanie hlboko a nej ocele<br />
pri jej za a ovaní statickým jednoosovým napätím. Videoextenzo-metrickou<br />
metódou bolo stanovené rozlo enie deformácií<br />
v okolí vrubov.<br />
Videoextenzometria je bezkontaktná metóda merania<br />
deformácií, ktorá vyu íva moderné po íta ové a snímacie<br />
technológie, ako aj podporu nových programových<br />
aplikácií 1,2 . Vývoj tejto metódy merania je daný vývojom<br />
obrazovej analýzy, resp. vývojom programovej metódy vyhodnocovania<br />
snímaného obrazu, ale hlavne aplika nými<br />
po iadavkami praxe 3 .<br />
O vplyve vrubov na deformáciu a vlastnosti kon truk -<br />
ných ocelí mô eme skon tatova , e:<br />
koncentrátory napätia spôsobujú viacosový stav napätosti,<br />
na ve kos napätí v okolí vrubu vplýva polomer zakrivenia<br />
vrubu a jeho h bka,<br />
s vä ím polomerom vrubu sa zvy ujú pevnostné vlastnosti<br />
Re a Rm skú aných ocelí.<br />
Na význam koncentrácie napätia v okolí ostrých vrubov<br />
prvý poukázal E. E. Inglis. Dokázal, e najvä ia koncentrácia<br />
napätia vzniká v mieste najvä ieho zakrivenia vnútorného<br />
povrchu vrubu. Ak bude polomer zakrivenia kore a trhliny<br />
ve mi malý, jednoosové ahové za a enie telesa s trhlinou<br />
vyvolá ahové napätie nielen v smere y, ale aj v smere x, z<br />
oho vzniká kolmá zlo ka napätia x. Z toho vyplýva, e napätie<br />
y bude ma maximálnu hodnotu na hrote trhliny.<br />
Existuje nieko ko metód na snímanie a výpo et deformácií<br />
a napätí. V práci boli porovnávané videoextenzometrická<br />
metóda a výpo tová metóda získavania hodnôt ve kosti<br />
plastickej zóny.<br />
s206<br />
2. Materiál a metodika experimentov<br />
Pre statickú skú ku v ahu boli pou ité skú obné telesá<br />
z hlboko a nej iarovo pozinkovanej mikrolegovanej ocele,<br />
akosti EN 10292/2000. Plechy hrúbky 1,6 mm boli valcované<br />
za studena, ich mechanické vlastnosti sú v tab. I. Skú obné<br />
telesá boli odobraté kolmo k smeru valcovania.<br />
Pre skú ku jednoosovým ahom boli pripravené telesá<br />
pod a STN 42 0321. Telesá mali obojstranný vrub tvaru U.<br />
Tabu ka I<br />
Mechanické vlastnosti skú aného materiálu<br />
Materiál Mechanické vlastnosti<br />
EN<br />
10292/2000<br />
Rp 0,2 [MPa]<br />
prie ne min.<br />
Obr. 1. Tvar skú obného telesa<br />
Pre vyhodnotenie rozlo enia deformácií bola urobená<br />
statická skú ka jednoosovým ahom na univerzálnom trhacom<br />
stroji FP 100/1 s rýchlos ou posuvu traverzy 1,5 mm min 1 ,<br />
s rozsahom sily 10 kN. Rozmery skú obného telesa pod a<br />
obr. 1 uvádza tab. II.<br />
Tabu ka II<br />
Rozmery skú obných telie<br />
A<br />
[mm]<br />
B<br />
[mm]<br />
Metalografická analýza<br />
Rm [MPa]<br />
prie ne min.<br />
Amin [%]<br />
L0 = 80 mm<br />
prie ne<br />
340 410 20<br />
C<br />
[mm]<br />
D<br />
[mm]<br />
E<br />
[mm]<br />
R<br />
[mm]<br />
2 134 14 20 2 2<br />
truktúra ocele a zinkový povlak (obr. 2 a 3) boli pozorované<br />
svetelným mikroskopom OLYMPUS na výbrusoch<br />
pripravených za mokra, klasickým brúsením, le tením<br />
a leptaním v 2% roztoku nitalu. Ide o oce s nízkym obsahom<br />
uhlíka (0,10 %), mikro truktúru tvorí feritické zrno s malým<br />
mno stvom perlitu.
Chem. Listy 105, s206 s209 (2011) LMV <strong>2008</strong> Regular Lectures<br />
Obr. 2. Mikro truktúra skú anej ocele<br />
Obr. 3. Zinkový povlak skú anej ocele<br />
Obr. 4. Otváranie trhliny<br />
l<br />
a<br />
Pre otváranie trhliny (obr. 4) d ka plastickej zóny pre U<br />
vrub sa vypo íta pod a vz ahu (1) 4 .<br />
r<br />
pl<br />
d pl<br />
l.<br />
2 Re<br />
2<br />
kde dpl d ka plastickej zóny, normálové napätie, Re<br />
medza klzu materiálu, rpl polomer plastickej zóny<br />
Na obr. 5 je znázornené skú obné teleso pripravené na<br />
videoextenzometrické meranie 5 . Rozostup bodov bol 1 1 mm.<br />
Osvetlené skú obné teleso upnuté do e ustí trhacieho stroja<br />
snímala kamera, ktorá je sú as ou videoextenzometrického<br />
systému ME 46. Snímaný obraz spracovával software Dot-<br />
Measuring, ktorý automaticky ukladal snímaný obraz ka dú<br />
sekundu. Po as procesu ahania skú obnej ty e sa vo vopred<br />
stanovenom okamihu na ahovom diagrame urobila zna ka<br />
y<br />
d pl<br />
R e<br />
x<br />
(1)<br />
s207<br />
Obr. 5. Teleso s U vrubom<br />
a zárove sa jej priradil daný obrázok. Získal sa tak sled obrázkov<br />
ako aj záznam ahového diagramu ka dého telesa.<br />
Obrázky sa vyhodnocovali v programe Ellipse. Stanovovali sa<br />
geometrické a iská kontrastných bodov na obrázku nedeformovaného<br />
a deformovaného telesa, tieto hodnoty boli vstupom<br />
pre výpo et pozd nej a prie nej deformácie programom<br />
VDTK. Pre jednotlivé deformácie platí výpo et pod a obr. 6.<br />
Obr. 6. Grafické znázornenie výpo tu deformácií<br />
Pre deformáciu v smere osi y (tzn. v smere za a enia)<br />
pre element 11 v ase t platí vz ah (2):<br />
( Y , 11,<br />
t )<br />
1<br />
2<br />
Y<br />
Y<br />
( 12 p,<br />
t )<br />
( 12 p,<br />
0 )<br />
( 22 p , t )<br />
( 22 p , 0 )<br />
Výsledkom programu VDTK sú deforma né mapy,<br />
tvorené súradnicami a ísk bodov a súradnicou z, ktorá<br />
v jednotlivých farebných odtie och znázor uje deformáciu.<br />
3. Výsledky experimentov<br />
Y<br />
Y<br />
Rozlo enie deformácií<br />
Y<br />
( 11p<br />
, t )<br />
Y<br />
( 11p<br />
, 0 )<br />
Y<br />
( 21p<br />
, t )<br />
Y<br />
( 21p<br />
, 0 )<br />
100%<br />
Na telesách s obojstranným vrubom typu U bolo vyhodnotené<br />
rozlo enie deformácií na dvoch miestach ahového<br />
diagramu: na medzi pevnosti a pred perforáciou (okamih tesne<br />
pred roztrhnutím skú obného telesa). Pre ka dý stav sa<br />
zis ovali tatistické hodnoty ako: maximálna, minimálna<br />
a priemerná pre pozd ne a prie ne deformácie. Výsledky<br />
hodnôt zahr ujú priemerné tatistické výsledky z nieko kých<br />
1<br />
1<br />
(2)
Chem. Listy 105, s206 s209 (2011) LMV <strong>2008</strong> Regular Lectures<br />
Obr. 7. Okamihy vyhodnocovania deformácií; Rm medza pevnosti;<br />
tesne pred lomom<br />
roztrhnutých telies. íselné hodnoty pozd nych deformácií<br />
sú vyhodnocované ako elementy v okolí bodu pre daný st pec<br />
a vzdialenos od vrubu. Grafickým zobrazením deformácií<br />
a ich rozlo enia v okolí vrubov sú deforma né mapy. Program<br />
neumo uje farebne zjednoti mapy a preto ten istý odtie<br />
farby na jednej mape neznamená tú istú hodnotu deformácie<br />
na druhej mape.<br />
Na obr. 7 sú vyzna ené okamihy vyhodnocovania deformácií.<br />
Tab. III uvádza pod a vz ahu (2) vypo ítané hodnoty<br />
pozd nych y a prie nych x deformácií zo vstupných údajov,<br />
ktoré sme získali z posunutia a ísk kontrastných bodov na<br />
telese s U vrubom. Na ploche medzi vrubmi boli nanesené<br />
kontrastné body v 9 radoch a 11 st pcoch, vyhodnocovalo sa<br />
9 st pcov, obr. 5. Údaje sú z tesnej blízkosti vrubu z avej<br />
strany telesa, kde do lo skôr ku iniciácii trhliny.<br />
Obr. 8. Deforma ná mapa telesa s U vrubom na Rm<br />
Tabu ka III<br />
Deformácie na telese s U vrubom<br />
Teleso<br />
s U vrubom<br />
Rm<br />
lom<br />
[ % ] [ % ]<br />
Deformácia x y x y<br />
Max. 2,04 42,4 2,3 89,94<br />
Min. 4,68 2,54 6,3 2,62<br />
Priemer 1,37 11,93<br />
s208<br />
Obr. 9. Deforma ná mapa telesa s U vrubom tesne pred lomom<br />
Tabu ka IV<br />
Ve kos plastickej zóny pre teleso s U-vrubom<br />
U-vrub<br />
Rozlo enie pozd nej deformácie na telesách s U vrubom<br />
zobrazujú deforma né mapy na obr. 8 a 9.<br />
Aplikáciou vz ahu (1) pre výpo et ve kosti plastickej<br />
zóny pre vruby typu U a stanovením polomeru plastickej zóny<br />
s vyu itím deforma ných máp pre skú aný materiál sme dospeli<br />
k výsledkom uvedeným v tab. IV. Pri ur ovaní plastickej<br />
zóny sme zmerali na deforma ných mapách maximálnu deformáciu<br />
vykreslenú ervenou farbou, pri om za plastickú<br />
zónu sme pova ovali 60 % z maximálnej deformácie.<br />
4. Závery<br />
Rozlo enie deformácie u hladkých skú obných telies na<br />
medzi pevnosti je homogénne. V práci boli sledované<br />
telesá s U vrubom, pri om nehomogenita rozlo enia<br />
deformácií bola ovplyvnená vrubom, rozpätie hodnôt<br />
pozd ných deformácií na Rm bolo od 2,54 do 42,4 %.<br />
Aplikáciou vz ahu pre výpo et ve kosti plastickej zóny<br />
pre vruby typu U a odmeraním plastickej zóny pre skúaný<br />
materiál na medzi pevnosti sme dospeli k výsledkom,<br />
ktoré sa vzájomne odli ujú o 6,6 %. V prípade<br />
stavu tesne pred lomom sa výsledky lí ia o 9,3 %.<br />
Prezentované výsledky boli získané v rámci rie enia projektov<br />
VEGA 1/4149/07 a APVV 0326-07.<br />
LITERATÚRA<br />
rpl [mm]<br />
vypo ítané odmerané<br />
Rm 2,88 3,05<br />
lom 3,86 3,5<br />
1. Mihaliková M., Gazdag .: Metalurgija 47, 203 (<strong>2008</strong>).<br />
2. Mihaliková M., Pe ek J.: Acta Metallurgica Slovaca 13,<br />
151 (<strong>2007</strong>).<br />
3. Mihaliková M.: Strojárstvo 12, 66 (2006).<br />
4. Ku era J.: Úvod do mech. lomu, V B, Ostrava 2006.<br />
5. Maru iaková A., Pe ek L., Gazdag .: Acta Metallurgica<br />
Slovaca 13, 438 (<strong>2007</strong>).
Chem. Listy 105, s206 s209 (2011) LMV <strong>2008</strong> Regular Lectures<br />
M. Mihaliková and . Ambri ko (Department of materials<br />
science, Faculty of metallurgy, Technical university of<br />
Ko ice, Slovakia): Size of the Plastic Zone Determined by<br />
Videoextensometric Method<br />
This work deals with determination of deformations<br />
distribution. The deep - drawing steels with notches was<br />
loaded by static uniaxial tension. By videoextensometric<br />
method was established the size of plastic zone near notches.<br />
The size of plastic zone was rated with calculation too. Results<br />
of both methods are identic.<br />
s209
Chem. Listy 105, s210 s213 (2011) LMV <strong>2008</strong> Regular Lectures<br />
FÁZOVÉ ZM NY SLITINY Zr-1Nb A JEJICH VLIV NA LOKÁLNÍ MECHANICKÉ<br />
VLASTNOSTI<br />
JAN ÍHA, OLGA BLÁHOVÁ a PAVOL<br />
UTTA<br />
Výzkumné centrum - Nové technologie, Západo eská univerzita<br />
v Plzni, Univerzitní 8, 306 14 Plze , eská republika<br />
janriha@ntc.zcu.cz<br />
Klí ová slova: slitiny zirkonia, difrak ní fázová analýza in<br />
situ, indenta ní tvrdost, fázové transformace<br />
1. Úvod<br />
Slitiny zirkonia jsou v jaderné energetice pou ívány ji<br />
více ne 50 let. Je to p edev ím díky jejich vysoké korozní<br />
odolnosti ve vod i mnoha dal ích agresivních prost edích<br />
a velmi malému p í nému profilu záchytu tepelných neutron<br />
. Jsou tedy ideálním materiálem pro výrobu ochranných<br />
povlak palivových ty í, vystavených extrémním podmínkám<br />
aktivní zóny jaderného reaktoru. Pro tyto ú ely je rozhodující<br />
minimální obsah hafnia, které se v zirkoniu b n vyskytuje<br />
a má asi 600 vy í p í ný pr ez pro záchyt tepelných neutron<br />
. Vlivem p ímého styku s chladící vodou o cca 320 °C<br />
a tlaku 16 MPa dochází k tvorb povrchové oxidické vrstvy,<br />
která ov em výrazn zpomaluje rychlost dal í oxidace 2 .<br />
V sou asné dob je p edm tem výzkumu chování slitin p i<br />
haváriích typu LOCA (loss of coolant accident), p i nich<br />
vlivem úniku chladícího média dochází k prudkému oh evu<br />
na p ibli n 1000 °C, s následným velmi rychlým ochlazením.<br />
Ve struktu e materiálu pak dochází k výrazným zm nám,<br />
vedoucím ke zhor ení mechanických vlastností zejména<br />
sní ení ta nosti a maximální síly do poru ení. Tento p ísp -<br />
vek je zam en p edev ím na popis fázových transformací za<br />
vysokých teplot a jejich vliv na indenta ní tvrdost a modul<br />
pru nosti.<br />
Obr. 1. Binární diagram soustavy Zr Nb (p evzato z citace 4 )<br />
s210<br />
2. Experiment<br />
Jako experimentální materiál byla pou ita slitina zirkonia<br />
a niobu (obr. 1) s malým obsahem kyslíku (obr. 2). Chemické<br />
slo ení je uvedeno v tab. I.<br />
P vodním polotovarem byla ta ená beze vá trubka<br />
s vn j ím pr m rem 9 mm a tlou kou st ny zhruba 0,7 mm.<br />
Pro sledování fázových transformací byla vyu ita rentgenová<br />
difrak ní analýza provád ná in situ. M ení probíhala na<br />
automatickém prá kovém difraktometru Panalytical XPert<br />
PRO osazeném m d nou rentgenovou lampou ( Ka1 =<br />
0,15405980 nm) a ultra-rychlým polovodi ovým detektorem<br />
PIXcel s vysokou rozli ovací schopností.<br />
Oh ev vzorku byl zaji t n vysokoteplotní komorou Anton<br />
Paar HTK 1200N s maximální pracovní teplotou 1200 °C.<br />
Komora je vybavena induk ním oh evem zaji ujícím rovnom<br />
rné proh átí vzork prakticky bez teplotních gradient .<br />
Zm na rozm r vzorku vlivem teplotní rozta nosti je kompenzována<br />
speciálním dr ákem, který zm nou vý ky udr uje<br />
povrch vzorku stále v p esné poloze zaji ující spln ní Braggova<br />
zákona:<br />
n<br />
kde n je ád reflexe, je vlnová délka RTG zá ení, d je mezirovinná<br />
vzdálenost a je Bragg v úhel. V opa ném p ípad<br />
by do lo k posunu difrak ních linií, a tím ke zkreslení výsledk<br />
. Komora byla vakuována rota ní olejovou výv vou<br />
Obr. 2. Binární diagram soustavy Zr O (p evzato z citace 3 )<br />
Tabulka I<br />
Chemické slo ení experimentálního materiálu<br />
Nb<br />
[hm.%]<br />
2d<br />
sin<br />
H<br />
[ppm]<br />
N<br />
[ppm]<br />
C<br />
[ppm]<br />
O<br />
[ppm]<br />
1,0 1,1 3 20 100 840 zbytek<br />
Zr<br />
(1)
Chem. Listy 105, s210 s213 (2011) LMV <strong>2008</strong> Regular Lectures<br />
1000<br />
800<br />
600<br />
400<br />
200<br />
0 50 100 150 200 250 300<br />
Time (min.)<br />
Obr. 3. Pr b h oh evu vzorku<br />
Tabulka II<br />
Hodnoty indenta ní tvrdosti a indenta ního modulu pru nosti<br />
experimentálního materiálu<br />
Stav vzorku Tvrdost<br />
[GPa]<br />
BOC Edwards RV3 vytvá ející hrani ní tlak p ibli n 0,2 Pa.<br />
Difraktogramy byly snímány v dy v rozsahu 2 =<br />
28 72°. Oh ev vzorku probíhal stup ovit od pokojové teploty<br />
a do 1000 °C. V intervalu 100 800 °C probíhal oh ev<br />
v dy po 100 °C, po dosa ení 800 °C byl jeden difraktogram<br />
zm en p i 850 °C, vzhledem k p ibli nému dosa ení teploty<br />
fázové pem ny -zirkonia (hexagonální, t sn uspo ádaná<br />
m í ka) na -zirkonium (kubická, prostorov centrovaná<br />
m í ka) pi 862 °C. Dal í difraktogramy byly snímány pi<br />
900 a 1000 °C. Celý pr b h oh evu je uveden na obr. 3.<br />
Pro pot eby m ení byly p vodní trubi ky kruhového<br />
pr ezu podéln roz íznuty na polovinu a poté mechanicky<br />
slisovány do tvaru desti ky. Plocha ozá ená RTG zá ením<br />
byla 10 10 mm. Vliv zdeformované struktury byl minimální,<br />
proto e s rostoucí teplotou do lo k rekrystalizaci.<br />
M ení probíhala také na p ístroji AXS Bruker D8 Discover<br />
s kobaltovou rentgenovou lampou ( Ka1 =<br />
0,1789010 nm) a plo ným detektorem Hi-Star.<br />
Indenta ní m ení bylo provedeno na p ístroji NanoIndenter<br />
XP Berkovi ovým indentorem se zatí ením 8 mN.<br />
M ení bylo provedeno v dy na n kolika místech po celé<br />
plo e povrchu vzorku a hodnoty byly poté zpr m rovány.<br />
Výsledky jsou uvedeny v tab. II.<br />
3. Diskuse výsledk<br />
Modul pru nosti<br />
[GPa]<br />
Výchozí stav brou eno 5,70 ± 1,32 125,2 ± 20,6<br />
Výchozí stav leptáno 3,59 ± 0,96 96,0 ± 9,0<br />
Po expozici s vrstvou<br />
oxidu<br />
Po expozici<br />
odbrou ený oxid<br />
10,51 ± 3,19 180,3 ± 38,0<br />
7,63 ± 1,43 131,0 ± 14,5<br />
Na difraktogramu m eném p i pokojové teplot je patrné,<br />
e se ve slitin nevyskytovalo pouze -zirkonium, ale<br />
s211<br />
Intenzita [cts]<br />
100000<br />
80000<br />
60000<br />
40000<br />
20000<br />
0<br />
Nam ená data<br />
Prolo ená k ivka<br />
Zr 3 O (006)<br />
33,5 34,0 34,5 35,0 35,5 36,0 36,5 37,0 37,5<br />
i fáze, která byla s odvoláním na práci 3 identifikována jako<br />
oxid Zr3O s trigonální krystalovou m í kou. P ítomnost této<br />
fáze se projevila pouze mírnou nesymetrií linií istého zirkonia<br />
(obr. 4). B hem dal ího oh evu z stalo toto slo ení zachováno<br />
a do 400 °C, kdy se na pozici p ibli n 2 = 33,93°<br />
objevila linie odpovídající nejsiln j í difrak ní linii (444) oxinitridu<br />
zirkonia ZrON s kubickou krystalovou m í kou<br />
(obr. 8).<br />
P i 500 °C je na pozici 2 = 30,02° patrná nejsiln j í<br />
linie (111) oxidu zirkonia ZrO2 s ortorombickou krystalovou<br />
m í kou (obr. 6, 7). Pi dosa ení teploty 600 °C ji za íná<br />
docházet k fázové transformaci samotného zirkonia z fáze<br />
(HCP) na fázi (BCC), co také odpovídá binárnímu diagramu<br />
soustavy Zr Nb (obr. 1). Je zde rovn patrné, e fáze -<br />
Zr z stala v oxidické povrchové vrstv zachována i p i pokojové<br />
teplot , co bude p edm tem dal ího zkoumání.<br />
V difraktogramu snímaném pi 500 °C je vid t, e<br />
v tomto stádiu dochází ji k dosti výrazné oxidaci povrchu. Je<br />
zde patrné zvy ování mno ství oxidu Zr3O a ZrO2 s ortorombickou<br />
m í kou, stejn jako oxi-nitridu zirkonia ZrON.<br />
Vzhledem k dosa ené hodnot vakua 0,2 Pa to m e být<br />
zp sobeno zbytkovým obsahem vzduchu, resp. kyslíku<br />
v komo e. P i atmosférickém tlaku je po et ástic vzduchu na<br />
- Zr (002)<br />
2 [°]<br />
Obr. 4. áste ný difraktogram slitiny p i 25 °C s prolo enými<br />
liniemi jednotlivých fází<br />
a b<br />
Obr. 5. 2D Difraktogram výchozího stavu (a) a stavu po expozici (b)<br />
Zr 3 O (113)<br />
- Zr (101)
Chem. Listy 105, s210 s213 (2011) LMV <strong>2008</strong> Regular Lectures<br />
Intenzita<br />
30 35 40 45 50 55 60 65 70<br />
2 [°]<br />
Odbrou eno<br />
Vychladnuto<br />
1000 °C<br />
900 °C<br />
850 °C<br />
800 °C<br />
700 °C<br />
600 °C<br />
500 °C<br />
Obr. 6. Difraktogramy vzorku p i vysokoteplotním oh evu a po<br />
ochlazení<br />
100000<br />
80000<br />
60000<br />
40000<br />
20000<br />
Odbrou eno<br />
Zchladnuto<br />
1000<br />
900<br />
850<br />
800<br />
700<br />
600<br />
500<br />
400<br />
300<br />
200<br />
Teplota [°C]<br />
Obr. 8. Difraktogramy experimentálního vzorku<br />
Intenzita [cts]<br />
1 cm 3 p ibli n 29 10 18 , p i námi dosa eném vakuu 0,2 Pa je<br />
to asi 37 10 12 , po et molekul kyslíku je tedy zhruba 7 10 12 .<br />
Z m ení provedených na p ístroji Bruker je patrné výrazné<br />
zhrubnutí materiálu b hem expozice. Vzorek ve výchozím<br />
stavu je tak ka ideáln jemnozrnný, s hladkými, spojitými<br />
liniemi (obr. 5a). Po expozici jsou vlivem zhrubnutí tyto linie<br />
tvo eny pouze body, p edstavujícími koherentn difraktující<br />
oblasti. Spojité linie pat í oxid m (obr. 5b).<br />
100<br />
25<br />
30<br />
35<br />
40<br />
s212<br />
Intenzita<br />
-Zr (100) -Zr (110) -Zr (101)<br />
-Zr (002)<br />
Odbrou eno<br />
Vychladnuto<br />
1000 °C<br />
900 °C<br />
850 °C<br />
800 °C<br />
700 °C<br />
600 °C<br />
28 29 30 31 32 33 34 35 36 37 38<br />
500 °C<br />
39<br />
2 [°]<br />
Obr. 7. Detail difraktogram vzorku p i vysokoteplotním oh evu<br />
a po ochlazení<br />
45<br />
50<br />
2 [°]<br />
55<br />
60<br />
65<br />
Z výsledk m ení indenta ní tvrdosti a modulu pru nosti<br />
je patrný nár st hodnot obou veli in po vysokoteplotní expozici,<br />
viz tab. II. P i d ív j ích experimentech provád ných<br />
ve spolupráci ÚJP Praha s Výzkumným centrem Nové technologie<br />
bylo prokázáno, e je tento nár st zp soben difúzí<br />
kyslíku do povrchových vrstev slitiny, kdy potom p ímo na<br />
povrchu vzniká tenká oxidická vrstva. Kyslík zárove proniká<br />
hloub ji do materiálu slitiny, kde se usazuje v intersticiálních<br />
70
Chem. Listy 105, s210 s213 (2011) LMV <strong>2008</strong> Regular Lectures<br />
polohách krystalové mí ky 6,7 . Toto bylo potvrzeno i nyní,<br />
kdy je patrný pokles tvrdosti i modulu pru nosti po odbrou ení<br />
povrchové vrstvy oxid (tab. II). Zárove je také vid t<br />
rozdíl hodnot tvrdosti a modulu pru nosti u vzorku ve výchozím<br />
stavu s povrchem brou eným a odleptaným. Je to zp sobeno<br />
vnesením plastické deformace do povrchové vrstvy<br />
b hem brou ení.<br />
4. Záv r<br />
Mechanické vlastnosti slitin zirkonia jsou rozhodující<br />
m rou ovlivn ny mno stvím kyslíku ve struktu e.<br />
Se zvy ováním obsahu kyslíku p i vysokoteplotní expozici<br />
dochází k markantnímu nár stu tvrdosti a modulu pru nosti.<br />
Zárove se ov em výrazn sni uje ta nost a hou evnatost<br />
slitin. Difrak ní fázovou analýzou in situ byl sledován jednak<br />
vznik povrchové vrstvy oxid , ale také fázové transformace<br />
zirkonia p i vysokých teplotách. Z výsledk je patrné, e p i<br />
teplotách do zhruba 400 °C k výrazné oxidaci nedo lo. Od<br />
500 °C ji byla materiálu dodána dostate ná aktiva ní energie<br />
ke vznik oxid a oxi-nitridu zirkonia. Od 600 °C je patrný<br />
po átek p em ny -fáze zirkonia na fázi , která je ukon ena<br />
p ibli n pi 850 °C, co dosti pesn odpovídá binárnímu<br />
fázovému diagramu soustavy Zr Nb. P i dal ích experimentech<br />
zam ených na studium t chto fázových pem n bude<br />
nutné zapojit do vakuové soustavy vymrazova ku, pop ípad<br />
pou ít výkonn j í typ výv vy. Vymrazova ka jednak zhruba<br />
o jeden ád zlep í sou asné vakuum 0,2 Pa, ale také zamezí<br />
zp tnému pronikání uhlíkových par z výv vy do vysokoteplotní<br />
komory. Provedené experimenty zárove ukázaly, e<br />
RTG difrakce in situ je velice ú inná metoda sledování fázových<br />
transformací, která m e být vyu ita i pro tvorbu pseudo-fázových<br />
diagram .<br />
Práce byla podpo ena výzkumným projektem MPO R 2A<br />
1TP1/037.<br />
s213<br />
LITERATURA<br />
1. Bláhová, O., utta, P., íha, J., ugár, M., Medlín, R.,<br />
Savková, J.: Zvý ení bezpe nosti jaderných elektráren p i<br />
haváriích typu LOCA, Výzkumná zpráva NTC Z U,<br />
Plze , <strong>2008</strong>.<br />
2. Koutský, J., Ko ík, J.: Radiation Damage of Structural<br />
Materials. Academia, Praha 1994.<br />
3. Arroyave, R., Kaufman, L., Eagar, T. W.: Thermodynamic<br />
Modeling of the Zr-O System, Calphad, Vol. 26, sv.<br />
1, s. 95 118, March 2002.<br />
4. Baker H. (ed.): ASM Handbook, vol. 3, Alloy Phase Diagrams,<br />
ASM International, Materials Park, Ohio 1992.<br />
5. íha J., Vincze A., utta P.: Proceedings of the 14th<br />
International Conference on Applied Physics of Condensed<br />
Matter (s. 195 198), Liptovský Ján, <strong>2008</strong>.<br />
6. Vrtílková V., Novotný L.: Vliv rozpou t ní oxidu vytvoeného<br />
na povlakové trubce ze Zr-slitin na termomechanické<br />
vlastnosti trubky po vysokoteplotních p echodech,<br />
Výzkumná zpráva UJP Praha 1164, 2005.<br />
7. Vrtílková V., Novotný L.: Vliv rozpou t ní oxidu vytvoeného<br />
na povlakové trubce ze Zr-slitin na termomechanické<br />
vlastnosti trubky po vysokoteplotních p echodech,<br />
Výzkumná zpráva UJP Praha 1165, 2006.<br />
8. Kaddour D., Frechinet S., Gourgues A. F., Brachet J. C.,<br />
Portier L., Pineau A.: Scr. Mater. 51, 515 (2004).<br />
J. íha, O. Bláhová, and P. utta (New technologies<br />
research centre, University of West Bohemia, Plze , Czech<br />
Republic): Phase Transformations of Zr-1Nb Alloy and<br />
Its Influence on Local Mechanical Properties<br />
Zirconium alloys are very important materials used in<br />
nuclear water reactors. Due to their high corrosion resistance<br />
and low capture cross section of thermal neutrons are these<br />
alloys ideal for production of protective layers of the nuclear<br />
fuel rods. This work deals with zirconium phase transformations<br />
at high temperatures and theirs influence on indentation<br />
hardness and modulus of elasticity of Zr-Nb alloy. For phase<br />
transformations observation in situ XRD analysis was used.<br />
The measurements were carried out with the aid of hightemperature<br />
chamber, in which 0.2 Pa vacuum was created.<br />
The sample was gradually heated up to 1000 °C.
Chem. Listy 105, s214 s217 (2011) LMV <strong>2008</strong> Regular Lectures<br />
SCRATCH RESISTANCE OF TiAlSiN COATINGS<br />
JARMILA SAVKOVÁ<br />
and OLGA BLÁHOVÁ<br />
Department of Material Science and Technology, University<br />
of West Bohemia, Universitní 8, 306 14 Plze , Czech Republic<br />
savkova@kmm.zcu.cz<br />
Key words: scratch test, TiAlSiN coating<br />
1. Introduction<br />
Scratch test is one of the most used methods for adhesion<br />
testing of thin coatings. In common devices a diamond indenter<br />
is pulled along the substrate surface, while the normal<br />
force on the indenter is steadily increased (Fig. 1) and the<br />
lateral force is measured. At the so called critical load (LC1,<br />
LC2, .LCN) the indenter breaks through the coating into the<br />
substrate material 1,2 . At this point the lateral force is increased<br />
and acoustic emission is observed which both can be recorded.<br />
Many different failures are observed which include<br />
coating detachment, through-thickness cracking and plastic<br />
deformation or cracking in the coating or substrate. In fact it<br />
is usual that several different failure modes occur at the same<br />
time and this can make the results of the test difficult to interpret.<br />
The failure modes observed in the scratch test depend on<br />
many factors and are most easily characterised in terms of the<br />
hardness of both substrate and coating. The failure events are<br />
detected by examination of the scratch track after scratching<br />
using an optical microscope 1 3 .<br />
With this critical load the scratch test is nearly the only<br />
method that delivers a numeric value for the adhesion of hard<br />
PVD coatings 2 5 .<br />
The normal load during the test is either kept constant or<br />
progressively increased. Progressively increasing scratch load<br />
eventually induces a critical point of damage such as coating<br />
delamination, coating cracking (in the case of brittle coatings)<br />
or whitening (in the case of polymeric coatings) in a single<br />
Fig. 1. Scratch test principe 1<br />
s214<br />
test. In the constant-load test, multiple tests at increased constant-load<br />
levels are needed in order to determine the critical<br />
scratch load. In any case, the critical load itself or its derivative<br />
(e.g. scratch hardness, defined as the load divided by<br />
indented area) is used to compare the performance of different<br />
coatings. A number of ASTM and ISO standards are available<br />
for the scratch test of coatings. ASTM C 1624 describes<br />
a standard test method for hard (Vickers hardness<br />
HV 5 GPa) ceramic coatings, while ASTM D 7027 is for<br />
the evaluation of polymeric coatings and plastics. Nanoscratch<br />
of soft coatings is described by ASTM D EN 1071<br />
standard includes a comprehensive atlas of scratch test failure<br />
modes 1,6 .<br />
Three different scratching procedures are described in<br />
the standard EN 1071-3:<br />
A. Progressive load scratch test recommended operating<br />
parameters are 100 N min 1 (loading rate) and 10 mm min 1<br />
(lateral displacement speed).<br />
B. Constant load scratch test recommended operating<br />
parameters are 10 mm min 1 (lateral speed) and 10 mm<br />
scratch length. Normal load increases in increments between<br />
successive scratches carried out under constant load at different<br />
locations on the sample surface. It is also recommended<br />
that one fifth of the critical load (determined by progressive<br />
load mode) will be used for the indenter load step size between<br />
consecutive tests.<br />
C. Multipass scratch test standard-operating parameters<br />
are the same as in B and it is recommended to use 50 % of<br />
critical load determined by progressive load mode. In this test<br />
the number of scratches until failure is determined 6 .<br />
2. Experimental procedure<br />
Coatings were produced by a multi-source PVD system,<br />
using cathodic arc-evaporation, in an industrial vacuum<br />
chamber. Cathodes were made from pure Ti and Al/Si. The<br />
TiAlSiN layers with same overall thickness of 2,5 m were<br />
deposited on substrates of tool steel from Böhler-Uddeholm,<br />
VANADIS 4 V (C 1.4 %, Cr 4.7 %, Mo 3.5 %, V 3.7 %,<br />
Si 0.4 %) and Sverker 21 S (C 1.55 %, Cr 11.8 %,<br />
Mo 0.8 %, V 0.8 %, Si 0.3 %, Mn 0.4 %). Steel samples<br />
(Ø 40 5 mm) were hardened and annealed at 550 °C, ground<br />
Table I<br />
Deposition parameters<br />
Coating Al/Si<br />
[V]<br />
Ti<br />
[V]<br />
Bias<br />
[V]<br />
Pressure<br />
[mbar]<br />
1 120 50 20 0.05<br />
2 50 120 80 0.05<br />
3 120 120 80 0.05<br />
4 nACo® LISS a.s. Ro nov p. Radho t m
Chem. Listy 105, s214 s217 (2011) LMV <strong>2008</strong> Regular Lectures<br />
and polished to mirror-like state (roughness < 0.02 m). Steel<br />
surface was cleaned by ion bombard just before deposition.<br />
TiN interlayer with a thickness of about 0.1 m were deposited<br />
between the substrate and film. The deposition parameters<br />
are listed in Tab. I.<br />
A Hommel tester T1000 waveline profilometer with<br />
diamond stylus was used for determination of roughness after<br />
deposition. A standard Rockwell hardness tester was used for<br />
evaluation of adhesion between coating and substrate. Standard<br />
test parameters were used Rockwell C type diamond<br />
cone indenter with an applied load of 1500 N.<br />
Scratch testing was carried out using the Scratch tester<br />
CSEM Revetest. ASTM D EN 1071 method A (progressive<br />
load scratch test) was used with a Rockwell C diamond indenter<br />
with radius of 200 m. The load increased from 0 to<br />
80 N at a specified loading rate. Generally a loading rate of<br />
10 N mm 1 was used for the scratch tests. Load can be measured<br />
at any place, as we know the loading rate and the length<br />
of the track. The friction force was measured and a piezoelectric<br />
accelerometer detects the acoustic emission produced as<br />
the coating is damaged. The value of the critical load is then<br />
determined using these traces in conjunction with an optical<br />
microscope. All scratches were carried out at least two times<br />
and in the same direction. Critical loads according ASTM<br />
standard, LC1 (first lateral cracking), LC2 (first severe cracking<br />
and delamination at track border), LC3 (first delamination<br />
within the scratch track) and LS (total delamination) were<br />
determined.<br />
3. Results and discussion<br />
Surface after deposition was characterized by three<br />
roughness parameters: Ra roughness average, Rt maximum<br />
height of the profile and Rz average distance between highest<br />
peek and lowest valley, Tab. II.<br />
Coatings were observed by optical microscope to characterize<br />
quality of coatings surface, Fig. 2.<br />
The adhesion from Rockwell hardness indentation test is<br />
analysed with optical microscope and classified with A<br />
Table II<br />
Roughness parameters<br />
Coating Steel a Ra<br />
[ m]<br />
Rt<br />
[ m]<br />
Rz<br />
[ m]<br />
1 S 0.06 ± 0.01 2.37 ± 0.27 1.29 ± 0.11<br />
V 0.07 ± 0.01 2.53 ± 0.65 1.48 ± 0.30<br />
2 S 0.09 ± 0.01 3.16 ± 0.35 2.10 ± 0.28<br />
V 0.09 ± 0.01 2.98 ± 0.68 2.18 ± 0.45<br />
3 S 0.10 ± 0.01 3.76 ± 0.41 2.23 ± 0.34<br />
V 0.07 ± 0.01 3.04 ± 0.62 1.78 ± 0.39<br />
4 S 0.10 ± 0.01 2.89 ± 0.41 1.76 ± 0.24<br />
V 0.10 ± 0.01 2.59 ± 0.32 1.75 ± 0.23<br />
a S Sverker 21, V Vanadis 4<br />
s215<br />
a b<br />
Fig. 2. Surface defects on coating 2 (a) and 4 (b)<br />
(adhesive failure) and K (cohesive failure) number according<br />
to the level of cracking or coating delamination around the<br />
indent, Fig. 3 (ref. 7 ). Only indents classified as A/K 1-2 correspond<br />
to acceptable adhesion.<br />
Fig. 3. Comparison chart grades of failure mechanism 7<br />
a b<br />
Fig. 4. Coating 3 (a) and 4 (b) after Rockwell test
Chem. Listy 105, s214 s217 (2011) LMV <strong>2008</strong> Regular Lectures<br />
Coatings adhesion was classified: 1 A1/K1, 2 A0/K1,<br />
3 A0/K2, 4 A2/K2, Fig. 4.<br />
The four coating types, all deposited onto hard metal<br />
substrates and of thickness 2.5 m, were tested using the Revetest<br />
with progressive loading from 0 to 80 N. The load rate<br />
was set at 10 N mm 1 and the table speed at 10 mm min 1 .<br />
Two scratches in the same direction were made on every sample<br />
and critical loads were determined from each scratch,<br />
without calculating the mean value, Tab. III. Optical microscope<br />
with image analysis (NIKON NEOPHOT 200 with<br />
LUCIA 4.81) was used to investigate the critical points along<br />
each scratch and thus determine the critical loads at which<br />
first failure (partial delamination) and total failure of the coating<br />
occurs (LS).<br />
Table III<br />
Critical loads<br />
Coating Steel a LC1<br />
[N]<br />
LC2<br />
[N]<br />
LC3<br />
[N]<br />
1 S 19.5 20.8 53.4<br />
21.4 31.7 51<br />
V 27 46 60<br />
30 50 63<br />
2 S 19.7 26.9 50.4<br />
18.5 23.2 63.8<br />
V 43.2 47.4 61.6<br />
40.7 47.3 68.6<br />
3 S 8.8 8.8 35.3<br />
10.1 10.7 41.8<br />
V 17.3 21 48.7<br />
17.9 20.4 27.3<br />
LS<br />
[N]<br />
4 S 10.5 19 31 70.6<br />
11.6 17.2 30.8 69.6<br />
V 7.6 12 35.8 64<br />
a S Sverker 21, V Vanadis 4<br />
9 21 36.7 57.1<br />
Coating 1: an adhesive failure occurs at load lower than<br />
10 N for all 4 tests due to the surface defects, Fig. 5. This<br />
failures wasn´t used for determining critical loads. Fewer<br />
defects were observed for coating on Vanadis 4 steel. Tensile<br />
Hertzian crack within the scratch track is the main failure type<br />
from load 20 N, Fig. 6.<br />
Interfacial spallation at the track border occurs about<br />
load 30 N. Discontinuous ductile perforation of the coating<br />
was when load reached 65 N, Fig. 7.<br />
Coating 2: cracking on steel Sverker 21 starts by tensile<br />
Hertzian failure mode at load cca 20 N. Few failures occur at<br />
beginning of scratch track on steel Sverker 21 because of<br />
surface defects. Coating on steel Vanadis 4 was without failures<br />
before 20 N. After increasing load up to 25 N (S) and<br />
40 N (V) deformation rises and first adhesive failure occurs<br />
s216<br />
Fig. 5. Coating 1, steel Sverker 21, load 10 N<br />
Fig. 6. Coating 1, steel Sverker 21, load 20 N<br />
Fig. 7. Coating 1, steel Sverker 21, load 80 N<br />
by spallation along the scratch track borders cohesive and<br />
interfacial, Fig. 8. Coating on Vanadis 4 has very few discontinuous<br />
ductile perforations at load 80 N.<br />
Coating 3: very similar failure on both substrates. First<br />
failures both adhesive and cohesive occur at relatively low<br />
load, 8 N for Sverker 21 and 17 N for Vanadis 4. Coatings<br />
were practically without perforation within scratch track,<br />
Fig. 9.<br />
Coating 4: similar failure as for coating 3 with larger<br />
adhesive failure along scratch border, Fig. 11. Load 60 N<br />
caused complete uncovering of the substrate. Critical loads<br />
for Sverker 21 are lower than that for Vanadis 4. Discontinuous<br />
ductile perforation starts from LC1 for all four scratches,<br />
Fig. 10. Cracks are with long area interfacial spallation.
Chem. Listy 105, s214 s217 (2011) LMV <strong>2008</strong> Regular Lectures<br />
Fig. 8. Coating 2, steel Sverker 21, load 25 N<br />
Fig. 9. Coating 3, steel Vanadis 4, load 58 N<br />
Fig. 10. Coating 4, steel Vanadis 4, load 10 N<br />
Fig. 11. Coating 4, steel Vanadis 4, load 60 N<br />
s217<br />
4. Conclusions<br />
The coatings on Vanadis 4 steel have generally better<br />
adhesion than coatings deposited on Sverker 21. For coatings<br />
on Sverker 21 first failure occurs at load 10 N (coatings 3 and<br />
4) or 20 N (coatings 1 and 2).<br />
Lowest adhesion and lowest critical loads were observed<br />
for coating with highest surface roughness coating 4 on both<br />
steels and coating 3 on Sverker 21.<br />
For coating 4 (both steels) loads higher than 50 N caused<br />
complete delamination.<br />
Failure at beginning occurs for all scratches because of<br />
higher roughness and surface defects, Fig. 2b. This failures<br />
wasn´t used for determination of critical loads.<br />
Best adhesions have coatings 1 and 2, first uncovering of<br />
substrate occurs at load higher than 50 N.<br />
This work was supported by Kontakt-AIP No. MEB 080869.<br />
REFERENCES<br />
1. www.csm-instruments.com. downloaded 28 th October<br />
<strong>2008</strong>.<br />
2. Chen Z., Wu L. Y. L., Chwa E., Tham O.: Mater. Sci.<br />
Eng., A 493, 292 (<strong>2008</strong>).<br />
3. http://www.irg-woem.org/pdfs/13.pdf. downloaded 28 th<br />
October <strong>2008</strong>.<br />
4. Hoy R., Kamminga J. D., Janssen G. C. A. M.: Surf.<br />
Coat. Technol. 200, 3856 (2006).<br />
5. Beegan D., Chowdhury S., Laugier M. T.: Surf. Coat.<br />
Technol. 20, 5804 (<strong>2007</strong>).<br />
6. EN 1071-3: Advanced technical ceramics Method of<br />
test ceramic coatings Part 3: Determination of adhesion<br />
and other mechanic failures modes by a scratch test.<br />
7. www.ateam.cz. downloaded 28 th October <strong>2008</strong>.<br />
J. Savková and O. Bláhová (Department of Material<br />
Science and Technology, University of West Bohemia, Plze ,<br />
Czech Republic): Scratch Resistance of TiAlSiN Coatings<br />
Hard coatings are applied to the surfaces of mechanical<br />
components subjected to wear in order to increase their durability<br />
and performance. One main application is hard coatings<br />
for cutting tools such as drills, end mills and indexable cutting<br />
inserts. Superhard nanocomposite coatings comprise two or<br />
more phases that are either a nanostructured phase embedded<br />
in another amorphous phase, such as nanocrystalline (nc-)<br />
TiN and amorphous (a-)Si3N4 (nc-TiN/a-Si3N4), or two<br />
nanocrystalline phases such as nc-TiN/BN. One of the most<br />
important characterizations of coating-substrate system is<br />
adhesion. Scratch test is one of the most used methods for<br />
adhesion testing. In our paper adhesive properties of four<br />
TiAlSiN coatings were characterized, one commercially used<br />
and three laboratory coatings.
Chem. Listy 105, s218 s222 (2011) LMV <strong>2008</strong> Regular Lectures<br />
INDENTATION LOAD/SIZE EFFECT OF STRUCTURAL CERAMIC MATERIALS<br />
JANA PAKOVÁ, FRANTI KA<br />
DOR ÁKOVÁ, and JÁN DUSZA<br />
Institute of Materials Research SAS, Watsonova 47, 040 01<br />
Ko ice, Slovakia<br />
jspakova@imr.saske.sk, fdorcakova@imr.saske.sk,<br />
jdusza@imr.saske.sk<br />
1. Introduction<br />
Indentation tests like hardness measurement are perhaps<br />
the most commonly applied methods for measuring the mechanical<br />
properties of materials. The utility of hardness is<br />
further enhanced by the fact that it is obtained by a simple test<br />
that can be rapidly performed using small samples at moderate<br />
cost. However, this utility is partly compromised by the<br />
often complex and variable dependence of hardness on several<br />
factors such as surface finish, microstructure, indenter<br />
load and configuration. Hardness is conventionally determined<br />
by applying a load to a material via a geometrically<br />
defined indenter, and defined as the ratio of the applied load<br />
P to the contact area, A , of the resultant indent<br />
P P<br />
H = =<br />
2<br />
A d<br />
where d is the characteristic size of resultant indent and<br />
is a constant which depends only on the indenter geometry.<br />
Two major indenter geometries, Vickers and Knoop, are<br />
widely used for hardness testing of structural ceramics. In<br />
general, the Vickers hardness HV is calculated using the<br />
contact area of the indent and the parameter d in Eq. (1) is<br />
defined as the average of the two diagonals of the square<br />
shaped indent which results in a -value of 1.8544. In the case<br />
of Knoop hardness, the parameter d is defined as the length<br />
of the long diagonal of the resultant rhombic impression and<br />
has a value of 14.229. Moreover investigations have confirmed<br />
that the apparent hardness of a given ceramic material<br />
is a function of the applied test load, and the measured hardness<br />
increases with decreasing test load. To explain this so<br />
called indentation load/size effect ISE intensive research<br />
has been performed during the last decade and several theories<br />
have been occurred for explanation of this. The most<br />
common explanation concerns the experimental errors resulting<br />
from the limitations of the resolution of the objective lens<br />
and the sensitivity of the load cells 1 3 . According to Bückle 2<br />
the ISE is directly related to the intrinsic structural factors of<br />
the test materials, including indentation elastic recovery, work<br />
hardening during indentation, surface dislocation pinning,<br />
etc. 4 6 . It was found that dislocation and twin activities may<br />
results in ISE in alumina ceramics with different grain size,<br />
too. Another explanation of ISE is the formation of cracks 7 ,<br />
small ratios of grain size to the indentation size 8 . Conse-<br />
(1)<br />
s218<br />
quently, several empirical or semi-empirical equations, including<br />
the Mayer`s law 5,9 , the Hays-Kendall approach 10 , the<br />
elastic recovery model 4 , the energy-balance approach 11 , the<br />
proportional specimen resistance (PSR) model 12 , etc. were<br />
proposed for describing the variation of the indentation size<br />
with the applied test indentation load. Except of the Mayer`s<br />
law, all other approaches involve the determination of a socalled<br />
true-hardness, i.e., a load-independent hardness number.<br />
It should be mentioned that Hays-Kendall approach frequently<br />
gives unrealistic values of load necessary to induce<br />
plastic deformation 12 , energy-balance approach is essentially<br />
a modified form of the empirical Mayer`s law, while the elastic<br />
recovery model applies only to plastic materials where slip<br />
bands with a particular spacing d0 between them are produced<br />
by indentation. Therefore Hays-Kendall approach and elastic<br />
recovery model are not considered here. The most widely<br />
used empirical equation for describing the ISE is the Mayer`s<br />
law, which gives an expression relating load and size of indentation,<br />
n<br />
P = A . d<br />
where the exponent n , i.e. Mayer`s index, is a measure of<br />
the ISE, and A is a constant. Parameters n and A can be<br />
derived directly from the curve fitting of the experimental<br />
data. When n < 2 there is ISE behaviour and when n = 2, the<br />
hardness is independent of applied load. On the other hand,<br />
ISE behaviour may be described by the PSR model 12 . In this<br />
model, the test specimen resistance to permanent deformation<br />
is assumed not to be a constant, but to increase linearly,<br />
and is the directly proportional.<br />
W = a d<br />
1<br />
To a first approximation, the form of Eq. (3) can be considered<br />
to be similar to the elastic resistance of a spring with<br />
the opposite sign to the applied test load. Then, the effective<br />
indentation load and the indentation dimension can be related<br />
as:<br />
P = P -W = P -a d = a d<br />
max max 1 2<br />
eff<br />
Eq. (4) means that the proportional specimen resistance<br />
(PSR) described by the a1 -value and the second coefficient<br />
a2 can be readily evaluated through the linear regresion of<br />
P/d versus d . Thus the applicability of the PSR model to<br />
describe the observed ISE in a relatively wider range of applied<br />
test load can be examined by testing the linearity between<br />
P/d and d . Eq. (4) can be rearranged as:<br />
P = a + a . d<br />
1 2<br />
d<br />
2<br />
(2)<br />
(3)<br />
(4)<br />
(5)
Chem. Listy 105, s218 s222 (2011) LMV <strong>2008</strong> Regular Lectures<br />
which enables us to calculate a1 and a2 from the plots of<br />
P/d against d . According to the Li and Bradt 12 , the parameters<br />
a1 and a2 can be related to the elastic and the<br />
plastic properties of the test material, respectively. Especially,<br />
a2 was suggested to be a measure of the so-called true hardness,<br />
i.e., load-independed hardness H0 (H0(V)-true Vickers<br />
hardness, H0(K)-true Knoop hardness)<br />
H = 1,8544 . a 2<br />
0(V)<br />
There have been several studies 13,14 concerning the applicability<br />
of the PSR model to describing the ISE of brittle materials.<br />
2. Experimental materials and methods<br />
Three monolithic Al2O3, Si3N4, Si3N4-SiC nanocomposites<br />
and ceramic-metal composite WC-Co have been investigated.<br />
The monolithic Si3N4 was pressure sintered with addition<br />
of 3 wt.% Y2O3 and 3 wt.% Al2O3 by CeramTech<br />
(Plochingen, Germany). This monolithic Si3N4 is a reference<br />
material for European research program ESIS (European<br />
Structural Integrity Society) for evaluation of mechanical and<br />
physical properties. Pure Al2O3 was cold isostatic pressed at<br />
150 MPa and sintered at 1600 °C for 1 h in Faensa (Italy).<br />
Si3N4-SiC nanocomposite was prepared by carbothermal reduction<br />
from the starting mixture 83.12 wt.% Si3N4,<br />
4.43 wt.% Y2O3, 7.39 wt.% SiO, 4.05 wt.% C in Bratislava<br />
(Slovakia). The samples were hot-pressed under a specific<br />
heating regime, atmosphere and mechanical pressure at<br />
1750 °C for 2 h. The WC-Co specimens were prepared using<br />
standard preparation technique in umperk (Czech Republic).<br />
The surface of specimens was ground and polished to<br />
1 m finish before the mechanical tests. Macrohardness has<br />
been measured in a wide range of applied loads from 50 N to<br />
200 N using the testing device HPO 250 for both Vickers and<br />
Knoop indenter geometries, and dwell time of 10 seconds.<br />
The average values for macrohardness were calculated from<br />
10 measurements. For measuring microhardness by Vickers<br />
indenter in load range from 2 N to 10 N a microhardness<br />
tester LECO LM 700AT was used. For estimating microhardness<br />
by Knoop indenter in the same load range a Zwick/<br />
materialprüfung grün Systemtechnik Wetzlar was used and<br />
dwell time of 10 seconds. The average values for microhardness<br />
were calculated from 20 measurements.<br />
3. Results and discussion<br />
The present data and Mayer`s law<br />
H = 14,229 . a 2<br />
0(K)<br />
Table I summarizes the Mayer`s law parameters determined<br />
by the regression analyses of the results shown in<br />
Fig. 1.<br />
The analysis of results listed in Tab. I indicates that,<br />
among all test materials, the most significant ISE for Vickers<br />
microhardness was observed in Si3N4-SiC nanocomposite<br />
(n = 1.897) while the ISE in WC-Co (1.922) is negligible. In<br />
the case of Knoop microhardness the most significant ISE<br />
was observed for Al2O3 (n = 1.746) while the ISE in Si3N4<br />
(6)<br />
s219<br />
a<br />
b<br />
ln P [N]<br />
ln P [N]<br />
2,5<br />
2,3<br />
2,1<br />
1,9<br />
1,7<br />
1,5<br />
1,3<br />
1,1<br />
0,9<br />
0,7<br />
0,5<br />
2,5<br />
2,3<br />
2,1<br />
1,9<br />
1,7<br />
1,5<br />
1,3<br />
1,1<br />
0,9<br />
0,7<br />
0,5<br />
Al2O3<br />
Si3N4<br />
Si3N4 Nanocomp. Si3N4-SiC<br />
nanokomp. WC-Co Si3N4 - SiC<br />
WC-Co<br />
2,5 2,7 2,9 3,1 3,3 3,5 3,7<br />
ln d [ m]<br />
Al2O3<br />
Si3N4<br />
Si3N4 Nanocomp. Si3N4-SiC<br />
nanocomp. WC-Co Si3N4-SiC<br />
WC-Co<br />
3,4 3,6 3,8 4 4,2 4,4 4,6 4,8<br />
ln d [ m]<br />
Fig. 1. Dependency of ln P on ln d according to the Mayer`s law<br />
for tested materials from a)Vickers hardness b) Knoop hardness<br />
Table I<br />
Regression analysis results of the experimental data according to<br />
Mayer`s law for Vickers hardness (a) and Knoop hardness (b)<br />
a) Vickers hardness<br />
Material n A R 2<br />
Si3N4 1.922 4.45 0.9994<br />
nanocomp. Si3N4 - SiC 1.897 4.21 0.9985<br />
Al2O3 1.898 4.25 0.9983<br />
WC-Co 1.922 4.69 0.9999<br />
b) Knoop hardness<br />
Material n A R 2<br />
Si3N4 1.908 6.35 0.9995<br />
nanocomp. Si3N4 - SiC 1.749 5.76 0.9996<br />
Al2O3 1.746 5.63 0.9986<br />
WC-Co 1.761 5.92 0.9271<br />
(n = 1.908) is negligible.<br />
It can be seen that the ISE for the Knoop microhardness<br />
may be slightly greater than the ISE for the Vickers indentation<br />
microhardness. Due to the nature of intrinsic brittleness,<br />
Vickers indentation may result in microfracture around the
Chem. Listy 105, s218 s222 (2011) LMV <strong>2008</strong> Regular Lectures<br />
a<br />
b<br />
Fig. 2. Formation of indentation radial cracks in Si 3N4 at 10 N by<br />
Vickers indenter (a) detail of indentation radial crack<br />
impression in the surface and/or subsurface of ceramics when<br />
the load is high enough 15 . Since microfracture occurs mainly<br />
during the loading, a portion of energy, which is used to<br />
create the indentation deformation will be dissipated by the<br />
crack formation shown in Fig. 2.<br />
Thus, one can expect that, for a given material, the hardness<br />
value measured with a cracking indentation will be<br />
higher than that measured with a crack-free indentation at the<br />
same load 16 . It seems to be imposible to avoid the effect of<br />
microstructure on the hardness measurements in low-load<br />
range, in which the ISE is significant, for microcracking can<br />
occur in most ceramics even at loads lower than 50 N. On the<br />
other hand, when tested below such a low load, the experimental<br />
errors related to the small size of the indentation will<br />
be significant, sometimes making it impossible to conduct<br />
repeatable measurements.<br />
Sargent and Page 17 considered several n value versus ln<br />
A relationships in an attempt to ascertain any possible microstructural<br />
effects on those power law parameters. The knowledge<br />
of the correlation between n and A seems to be of<br />
little significance for understanding the ISE, because Gong et<br />
al. 18 found that the best-fit value of the Mayer`s law coefficient<br />
depends on the units system used for recording the experimental<br />
data and completely different trends of n versus<br />
A may be observed in different units systems. Previous<br />
studies 19,20 also tried to relate Mayer`s index n to the microstructural<br />
features. However, knowledge of the generality of<br />
the correlation between n and grain size is still lacking. In<br />
fact, previous studies 16, 21 have pointed out that as pure empirical<br />
equation, Mayer`s law cannot provide any knowledge<br />
of the origin of ISE.<br />
s220<br />
Proportional specimen resistance PSR model<br />
Fig. 3 shows the P/d curves for the tested materials (afrom<br />
HV, b-from HK). The best-fit values of the parameters<br />
included in Fig. 3 for each material are listed in Tab. II.<br />
Table II<br />
The best-fit results of the PSR model parameters for Vickers<br />
hardness (a) and Knoop hardness (b)<br />
P/d [N/ m]<br />
P/d [N/mm]<br />
a) Vickers hardness<br />
Material a1 a2 HV0 [GPa] R 2<br />
b) Knoop hardness<br />
Material a1 a2 HK0 [GPa] R 2<br />
Si3N4 0.0062 0.0011 15.65 0.9991<br />
nanocomp.<br />
Si3N4 - SiC<br />
Si3N4 0.0136 0.0086 15.95 0.9986<br />
nanocomp.<br />
Si3N4 - SiC<br />
0,35<br />
0,3<br />
0,25<br />
0,2<br />
0,15<br />
0,1<br />
Si3N4 Si3N4<br />
Al2O3<br />
Al2O3 Nanocomp. Si3N4-SiC<br />
nanokomp. WC-Co Si3N4-SiC<br />
WC-Co<br />
0,05<br />
10 15 20 25 30 35 40<br />
0,12<br />
0,11<br />
0,1<br />
0,09<br />
0,08<br />
0,07<br />
0,06<br />
0,05<br />
0,04<br />
Si3N4 Si3N4<br />
Al2O3<br />
Nanocomp. Si3N4-SiC<br />
nanocomp. WC-Co Si3N4-SiC<br />
WC-Co<br />
0.0182 0.01 18.54 0.9942<br />
Al2O3 0.0177 0.0096 17.80 0.9965<br />
WC - Co 0.013 0.0066 12.24 0.9999<br />
0.0186 0.0008 11.38 0.9969<br />
Al2O3 0.0187 0.0009 12.81 0.9965<br />
WC - Co 0.0218 0.0006 8.54 0.9823<br />
d [ m]<br />
30 50 70 90 110<br />
d [ m]<br />
Fig. 3. Dependency of P/d on d according to the PSR model for<br />
tested materials from a)Vickers hardness b) Knoop hardness
Chem. Listy 105, s218 s222 (2011) LMV <strong>2008</strong> Regular Lectures<br />
Dependency of P/d on d of WC-Co from Knoop<br />
hardness reveals unlinearity. Different behaviour of WC-Co<br />
can be explained by the presence of ductile binder phase Co<br />
and the significantly lower elastic recovery. The evaluate the<br />
applicability of the PSR model in analyzing the ISE, true<br />
hardeness was calculated for each material. The results are<br />
given in Tab. II, too. As can be seen from Tab. II, it can be<br />
concluded, that PSR model may provide a satisfactory explanation<br />
for the origin of ISE in microhardness test for various<br />
materials. Similar conclusion has been obtained by Li et al. 12 .<br />
PSR model describes two distinctive regimes of hardness, the<br />
indentation load-dependent regime, or ISE regime and the<br />
indentation load-independent regime, and Eq. (2) is suggested<br />
to be valid in the ISE regime 22 .<br />
On the other hand, several authors 21,23 concluded that<br />
using the PSR model for ceramics in relatively wide range of<br />
applied load can produce several inconsistencies. Experimental<br />
results of Gong et al. 24 show that at least in some situations,<br />
the P/d-d linear relationship can be observed only in<br />
a narrow range of applied load. Recently, Sangwal et al. 25 and<br />
Sahin et al. 26 found that behaviour of P/d against d exhibits<br />
two different slopes. The transitions suggests that the phenomenon<br />
of the appearance of discontinuities in the conventional<br />
P(d) plots for single crystalline samples is connected<br />
with the characteristics such as defect structures and grain<br />
sizes of the samples. Sangwal et al. 27 described that this transition<br />
is associated with the processes of relaxation of indentation<br />
stresses. Several differences are evident in Tab. II. The<br />
slope of the line for the Vickers microhardness is greater than<br />
the slope for the Knoop microhardness results. This indicates<br />
that the load independent Vickers microhardness for all tested<br />
materials is greater than the Knoop values. The values of a1<br />
are also different. This suggests that ISE for the Vickers microhardness<br />
may be greater than that for Knoop microhardness.<br />
These results are contrary to the ISE prediction from the<br />
n-values of the previous Mayer`s law analysis. Similar conclusion<br />
has been obtained by Li et al. 28 . This is because the<br />
Knoop indentation is shallower and has a larger ratio of indentation<br />
surface area to the displaced area volume than Vickers<br />
indentation. Knoop indentations exhibit much less cracking<br />
than Vickers indentation at the same load. Any possible<br />
constant hardness threshold due to change in cracking scale<br />
may be suppresssed until much higher loads, and in any case,<br />
any not even be noticeable 29 . Knoop hardness gradually<br />
reaches constant values at very high loads and the Knoop<br />
plateau is usually lower than the Vickers plateau values 16 .<br />
Thibault and Lyinquist 30 noted that the onset of serious cracking<br />
led to a decrease in the apparent Knoop hardness. This<br />
may have been due in part to displacement of the indentation<br />
tips or sides, or Swain and Wittling 31 have recently argued,<br />
the crack opening displacement under the Knoop indentation<br />
leading to greater indenter penetration. Another reason is that<br />
PSR model has been attributed to the elastic properties of the<br />
specimens and also to the friction between the indenter facets<br />
and the specimen.<br />
4. Conclusions<br />
Independent Knoop and Vickers indentation hardness<br />
data of the monolithic Al2O3, Si3N4, Si3N4-SiC nanocomposite<br />
s221<br />
and hardmetal WC-Co have been presented and analyzed by<br />
the Mayer`s law and also by application of a proportional<br />
specimen resistance (PSR) model. Differences and similarities<br />
between the Vickers and Knoop indentation hardness have<br />
been observed and discussed.<br />
1. In the test load range, from 2 to 10 N, all the tested materials<br />
exhibit a significant indentation load/size effect.<br />
2. Mayer`s law was proved to be sufficient for the description<br />
of experimental data. However, no useful knowledge<br />
of the origin of the observed ISE may be provided<br />
based on this empirical data.<br />
3. The PSR model can be used to analyze the ISE observed<br />
in all of tested materials. The PSR model is recommended<br />
for determination of load-independent or true<br />
hardness.<br />
4. According to PSR model, true Knoop hardness, in comparison<br />
with true Vickers hardness exhibits lower value<br />
due to cracking. Knoop indentations exhibit much less<br />
cracking than Vickers indentation at the same load.<br />
The paper was supported by NANOSMART, Centre of Excellence,<br />
SAS, by the Slovak Grant Agency for Science, grant No.<br />
2/7914/2, APVV-0171-06.<br />
REFERENCES<br />
1. Brown A. R. G., Ineson E.: J. Iron Steel Institute 169,<br />
376 (1951)<br />
2. Bückle I. H.: Metall. Rev. 4, 49 (1959).<br />
3. Mason W., Johnson P. F., Varner J. R.: J. Mater. Sci. 26,<br />
6576 (1991).<br />
4. Tarkanian M. L., Neumann J. P., Raymond L., in: The<br />
Science of Harndness Testing and Its Research Applications,<br />
(J. H. Westbrook, H. Conrad, ed.). p. 187. American<br />
Society for Metals, Metal Park, OH 1973.<br />
5. Mott B. W.: Microindentation Hardness Testing. Butherworths,<br />
London 1956.<br />
6. O`Neil H.: The Hardness of Metals and Its Measurement.<br />
Sherwood, Cleveland 1934.<br />
7. Li H., Bradt R. C.: J. Mat. Sci. 31, 1065 (1996).<br />
8. Elmustafa A. A., Eastman J. A., Rittner M. N., Weertman<br />
J. R., Stone D. S.: Scr. Mater. 43, 951 (2000).<br />
9. Tabor D.: The Hardness of Metals. Oxford University<br />
Press, Oxford 1951.<br />
10. Hays C., Kendall E. G.: Metall. 6, 275 (1973).<br />
11. Quinn J. B., Quin G. D.: J. Mater. Sci. 32, 4331 (1997).<br />
12. Li H., Bradt R. C.: J. Mater. Sci. 28, 917 (1993).<br />
13. Quinn G. D., Green P., Xu K.: J. Am. Ceram. Soc. 86,<br />
441 (2003).<br />
14. Kim H., Kim T.: J. Europ. Ceram. Soc. 22, 1437 (2002).<br />
15. Lawn B. R., Wilshaw T. R.: J. Mater. Sci. 10, 1049<br />
(1975).<br />
16. Li Z., Ghosh A., Kobyashi A. S., Bradt R. C.: J. Am.<br />
Ceram. Soc. 72, 904 (1989).<br />
17. Sargent P. M., Page T. F.: Proc. Brit. Ceram. Soc. 26,<br />
209 (1978).<br />
18. Gong J. H., Zhao Z., Guan Z. D., Miao H. Z.: J. Eur.<br />
Ceram. Soc. 2000, 1895.<br />
19. Babini G. N., Bellosi A., Galassi C.: J. Mater. Sci. 22,<br />
1687 (1987).<br />
20. Gong J. H., Miao H. Z., Guan Z. D.: Mater. Sci. Eng., A
Chem. Listy 105, s218 s222 (2011) LMV <strong>2008</strong> Regular Lectures<br />
303, 179 (2001).<br />
21. Gong J., Wu J., Guan Z.: J. Eur. Ceram. Soc. 19, 2625<br />
(1999).<br />
22. Li H., Han Y. H., Bradt R. C.: J. Mater. Sci. 29, 5641<br />
(1994).<br />
23. Peng Z., Gong J., Miao H.: J. Eur. Ceram. Soc. 24, 2193<br />
(2004).<br />
24. Gong J., Wu J., Guan Z.: J. Eur. Ceram. Soc. 19, 2625<br />
(1999).<br />
25. Sangwal K., Surowska B., Blaziak P.: Mater. Chem.<br />
Phys. 80, 428 (2003).<br />
26. Sahin O., Uzun O., Kolemen U., Duzgun B., Ucar N.:<br />
Chin. Phys. Lett. 22, 3137 (2005).<br />
27. Sangwal K., Surowska B., Blaziak P.: Mater. Chem.<br />
Phys. 77, 511 (2003).<br />
28. Li H., Bradt R. C.: J. Mater. Sci. 28, 917 (1993).<br />
29. Quinn J. B., Quin G. D.: J. Mater. Sci. 32, 4331 (1997).<br />
30. Thibault N. W., Lynquist H. L.: Trans. ASM 38, 271<br />
(1947).<br />
31. Swain M., Wittling M.: Fracture Mechanics of Ceramics,<br />
11, (Bradt R. C., Hasselman D. P. H., Munz D., Sakai<br />
M., Schevchenko, ed.). Plenum, NY 1996.<br />
s222<br />
J. paková, F. Dor áková, and J. Dusza (Institute of<br />
Materials Research SAS, Watsonova 47, 040 01 Ko ice, Slovakia):<br />
Indentation Load/Size Effect of Structural Ceramic<br />
Materials<br />
The Vickers and Knoop hardness of monolithic Al2O3,<br />
Si3N4, Si3N4-SiC nanocomposites and a ceramic-metal composite<br />
WC-Co in the load range from 2 N to 200 N have been<br />
investigated. The experimental results revealed that for each<br />
material the Vickers and Knoop hardnes in the load range<br />
from 2 N to 10 N exhibits a load dependence, i. e. indentation<br />
load/size effect (ISE). ISE was analyzed using the Mayer`s<br />
law and the Proportional Specimen Resistance (PSR) model.<br />
Analysis based on Mayer`s law can not provide any useful<br />
information about the cause of the observed ISE, while true<br />
hardness H0, which is load independent, can be deduced from<br />
the PSR model. According to PSR model, true Knoop hardness,<br />
in comparison with true Vickers hardness exhibits lower<br />
value due to cracking. The aim of this contribution is to describe<br />
indentation load/size effect at Vickers and Knoop hardness<br />
test of structural ceramics using the Mayer`s law and the<br />
Proportional Specimen Resistance (PSR) model.
Chem. Listy 105, s223 s226 (2011) LMV <strong>2008</strong> Regular Lectures<br />
VPLYV FOSFORU NA LOKÁLNE MECHANICKÉ VLASTNOSTI<br />
A VÝVOJ TRUKTÚRY IF OCELÍ<br />
PETER ZIMOV ÁK a , ONDREJ<br />
MILKOVI b , PAVOL ZUBKO b<br />
a MAREK VOJTKO b<br />
a U. S. Steel Ko ice, s.r.o, Vstupný areál U. S. Steel, 044 54<br />
Ko ice, b Katedra náuky o materiáloch, HF <strong>TUKE</strong>, Park Komenského<br />
11, 043 85 Ko ice, Slovenská republika<br />
pzimovcak@sk.uss.com, ondrej.milkovic@tuke.sk, pavol.zubko@tuke.sk,<br />
marek.vojtko@tuke.sk<br />
K ú ové slová: IF oce , precipitácia, segregácia<br />
1. Úvod<br />
Ocele bez interstícií (IF ocele) predstavujú jednu<br />
z hlavných skupín ocelí aplikovaných v automobilovom priemysle.<br />
Tieto ocele vykazujú vysokú mieru tvárnite nosti,<br />
ktorá je zabezpe ená vyviazaním interstícií (uhlíka a dusíka)<br />
z tuhého roztoku do disperzných astíc pomocou titánu<br />
a nióbu. S oh adom na svetový trend zni ovania emisií sú<br />
výrobcovia automobilov nútení do výroby ah ích komponentov<br />
s vy ou pevnos ou, ktoré zabezpe ia zní enie hmotnosti<br />
automobilu a tým aj celkovú spotrebu paliva. Preto, jednou<br />
z mo ností zvy ovania pevnosti IF ocelí je vyu itie legúr,<br />
ktoré zabezpe ujú spev ovanie mechanizmom tvorby substitu<br />
ného tuhého roztoku 1 3 .<br />
V tejto práci sú skúmané IF ocele, do ktorých boli pridané<br />
rôzne mno stvá fosforu a mangánu. Práve fosfor patrí medzi<br />
prvky, ktoré výrazne zvy ujú pevnostné vlastnosti roztoku,<br />
pri om z cenového poh adu je taktie najefektívnej í. Na<br />
druhej strane je známy nepriaznivý vplyv fosforu na krehkos<br />
ocelí, ktorá je spôsobená segregáciou fosfou na hraniciach<br />
z n. Tento efekt má za následok náchylnos plechov na interkry<br />
talický lom po as sekundárnych lisovacích operácií<br />
s hlbokým ahom alebo po as prevádzky. Preto na zvý enie<br />
pevností IF pri zachovaní plastických vlastností ocelí je najvhodnej<br />
ie nájs optimálny pomer legujúcich prvkov 2,4,5 .<br />
2. Experimentálny materiál a metodika<br />
Pre experimenty boli pripravené tri druhy ocelí v prevádzkovom<br />
toku zlo eného z valcovania za tepla, valcovania<br />
Tabu ka I<br />
Parametre procesu výroby ocelí<br />
Valcovanie<br />
za tepla<br />
[°C]<br />
Teplota<br />
zvinovania<br />
[°C]<br />
Úber<br />
za studena<br />
[%]<br />
Teplota<br />
íhania<br />
[°C]<br />
940 640 74 600 900<br />
s223<br />
Tabu ka II<br />
Chemické zlo enie ocelí<br />
Oce Obsah [hm. ppm]<br />
C Mn Si P S Ti Nb N<br />
10 50 6640 100 1020 50 330 410 50<br />
11 41 5340 100 660 60 300 390 64<br />
12 51 2730 110 500 51 360 380 42<br />
za studena a laboratórného íhania na zariadení Hot Dip Process<br />
Simulator. Teplotné priebehy a parametre valcovania<br />
jednotlivých operácií sú zaznamenané v tabu ke I. Chemické<br />
zlo enie skúmaných ocelí a ich ozna enie je uvedené<br />
v tabu ke II.<br />
Analýza disperných fáz v oceliach bola tudovaná pomocou<br />
metodiky extrak ných replík v transmisnom elektrónovom<br />
mikroskope JEOL JEM 2000 FX s pou itím EDX analyzátora<br />
Link 860. Vzorky boli mechanicky brúsené a le tené.<br />
Výbrusy boli elektrolyticky leptané v elektrolyte HClO4 +<br />
CH3CH2OH (v pomere 1 : 10) pri kon tantnom napätí 15 V.<br />
Na naleptaný povrch bola naparená uhlíková vrstva, ktorá<br />
bola následné odleptaná z povrchu v rovnakom elektrolyte.<br />
Lomové plochy vzoriek, ako aj analýza metolagrafických<br />
výbrusov boli pozorované v rastrovacom elektrónovom<br />
mikroskope JEOL JSM 7000 F s pou itím EDX analyzátora<br />
firmy Oxford Instruments.<br />
Mikrotvrdos HV 0,01 bola meraná na metalografických<br />
výbrusoch chemicky le tených v roztoku (100 g l 1 ) kyselina<br />
avelová, H2O2 a H2O v pomere 7:1:20, prístrojom Hanemann.<br />
3. Výsledky a diskusia<br />
Pre stanovenie vhodnej teploty íhania IF ocelí<br />
v prevádzkových podmienkách boli vykonané experimentálne<br />
íhania, z ktorých bol vypo ítaný podiel rekry talizovaných<br />
z n (obr. 1) pod a vzorca:<br />
Xv<br />
R<br />
0<br />
p0,<br />
2<br />
R<br />
0<br />
p0,<br />
2<br />
p0,<br />
2<br />
p0,<br />
2<br />
. 100<br />
kde Rp0,20 hodnota medze klzu nepre íhaneho materiálu,<br />
Rp0,21 hodnota medze klzu 100 % pre íhaneho materiálu,<br />
Rp0,2X hodnota medze klzu X % pre íhaného materiálu<br />
Z kinetiky rekry talizácie bola stanovená teplota íhania<br />
na 850 °C, pri ktorej do lo k úplnej rekry talizácii ocelí.<br />
Mechanické vlastnosti ocelí (obr. 2) po kontinuálnom<br />
íhaní pri teplote 850 °C boli hodnotené zo statickej skú ky<br />
v ahu. Namerané hodnoty poukázali, e s rastúcim obsahom<br />
fosforu a mangánu v oceliach rastie medza klzu o 80 MPa<br />
a taktie medza pevnosti o 30 MPa, pri om a nos materiálu<br />
sa takmer nemení a kolí e pri hodnote 34 %.<br />
R<br />
R<br />
X<br />
1
Chem. Listy 105, s223 s226 (2011) LMV <strong>2008</strong> Regular Lectures<br />
Obr. 1. Závislos podielu rekry talizovaných z n v oceliach od<br />
zvolenej teploty íhania<br />
Obr. 2. Mechanické vlastnosti skúmaných IF ocelí v závislosti od<br />
obsahu fosforu v oceliach<br />
Vzh adom na pozitívny vplyv fosforu a mangánu na<br />
zvý enie pevnostných vlastností popri zachovaní a nosti boli<br />
ocele podrobené TEM analýze disperzných fáz. Vo v etkých<br />
oceliach boli nájdené astice TiN, MnS, NbC, TiC, (Ti+Nb)C<br />
a astice na báze Ti a S, ktoré sú zdokumentované na obr. 3.<br />
(Bli ia charakterizácia astíc bola zdokumentovaná v práci 6 .)<br />
Výskyt jednotlivých typov astíc odpovedal obsahu prítomnosti<br />
mangánu v oceliach, pri om najvy í po et MnS astíc<br />
bol v oceli 11, s ím súvisí aj najvy í podiel síry v tejto oceli.<br />
Výskyt astíc na báze Ti a S klesal so zvy ujúcim sa obsahom<br />
Mn v oceliach. Napriek vysokému obsahu fosoru neboli astice<br />
typu FeTiP a Fe(Ti+Nb)P v oceliach identifikované. Neprítomnos<br />
fosfidických astíc mô e by pripísaná vysokej teplote<br />
íhania, pri ktorej nedochádza k ich precipitácii, resp. pri<br />
teplote íhania 850 °C je rozpustnos fosforu v tuhom roztoku<br />
vy ia ako koncentrácia, ktorú obsahovali skúmané ocele.<br />
Podobnú skuto nos precipitácie fosfidických astíc v IF<br />
oceliach potvrdili autori prác 5,7 , ktorí identifikovali vyprecipitované<br />
fosfidické astice hlavne v blízkosti oblasti hraníc z n<br />
v oceliach íhaných pri teplote 700 °C. Av ak po íhaní pri<br />
s224<br />
800 °C ocele neobsahovali fosfidické astice 2 .<br />
Z dôvodu absencie fosfidických astíc vo v etkých skúmaných<br />
oceliach a taktie z dôvodu, e fosfor patrí medzi<br />
povrchovo aktívne prvky v oceliach, bol vykonaný experiment,<br />
pri ktorom boli rázom zlomené vzorky ochladené<br />
Obr. 3. TEM fotografie disperzných fáz extrahovaných z ocelí: a)<br />
TiN, b) MnS, c) (Ti+Nb)C, d) astica na báze Ti a S, e) karbidy NbC<br />
a TiC<br />
Obr. 4. SEM fotografia lomovej plochy ocele 10
Chem. Listy 105, s223 s226 (2011) LMV <strong>2008</strong> Regular Lectures<br />
Obr. 5. SEM fotografia lomovej plochy ocele 11<br />
Obr. 6. SEM fotografia lomovej plochy ocele 12<br />
v tekutom dusíku. SEM pozorovania lomových plôch jednotlivých<br />
typov ocelí sú zdokumentované na obr. 4 6. Lomové<br />
plochy ocelí charakterizujú preva ne transkry talické tiepne<br />
fazety, av ak na lomových plochách je mo né zo snímkov<br />
pozorova oblasti interkry talického tiepného poru enia.<br />
V etky druhy ocelí mali oblasti interkry talického tiepenia<br />
rozlo ené po celej lomovej ploche a podiel interkry talického<br />
tiepenia sa zvy oval s rastúcim obsahom fosforu v oceliach,<br />
pri om výskyt oblastí interkry talického tiepenia sa sústre-<br />
Oce 10 Oce 11 Oce 12<br />
Obr. 7. Mikro truktúry ocelí v kolmej rovine na smer valcovania<br />
(63 )<br />
s225<br />
oval v stredovej oblasti hrúbky vzoriek.<br />
Ke e v stredovej oblasti hrúbky vzoriek bol pozorovaný<br />
zvý ený výskyt interkry talického tiepenia, boli vyhotovené<br />
metalografické výbrusy v rovine kolmej na smer valcovania<br />
ocelí. Na mikro truktúrach zdokumentovaných na<br />
obr. 7 je vidie zvýraznenie stredovej oblasti leptaním, ktoré<br />
je v oceli 12 nepozorovate né a naopak v oceli 10 výrazné.<br />
EDX analýza naleptaných výbrusov ocelí 10 a 11 (obr. 8<br />
a 9) poukázala, e v stredových oblastiach sa nachádza zvý ené<br />
mno stvo fosforu, ktoré po kvantitatívnej analýze dosahovalo<br />
vy ie hodnoty (tab. III, IV) ako sa nachádza v zlo ení<br />
ocelí. V oblasti obohatenej fosforom je mo né taktie pozorova<br />
zvý enú hustotu disperzných astíc. TEM analýzou astíc<br />
extrahovaných v uhlíkových replikách bola pozorovaná vy ia<br />
po etnos astíc TiC, TiNbC a NbC. Napriek vysokému obsahu<br />
fosforu v tejto oblasti, fosfidické astice neboli nájdené.<br />
Obr. 8. Detail stredovej analýzy<br />
Tabu ka III<br />
Kvantitatívne vyhodnotenie EDX analýzy z obr. 8<br />
Element Spectrum 51 Spectrum 52<br />
[hm. %] [hm. %]<br />
P 0,34 0<br />
Mn 0,79 0,86<br />
Fe 98,88 99,14<br />
Obr. 9.
Chem. Listy 105, s223 s226 (2011) LMV <strong>2008</strong> Regular Lectures<br />
Tabu ka IV<br />
Kvantitatívne vyhodnotenie EDX analýzy z obr. 9<br />
Element Spectrum 25 Spectrum 28<br />
[hm. %] [hm. %]<br />
P 0,34 0<br />
Mn 0,50 0,36<br />
Fe 99,16 99,64<br />
Obr. 10. Mikrotvrdos HV 0,01 vzorky 10<br />
Obr. 11. Mikrotvrdos HV 0,01 vzorky 11<br />
Obr. 12. Mikrotvrdos HV 0,01 vzorky 12<br />
s226<br />
Na metalografických výbrusoch bola meraná mikrotvrdos<br />
HV 0,01 po hrúbke materiálu (obr. 10 12) s cie om<br />
zistenia zmeny mechanických vlastností v závislosti od zmeny<br />
rozlo enia fosforu v materiále. Namerané hodnoty poukazujú<br />
na zvý enie tvdosti ocele 10 a tie miernej ie zvý enie<br />
tvrdosti ocele 11 v stredovej oblasti plechu. Okrem ovplyvnenia<br />
stredovej oblasti do lo u ocelí 10 a 11 k celkovému miernemu<br />
nárastu tvrdosti matrice oproti oceli 12.<br />
4. Závery<br />
Z výsledkov experimentov mo no usudzova , e fosfor<br />
v oceli má priaznivý vplyv na pevnostné vlastnosti, ktoré sa<br />
prejavili nárastom medze klzu, medze pevnosti a taktie miernym<br />
nárastom tvrdosti matrice, pri om a nos materiálu bola<br />
zachovaná. Analýzou precipitátov bolo zistené, e fosfor ostal<br />
v tuhom roztoku a neprecipitoval vo forme fosfidických astíc.<br />
Av ak, EDX analýza a hodnoty mikrotvrdosti oce ových<br />
plechov preukázali na zvý enie fosforu v stredovej oblasti<br />
hrúbky plechu a ovplyvnenie stredovej oblasti ocelí so zvý ením<br />
obsahu fosforu v oceliach. Efekt stredovej segregácie<br />
pravdepodobne súvisí s nízkym rozde ovacím koeficientom<br />
fosforu, ktorý po as tuhnutia ocele pri kontinálnom liatí ostáva<br />
v oblastiach, ktoré kry talizujú ako posledné.<br />
LITERATÚRA<br />
1. Alaoua D., Lartigue S., Larere A., Priester L.: Mater. Sci.<br />
Eng., A 189, 155 (1994).<br />
2. Ghosh P., Ray R. K., Ghosh C., Bhattacharjee, D.: Scr.<br />
Mater. 58, 939 (<strong>2008</strong>).<br />
3. Ramos A. S., Sandim H. R. Z., Hashimoto T. M.: Mater.<br />
Characterization 45, 171 (2000).<br />
4. Feliu S., Pérez-Revenga M. L.: Appl. Surf. Sci. 229, 112<br />
(2004).<br />
5. Ghosh P., Ray R. K., Bhattacharya B., Bhargava S.: Scr.<br />
Mater. 55, 271 (2006).<br />
6. Milkovi O.: Výskumná správa . P 102 00057/08.<br />
Technická univerzita v Ko iciach, Ko ice <strong>2008</strong>.<br />
7. Ghosh P., Ray R. K., Bhattacharjee D.: Scr. Mater. 57,<br />
241 (<strong>2007</strong>).<br />
Prezentované výsledky boli získáné v rámci rie enia projektu<br />
APVV 0326-07.<br />
P. Zimov ák a , O. Milkovi b , P. Zubko b , and<br />
M. Vojtko b ( a U. S. Steel Ko ice, Slovakia, b Department of<br />
materials Science, Technical University of Ko ice, Faculty of<br />
Metallurgy, Slovakia): Influence of Phosphorus on Local<br />
Mechanical Properties and Structure Evolution of IF<br />
Steels<br />
Three interstitial free steels stabilized by Ti and Nb, with<br />
different content of phosphorus, have been studied. The minimal<br />
deifferences in precipitation behavior and no phosphides<br />
particles in steels processed by continuous annealing at 850 °C<br />
were observed. The finer mechanical properties and the similar<br />
drawability with higher content of phosporus have been<br />
measured.
Chem. Listy 105, s227 s229 (2011) LMV <strong>2008</strong> Regular Lectures<br />
DETERMINATION OF MECHANICAL PROPERTIES OF MoSi2 COMPOSITES<br />
BY NANOINDENTATION<br />
PAVOL ZUBKO a , BEÁTA<br />
BALLÓKOVÁ b , LADISLAV PE EK a ,<br />
and OLGA BLÁHOVÁ c<br />
a Technical university of Ko ice, Faculty of metallurgy, Department<br />
of material science, Park Komenského 11, 043 85<br />
Ko ice, Slovakia, b Slovak Academy of Science, Institute of<br />
Materials Research, Watsonova 13, 040 01 Ko ice, Slovakia,<br />
c New Technologies, Research Center, Universitní 8,<br />
306 14 Plze , Czech Republic<br />
pavol.zubko@tuke.sk, bballokova@imr.saske.sk,<br />
ladislav.pesek@tuke.sk, blahova@ntc.zcu.cz<br />
Key words: ceramic composites, hardness, Young modulus,<br />
depth sensing indentation<br />
Introduction<br />
The MoSi2 phase is a borderline ceramic intermetallic<br />
compound with both covalent and metallic atomic bonds.<br />
Besides traditional use as heating elements, materials based<br />
on MoSi2 appear to be promising candidates for wide variety<br />
of high-temperature structural applications, where high<br />
strength and temperature durability is required 1,2 .<br />
The main disadvantage of MoSi2-based composites is<br />
low fracture toughness, low hardness in lower temperatures.<br />
Several ways of improving the performance of MoSi2-based<br />
composites have been developed by incorporating SiC, ZrO2<br />
or HfO2 particles into the matrix.<br />
The aim of this work was to investigate mechanical<br />
properties of MoSi2-based composites with reinforced 10<br />
wt.% of ceramics particles: SiC, nanoSiC, Si 3N4, ZrO2, HfO2<br />
particles were used.<br />
Depth sensing indentation technique 3 was used to determine<br />
mechanical properties in local scale represented by indentation<br />
depth of 100 nm and in global scale represented by<br />
the depth of 1000 nm.<br />
2. Materials and experimental procedure<br />
The materials were prepared by powder metallurgy technology<br />
using a high-energy milling process. The mechanical<br />
treatment was started from coarse-grained elemental powders<br />
(Mo and Si) with diameters of 100 500 m and reinforced<br />
materials in order to prepare materials with 10 % of SiC,<br />
nanoSiC, ZrO2, HfO2 and Si3N4. The powders were milled<br />
using the steel ball milling set in argon environment. The<br />
milled powders were densified by hot pressing at 1550 °C in<br />
vacuum.<br />
The experimental materials, incorporated with secondary<br />
s227<br />
particles were supplied in the form of bars. For investigation<br />
were samples mounted, grinded and polished.<br />
The microstructures of investigated materials are shown<br />
in Fig. 1 6. Fig. 1 shows material of monolithic MoSi2 in<br />
cross-polarized illumination. The average grain size of mono-<br />
Fig. 1. The microstructure of monolithic MoSi 2<br />
Fig. 2. The microstructure of MoSi 2-based composites with incorporated<br />
10 wt.% nanoSiC particles<br />
Fig. 3. The microstructure of MoSi 2-based composites with incorporated<br />
10 wt.% SiC particles
Chem. Listy 105, s227 s229 (2011) LMV <strong>2008</strong> Regular Lectures<br />
lithic MoSi2 is 5 m. Incorporation of particles (SiC, ZrO2,<br />
Si3N4) causes reduction of grain size growing, increasing ratio<br />
of pores, while HfO2 particles cause opposite behaviour. The<br />
glassy SiO2 phase was found in the microstructure in both<br />
cases too.<br />
Depth sensing indentation tests were carried out using<br />
Nanoindenter XP with Berkovich tip. Over 50 indents were<br />
placed on each of investigated materials. The CSM<br />
(Continuous Stiffness Measurement) was used to show difference<br />
between properties measured in local and global scale. In<br />
the case of local properties the mean indent area is smaller<br />
Fig. 4. The microstructure of MoSi 2-based composites with incorporated<br />
10 wt.% ZrO2 particles<br />
Fig. 5. The microstructure of MoSi 2-based composites with incorporated<br />
10 wt.% HfO2 particles<br />
Fig. 6. The microstructure of MoSi 2-based composites with incorporated<br />
10 wt.% Si3N4 particles<br />
s228<br />
then the area of one grain, while the global properties represent<br />
two and more grains.<br />
The instrumented hardness (HIT) and indentation<br />
modulus (EIT) were evaluated in two indentation depths. The<br />
influence of incorporated particles on the properties of particular<br />
grains was investigated in the depth of 100 nm. The<br />
influence of grains boundaries and pores on properties was<br />
investigated in global scale of 1000 nm.<br />
The goal of this contribution is to describe the effect of<br />
incorporated particles on the hardness and modulus for different<br />
scales.<br />
3. Results and discussion<br />
The results of indentation experiments presented as:<br />
Hardness (HIT) vs. indentation depth and modulus (EIT) vs.<br />
indentation depth relations are shown in Fig. 7 and Fig. 8. The<br />
hardness and modulus values decrease with increasing indentation<br />
depth. The pores were observed in the microstructure of<br />
investigated materials. Therefore the hardness and modulus<br />
values decrease because of plastic zone under the tip closes to<br />
a phase intersecition. The presence of pores and their size<br />
distribution are documented in Fig. 1 6 and in the Table I.<br />
Hardness and modulus values were extracted from the depth<br />
of 100 nm to avoid the influence of pores on the improvement<br />
of mechanical properties by incorporation of particles. The<br />
modulus values and hardness values are summarized in the<br />
Table II and III. The hardness and modulus values were extracted<br />
from the depth of 1 m in order to describe the effect<br />
of pores.<br />
Both, hardness and modulus values in 100 nm depth are<br />
the highest for composites with 10 % Si 3N4 and with 10 %<br />
nanoSiC particles. Similar results were measured for the<br />
maximum depth, too. The smallest difference between the<br />
average hardness and modulus values determined in local and<br />
global scale was measured in the material with ZrO2 particles,<br />
but the scatter of the results was the highest. The grain size of<br />
Hardness (GPa)<br />
30<br />
28<br />
26<br />
24<br />
22<br />
20<br />
18<br />
16<br />
14<br />
12<br />
10<br />
8<br />
MoSi2<br />
MoSi 2 +HfO 2<br />
MoSi 2 +ZrO 2<br />
MoSi2+SiC<br />
MoSi 2 +NanoSiC<br />
MoSi 2 +Si 3 N 4<br />
0 100 200 300 400 500 600 700 800 900 1000<br />
Indentation depht (nm)<br />
Fig. 7. Hardness (HIT) indentation depth dependence of investigated<br />
materials
Chem. Listy 105, s227 s229 (2011) LMV <strong>2008</strong> Regular Lectures<br />
Indentation modulus (GPa)<br />
500<br />
450<br />
400<br />
350<br />
300<br />
250<br />
200<br />
MoSi 2 MoSi 2 +HfO 2<br />
MoSi 2 +ZrO 2 MoSi 2 +SiC<br />
MoSi 2 +NanoSiC MoSi 2 +Si 3 N 4<br />
0 100 200 300 400 500 600 700 800 900 1000<br />
Indentation depth (nm)<br />
Fig. 8. Indentation modulus (EIT) indentation depth dependence<br />
of investigated materials<br />
Table I<br />
The size and area ratio of pores found in investigated<br />
materials<br />
MoSi2 +<br />
10 % HfO2 ZrO2 nano<br />
SiC<br />
SiC Si3N4 monolith<br />
Pore size, m 1 2 2 4 1 2 0.1 1<br />
Area ratio, % 10 5.6 10 0.7<br />
Table II<br />
Modulus of elasticity (GPa) determined in the depth 100 nm<br />
(EIT100) and 1000 nm (EIT1000)<br />
MoSi2 +<br />
10 % HfO2 ZrO2 nano SiC SiC Si3N4 monolith<br />
EIT100 352 294 414 398 415 385<br />
STD 65 86 41 31 33 24<br />
% COV 18 29 10 7 8 6<br />
EIT1000 295 294 395 331 357 297<br />
STD 30 22 12 10 9 9<br />
% COV 10 8 3 3 3 3<br />
this material is the smallest. The measured results in local<br />
scale are therefore strongly affected by both grain boundaries<br />
and pores.<br />
s229<br />
Table III<br />
Hardness (GPa) determined in the depth 100 nm (HIT100) and<br />
1000 nm (HIT1000)<br />
4. Conclusions<br />
The depth sensing indentation method is usable to determine<br />
mechanical properties of composite materials; however<br />
it is very important to take in account the microstructure inhomogeneities,<br />
like pores, etc.<br />
It is possible to determine the homogeneity of materials<br />
based on the scatter of measured results.<br />
The highest hardness and modulus values were measured<br />
on materials with incorporated nanoSiC and Si3N4 particles.<br />
This work was supported by the VEGA Grant No. 1/3210/06<br />
and partly by the SK-CZ project SK-CZ-0108-07.<br />
REFERENCES<br />
MoSi2 +<br />
10 % HfO2 ZrO2 nano SiC SiC Si3N4 monolith<br />
HIT100 18 15 23 22 24 18<br />
STD 1.8 5 1.7 1.8 1.6 1.4<br />
% COV 19 32 8 8 7 8<br />
HIT1000 12 13 18 16 16 14<br />
STD 2 2 0.8 1 0.6 0.7<br />
% COV 17 15 4 7 4 5<br />
1. Hvizdo P., Besterci M., Ballóková B., Sholl R., Bohm<br />
A.: Mater. Lett. 51, 485 (2001).<br />
2. Ballóková B., Hvizdo P., Ivan J., Zumdick M., Besterci<br />
M.: Int. J. Mat. Product Technology 22, 322 (2005).<br />
3. Oliver W. C., Pharr G. M.: J. Mat. Res. 7, 1564 (1992).<br />
P. Zubko a , B. Ballóková b , L. Pe ek a , and O. Bláhová c<br />
( a Department of Material Science, Technical university of<br />
Ko ice, Ko ice, b Slovak Academy of Science, Institute of Materials<br />
Research, Ko ice, Slovakia, c New Technologies Research<br />
Center, West Bohemian University, Plze , Czech Republic):<br />
Determination of Mechanical Properties of MoSi2<br />
Composites by DSI<br />
The paper deals with the determination of mechanical<br />
properties of MoSi2 composites with incorporated SiC,<br />
nanoSiC, Si3N4, HfO2 and ZrO2 particles. The hardness and<br />
modulus of the investigated composite materials were determined.<br />
The highest hardness and modulus values were obtained<br />
in the case of MoSi2 with nanoSiC and Si3N4 particles.<br />
The great influence of pores was detected.
Author Index<br />
Ambri ko . s150, s206<br />
Ballóková B. s227<br />
Bidulská J. s155<br />
Bidulský R. s155, s159<br />
Bláhová O. s98, s132, s136, s140, s163, s175, s182, s202,<br />
s210, s214, s227<br />
B ezina M. s167<br />
Bur ík J. s98<br />
Bur íková V. s98, s129, s132, s171<br />
Ciupin V. s132<br />
Contulov M. s132<br />
ech J. s129<br />
Dajbychová L. s175<br />
Dor áková F. s218<br />
Dusza J. s191, s178, s218<br />
Ferdinandy M. s112<br />
Forstová K. s123, s146<br />
Fo t T. s102<br />
Franta D. s98<br />
Garbiak M. s187<br />
Grande M. A. s155, s159<br />
Grossman J. s102<br />
Heged sová L. s178<br />
Houdková . s105, s182<br />
Chyli ska R. s187<br />
Jan u ka I. s109, s195<br />
Ja ek O. s98, s171<br />
Juhász A. s112<br />
Kabátová M. s159<br />
Kandra T. s150<br />
Karásková M. s98<br />
Ka parová M. s105, s182<br />
Klapetek P. s98<br />
Kloc P. s129<br />
Ko i ko R. s155<br />
Kollárová M. s136<br />
Koval íková A. s191<br />
s230<br />
Kraj ovi J. s109, s195<br />
Ku erová Z. s171<br />
Kudrle V. s171<br />
Kup a . s167<br />
Kva kaj T. s155<br />
Lofaj F. s112, s198<br />
Mat jková J. s171<br />
Medlín R. s202<br />
Men ík J. s115, s143<br />
Mihaliková M. s206<br />
Milkovi O. s223<br />
Musa G. s132<br />
Navrátil Z. s129<br />
N me ek J. s120, s123, s146<br />
Novák R. s102<br />
Odrá ková M. s125<br />
Pe ek L. s136, s150, s227<br />
Ráhe J. s125<br />
íha J. s202, s210<br />
Savková J. s214<br />
Sobota J. s102<br />
S ahel P. s125, s129<br />
Stoica A. s132<br />
Synek P. s171<br />
paková J. s218<br />
pírková M. s140, s175<br />
utta P. s210<br />
Vadasová Z. s136<br />
Vít T. s102<br />
Vl doiu R. s132<br />
Vojtko M. s223<br />
Vysko il J. s102<br />
Zahálka F. s105, s182<br />
Zají ková L. s98, s171<br />
Zimov ák P. s223<br />
Zubko P. s136, s223, s227
s231
CHEMICKÉ LISTY ro ník/volume 105 (S), ís./no. Symposia LISTY CHEMICKÉ ro ./vol. 135, ASOPIS PRO PR MYSL CHEMICKÝ, ro ./vol. 121<br />
ISSN 0009-2770, ISSN 1213-7103 (e-verze), ISSN 1803-2389 (CD verze) eviden ní íslo MK R E 321 Vydává eská spole nost chemická jako asopis Asociace<br />
eských chemických spole ností ve spolupráci s V CHT Praha, s SPCH a ÚOCHB AV R za finan ní podpory Nadace eský literární fond a kolektivních len<br />
SCH I O 444715 Published by the Czech Chemical Society VEDOUCÍ REDAKTOR/EDITOR-IN-CHIEF: B. Kratochvíl REDAKTO I/ EDITORS: J. Barek,<br />
Z. B lohlav, P. Dra ar, J. Hetflej , P. Holý, J. Horák, P. Chuchvalec, J. Pode va, P. Rauch, J. Volke; Bulletin: I. Valterová; Webové stránky: R. Liboska, P. Zámostný<br />
ZAHRANI NÍ A OBLASTNÍ REDAKTO I/FOREIGN AND REGIONAL EDITORS: F. vec (USA), Z. Kolská (Ústí nad Labem) KONZULTANT/<br />
CONSULTANT: J. Kahovec TECHNICKÁ REDAKTORKA/EDITORIAL ASSISTANT: R. ápková REDAK NÍ RADA/ADVISORY BOARD: K. Bláha,<br />
L. ervený, E. Dibuszová, J. Hanika, Z. Havlas, J. Ká , M. Koman, J. Koubek, T. Mí ek, V. Pa es, O. Paleta, V. R i ka, I. Stibor, V. imánek, R. Zahradník<br />
ADRESA PRO ZASÍLÁNÍ P ÍSP VK /MANUSCRIPTS IN CZECH, SLOVAK OR ENGLISH CAN BE SENT TO: Chemické listy, Novotného lávka 5, 116 68<br />
Praha 1; tel./phone +420 221 082 370, +420 222 220 184, e-mail: chem.listy@csvts.cz INFORMACE O P EDPLATNÉM, OBJEDNÁVKY, PRODEJ JED-<br />
NOTLIVÝCH ÍSEL A INZERCE/INFORMATION ADS: Sekretariát SCH, Novotného lávka 5, 116 68 Praha 1; tel. +420 222 220 184, e-mail:<br />
chem.spol@csvts.cz, chem.ekonom@csvts.cz PLNÁ VERZE NA INTERNETU/FULL VERSION ON URL: http://www.chemicke-listy.cz TISK: Rodomax s.r.o.,<br />
Rezecká 1164, 549 01 Nové M sto nad Metují Redakce ísla Symposia (ISSUE EDITOR): L. Pe ek, V. Bur íková, O. Bláhová SAZBA, ZLOM: SCH, Chemické<br />
listy Copyright © 2011 Chemické listy/ eská spole nost chemická Cena výtisku 170 K , ro ní plné p edplatné 2011 (12 ísel) 1730 K , individuální lenské p edplatné<br />
pro leny SCH 865 K . Ro ní p edplatné ve Slovenské republice 92 EUR (doru ování via SCHS), individuální lenské p edplatné pro leny SCH 70 EUR<br />
(doru ování via SCHS), 258 EUR (individuální doru ování), ceny jsou uvedeny v etn DPH DISTRIBUTION ABROAD: KUBON & SAGNER, POB 34 01 08,<br />
D-80328 Munich, FRG; Annual subscription for 2011 (12 issues) 225 EUR This journal has been registered with the Copyright Clearance Center, 2322 Rosewood<br />
Drive, Danvers, MA 01923, USA, where the consent and conditions can be obtained for copying the articles for personal or int ernal use Pokyny pro autory<br />
najdete na http://www.chemicke-listy.cz , zkratky asopis podle Chemical Abstract Service Source Index (viz http://cassi.cas.org/search.jsp) Chemické listy obsahující<br />
Bulletin jsou zasílány zdarma v em individuálním a kolektivním len m SCH a SPCH v R i zahrani í, do v ech relevantních knihoven v R<br />
a významným p edstavitel m eské chemie a chemického pr myslu; v rámci dohod o spolupráci i len m dal ích odborných spole ností Molekulární nám t na<br />
obálce: P. Holý Dáno do tisku 28.2.2011.<br />
s232


