Rainfall infiltration and runoff from an Alfisol in semi-arid tropical ...
Rainfall infiltration and runoff from an Alfisol in semi-arid tropical ...
Rainfall infiltration and runoff from an Alfisol in semi-arid tropical ...

Create successful ePaper yourself
Turn your PDF publications into a flip-book with our unique Google optimized e-Paper software.
66 K.P.C. Rao et al. / Soil & Tillage Research 48 (1998) 61±69<br />
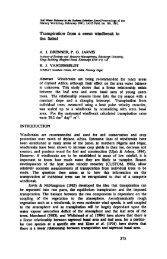
Fig. 4. Infiltration rate as a function of cumulative ra<strong>in</strong>fall for the<br />
shallow tilled system without amendments (STB).<br />
<strong>runoff</strong> hydrographs of the events that occurred <strong>from</strong><br />
the date of tillage up to when the accumulated ra<strong>in</strong>fall<br />
equaled 150 mm. The <strong>in</strong>®ltration rate for freshly tilled<br />
soil is dif®cult to obta<strong>in</strong> by this method as the ®rst<br />
ra<strong>in</strong>s normally do not result <strong>in</strong> <strong>runoff</strong>. Consequently,<br />
the <strong>in</strong>®ltration rate without a crust at the time of<br />
pl<strong>an</strong>t<strong>in</strong>g was measured with the double r<strong>in</strong>g <strong>in</strong>®ltrometer<br />
(Bajracharya et al., 1996).<br />
The decl<strong>in</strong>e <strong>in</strong> <strong>in</strong>®ltration rate as shown <strong>in</strong> Fig. 4 is<br />
often described by <strong>an</strong> exponential equation as a function<br />
of time (Horton, 1940). Mor<strong>in</strong> <strong><strong>an</strong>d</strong> Benyam<strong>in</strong>i<br />
(1977) used cumulative ra<strong>in</strong>fall <strong>in</strong>stead of time,<br />
viz<br />
it ˆ if ‡ …ii if†exp… b R† (1)<br />
where it is <strong>in</strong>®ltration rate at time t (mm h 1 ); ii is<br />
<strong>in</strong>itial <strong>in</strong>®ltration rate at tillage (mm h 1 ); ifˆ®nal<br />
<strong>in</strong>®ltration rate (mm h 1 ); bˆempirical const<strong>an</strong>t;<br />
Rˆcumulative ra<strong>in</strong>fall s<strong>in</strong>ce tillage (mm).<br />
From Eq. (1), tak<strong>in</strong>g the ®nal <strong>in</strong>®ltration rate, if, of<br />
9.6 mm h 1 <strong>from</strong> Part I (Rao et al., 1998) <strong><strong>an</strong>d</strong> by<br />
l<strong>in</strong>early regress<strong>in</strong>g the natural log of the <strong>in</strong>®ltration<br />
rate <strong><strong>an</strong>d</strong> cumulative ra<strong>in</strong>fall s<strong>in</strong>ce tillage we ®nd <strong>an</strong><br />
<strong>in</strong>itial <strong>in</strong>®ltration rate of 610 mm h 1 <strong><strong>an</strong>d</strong> bˆ0.0757.<br />
The <strong>in</strong>®ltration rate for the ZTB system c<strong>an</strong> then be<br />
expressed as:<br />
it ˆ 9:6 ‡ 600:4 exp… 0:0757 R† (2)<br />
The DTB systems had a slightly higher <strong>in</strong>®ltration<br />
rates dur<strong>in</strong>g the ®rst ra<strong>in</strong>s, but the reduction <strong>in</strong> <strong>in</strong>®ltration<br />
rate over time was very similar to the STB<br />
system.<br />
Table 3<br />
Regression equations for <strong>runoff</strong> <strong>from</strong> different systems dur<strong>in</strong>g Crop<br />
Period 1 (tillage to 150 mm ra<strong>in</strong> after tillage) (Nˆ150)<br />
Treatment Equation R 2<br />
STB Qˆ0.482*P 4.640 0.843<br />
STF Qˆ0.498*PI30 0.652 0.916<br />
STS Qˆ0.309*PI30 0.823 0.744<br />
DTB Qˆ0.401*P 3.706 0.816<br />
DTF Qˆ0.370*PI30 0.100 0.792<br />
DTS Qˆ0.162*PI30 0.330 0.711<br />
Legend: Qˆevent <strong>runoff</strong> (mm); Pˆevent ra<strong>in</strong>fall (mm); PI30ˆ<br />
product of ra<strong>in</strong>fall <strong>in</strong> mm; <strong><strong>an</strong>d</strong> 30 m<strong>in</strong> <strong>in</strong>tensity divided by one<br />
hundred; The first two letters of the treatments <strong>in</strong>dicate type of<br />
tillage ± ZT: Zero; ST: Shallow; DT: Deep; The last letter is<br />
the type of amendment ± B: Bare no amendments; F: Amended<br />
with 15 Mg ha 1 yr 1 farmyard m<strong>an</strong>ure; S: Amended with<br />
5 Mg ha 1 yr 1 rice straw.<br />
The amount of ra<strong>in</strong>fall <strong><strong>an</strong>d</strong> product of ra<strong>in</strong>fall<br />
amount <strong><strong>an</strong>d</strong> 30 m<strong>in</strong> ra<strong>in</strong>fall <strong>in</strong>tensity were positively<br />
correlated with <strong>runoff</strong> dur<strong>in</strong>g this period. While ra<strong>in</strong>fall<br />
amount correlated well with <strong>runoff</strong> <strong>from</strong> bare<br />
system (STB <strong><strong>an</strong>d</strong> DTB) plots, the product of ra<strong>in</strong>fall<br />
amount <strong><strong>an</strong>d</strong> 30 m<strong>in</strong> <strong>in</strong>tensity were correlated with<br />
<strong>runoff</strong> <strong>from</strong> amended system (STF, STS, DTF, <strong><strong>an</strong>d</strong><br />
DTS) plots. Simple regression equations <strong>in</strong>volv<strong>in</strong>g<br />
these variables expla<strong>in</strong>ed 71 to 92% of the variation<br />
<strong>in</strong> <strong>runoff</strong> <strong>from</strong> the different system plots (Table 3).<br />
The relationships between ra<strong>in</strong>fall <strong><strong>an</strong>d</strong> <strong>runoff</strong> for <strong>an</strong><br />
average <strong>in</strong>tensity of 20 mm h 1 <strong>in</strong>dicate signi®c<strong>an</strong>t<br />
differences <strong>in</strong> <strong>runoff</strong> <strong>from</strong> bare system plots compared<br />
to that <strong>from</strong> amended system plots (Fig. 5). Both<br />
shallow <strong><strong>an</strong>d</strong> deep tillage reduced <strong>runoff</strong> compared<br />
to ZTB. The effect of tillage depth was relatively<br />
small with shallow tillage result<strong>in</strong>g <strong>in</strong> higher <strong>runoff</strong>.<br />
3.4. Crop period 2 (<strong>from</strong> 150 mm ra<strong>in</strong>fall s<strong>in</strong>ce<br />
tillage to harvest)<br />
Runoff <strong>from</strong> the ZTB system plots was about 24%<br />
of the ra<strong>in</strong>fall compared to 35% dur<strong>in</strong>g the other<br />
periods. Tilled systems without amendment (DTB<br />
<strong><strong>an</strong>d</strong> STB) resulted <strong>in</strong> <strong>runoff</strong> similar to the no-tilled<br />
systems (ZTB) while <strong>runoff</strong> <strong>from</strong> amended system<br />
plots was lower. Runoff <strong>from</strong> system plots amended<br />
with farmyard m<strong>an</strong>ure (DTF <strong><strong>an</strong>d</strong> STF) was 40% to<br />
47% of that <strong>from</strong> the ZTB system plots <strong><strong>an</strong>d</strong> that <strong>from</strong><br />
the straw plot was 21% to 26% of that <strong>from</strong> the ZTB<br />
system plot.