Rainfall infiltration and runoff from an Alfisol in semi-arid tropical ...
Rainfall infiltration and runoff from an Alfisol in semi-arid tropical ...
Rainfall infiltration and runoff from an Alfisol in semi-arid tropical ...

Create successful ePaper yourself
Turn your PDF publications into a flip-book with our unique Google optimized e-Paper software.
Abstract<br />
Soil & Tillage Research 48 (1998) 61±69<br />
<strong>Ra<strong>in</strong>fall</strong> <strong>in</strong>®ltration <strong><strong>an</strong>d</strong> <strong>runoff</strong> <strong>from</strong> <strong>an</strong> Al®sol <strong>in</strong><br />
<strong>semi</strong>-<strong>arid</strong> <strong>tropical</strong> India. II. Tilled systems 1<br />
K.P.C. Rao a , T.S. Steenhuis b,* , A.L. Cogle c , S.T. Sr<strong>in</strong>ivas<strong>an</strong> a ,<br />
D.F. Yule c , G.D. Smith c<br />
a International Crops Research Institute for the Semi-Arid Tropics, P.O. Pat<strong>an</strong>cheru, Hyderabad 502 324, AP, India<br />
b Department of Agricultural <strong><strong>an</strong>d</strong> Biological Eng<strong>in</strong>eer<strong>in</strong>g, 216 Riley-Robb Hall, Cornell University, Ithaca, NY 14853, USA<br />
c Queensl<strong><strong>an</strong>d</strong> Department of Primary Industries, Brisb<strong>an</strong>e, Que., Australia<br />
Accepted 3 March 1998<br />
Formation of low permeable crusts on Al®sols of <strong>semi</strong>-<strong>arid</strong> <strong>tropical</strong> India signi®c<strong>an</strong>tly affects <strong>runoff</strong> <strong><strong>an</strong>d</strong> erosion processes<br />
dur<strong>in</strong>g ra<strong>in</strong>storms. The m<strong>an</strong>agement options commonly used to reduce <strong>runoff</strong> are tillage <strong><strong>an</strong>d</strong>/or application of org<strong>an</strong>ic<br />
amendments. Daily <strong>runoff</strong> data <strong>from</strong> a ®eld experiment conducted at International Crops Research Institute for the Semi-Arid<br />
Tropics, Hyderabad, India, were <strong>an</strong>alyzed to qu<strong>an</strong>tify the bene®ts of two different types of tillages (shallow tillage to a depth<br />
of 10 cm <strong><strong>an</strong>d</strong> deep tillage to a depth of 20 cm) <strong><strong>an</strong>d</strong> application of amendments (farmyard m<strong>an</strong>ure at 15 Mg ha 1 yr 1 <strong><strong>an</strong>d</strong> rice<br />
straw (Oryza sativa) at 5 Mg ha 1 yr 1 ) us<strong>in</strong>g a no-till, unamended system as a control. The no-till system is discussed <strong>in</strong><br />
detail <strong>in</strong> Part I. Runoff <strong>from</strong> tilled plots decl<strong>in</strong>ed sharply after tillage operation <strong><strong>an</strong>d</strong> reverted back to that <strong>from</strong> <strong>an</strong> untilled plot<br />
after a few storms totall<strong>in</strong>g about 150 mm of ra<strong>in</strong>fall. Consequently, the effective period of tillage varied <strong>from</strong> 5 days <strong>in</strong> 1989,<br />
when a s<strong>in</strong>gle storm of 115 mm ra<strong>in</strong> occurred 5 days after tillage, to about 60 days dur<strong>in</strong>g 1993 <strong><strong>an</strong>d</strong> 1994. Qu<strong>an</strong>titative<br />
ra<strong>in</strong>fall±<strong>runoff</strong> relationships were developed by divid<strong>in</strong>g 633 ra<strong>in</strong>fall±<strong>runoff</strong> events over 6 years <strong>in</strong>to three groups, depend<strong>in</strong>g<br />
on time of occurrence: fallow period, <strong>from</strong> time of tillage operation to receipt of 150 mm of ra<strong>in</strong>, <strong><strong>an</strong>d</strong> the rema<strong>in</strong><strong>in</strong>g events<br />
dur<strong>in</strong>g the cropp<strong>in</strong>g period after 150 mm of ra<strong>in</strong> to crop harvest. More th<strong>an</strong> 73% of the variation <strong>in</strong> <strong>runoff</strong> <strong>from</strong> bare <strong><strong>an</strong>d</strong><br />
farmyard m<strong>an</strong>ure plots could be expla<strong>in</strong>ed by either ra<strong>in</strong>fall amount or by the product of ra<strong>in</strong>fall amount <strong><strong>an</strong>d</strong> 30 m<strong>in</strong> <strong>in</strong>tensity.<br />
In addition, soil cover was import<strong>an</strong>t dur<strong>in</strong>g the fallow period. Us<strong>in</strong>g the 5 m<strong>in</strong> ra<strong>in</strong>fall <strong>in</strong>tensities, we found that <strong>runoff</strong> of<br />
tilled systems may be reduced <strong>from</strong> 35% to 10% of ra<strong>in</strong>fall by add<strong>in</strong>g straw. The implication is that org<strong>an</strong>ic amendments (such<br />
as straw or farmyard m<strong>an</strong>ure, if available) offer a susta<strong>in</strong>able way for Al®sols to ma<strong>in</strong>ta<strong>in</strong> a high <strong>in</strong>®ltration rate <strong><strong>an</strong>d</strong>, thereby,<br />
both reduce <strong>runoff</strong> <strong><strong>an</strong>d</strong> <strong>in</strong>crease the amount of water available for crop production. # 1998 Elsevier Science B.V. All rights<br />
reserved.<br />
Keywords: Crust; Semi-<strong>arid</strong> tropics; <strong>Ra<strong>in</strong>fall</strong>±<strong>runoff</strong> relationship; Al®sol; In®ltration; Runoff; Tillage<br />
*Correspond<strong>in</strong>g author. Tel.: 001 607 255 2489; fax: 001 607<br />
255 4080; e-mail: tss1@cornell.edu<br />
1 Approved as ICRISAT Journal Article No. 2054.<br />
0167-1987/98/$19.00 # 1998 Elsevier Science B.V. All rights reserved.<br />
P I I S 0 1 6 7 - 1 9 8 7 ( 9 8 ) 0 0 1 2 5 - 1<br />
1. Introduction<br />
On Al®sols <strong>in</strong> <strong>semi</strong>-<strong>arid</strong> regions, the formation<br />
of a crust reduces <strong>in</strong>®ltration <strong><strong>an</strong>d</strong> <strong>in</strong>creases <strong>runoff</strong>.
62 K.P.C. Rao et al. / Soil & Tillage Research 48 (1998) 61±69<br />
Loss of ra<strong>in</strong>water as <strong>runoff</strong> not only limits the<br />
water available for crop production but also forms<br />
<strong>an</strong> erosion hazard. Runoff c<strong>an</strong> be reduced by break<strong>in</strong>g<br />
up the crust by tillage <strong><strong>an</strong>d</strong>/or application of soil<br />
amendments. Traditionally, <strong>in</strong> India, two tillage<br />
implements are used: the <strong>an</strong>imal-drawn wooden<br />
plough <strong><strong>an</strong>d</strong> the blade harrow. The wooden plough<br />
breaks up the crust <strong><strong>an</strong>d</strong> loosens the soil to a depth<br />
of 10 cm. The blade harrow disturbs the top 5 cm<br />
of soil to control weeds (Laryea et al., 1991). An<br />
improved tillage method, recently recommended,<br />
loosens the soil to 25 cm (Vijayalakshmi, 1987).<br />
Increased <strong>in</strong>®ltration <strong><strong>an</strong>d</strong> reduced <strong>runoff</strong> result<strong>in</strong>g<br />
<strong>from</strong> tillage is temporary (Hoogmoed <strong><strong>an</strong>d</strong> Stroosnijder,<br />
1984; Pathak et al., 1987; Mead <strong><strong>an</strong>d</strong> Ch<strong>an</strong>, 1988).<br />
Tillage may also lead to decreased crop production by<br />
break<strong>in</strong>g down the soil's org<strong>an</strong>ic matter (Tisdall <strong><strong>an</strong>d</strong><br />
Oades, 1982).<br />
Farmyard m<strong>an</strong>ure is a traditional soil amendment<br />
used by farmers to reduce soil crusts <strong><strong>an</strong>d</strong> <strong>in</strong>crease<br />
the amount of soil org<strong>an</strong>ic matter. Farmyard m<strong>an</strong>ure<br />
also improves the physical condition of the soil<br />
by promot<strong>in</strong>g aggregation. Mulch<strong>in</strong>g with crop residues<br />
(such as rice straw) protects the soil aga<strong>in</strong>st<br />
ra<strong>in</strong>drop impact <strong><strong>an</strong>d</strong> results <strong>in</strong> less aggregate breakdown<br />
<strong><strong>an</strong>d</strong> smaller <strong>runoff</strong> amounts (Venkateswarlu,<br />
1987).<br />
Although the effectiveness of these practices <strong>in</strong><br />
reduc<strong>in</strong>g crust formation, improv<strong>in</strong>g <strong>in</strong>®ltration <strong><strong>an</strong>d</strong><br />
reduc<strong>in</strong>g <strong>runoff</strong> is known qualitatively, there is very<br />
little qu<strong>an</strong>titative <strong>in</strong>formation. In this paper we <strong>in</strong>vestigate<br />
the effect of tillage <strong><strong>an</strong>d</strong> addition of org<strong>an</strong>ic<br />
amendments on the <strong>in</strong>®ltration <strong><strong>an</strong>d</strong> <strong>runoff</strong> <strong><strong>an</strong>d</strong><br />
compare their effects with <strong>an</strong> unamended untilled<br />
system.<br />
2. Material <strong><strong>an</strong>d</strong> methods<br />
In July 1988 <strong>an</strong> experiment was established on<br />
<strong>runoff</strong> plots measur<strong>in</strong>g 28.5 m by 8.0 m with a l<strong><strong>an</strong>d</strong>slope<br />
of 2% at the research farm of ICRISAT Center at<br />
Pat<strong>an</strong>cheru (188N, 788E), 26 km northwest of Hyderabad,<br />
Andhra Pradesh, India (Smith et al., 1992). The<br />
soil was a Rhodic Ustalf with a moisture content<br />
between 0.5% <strong><strong>an</strong>d</strong> 2%. Bulk density of the soil was<br />
between 1.4 <strong><strong>an</strong>d</strong> 1.6 g cm 3 . Of the 15 different soil<br />
m<strong>an</strong>agement systems tested, data <strong>from</strong> n<strong>in</strong>e systems<br />
were used <strong>in</strong> this <strong>an</strong>alysis. The n<strong>in</strong>e systems were<br />
composed of three levels of amendments ± no amendment<br />
(B), farmyard m<strong>an</strong>ure at 15 Mg ha 1 (F), <strong><strong>an</strong>d</strong><br />
rice straw at 5 Mg ha 1 (S) ± <strong><strong>an</strong>d</strong> three levels of tillage<br />
± zero tillage (ZT), shallow tillage to a depth of 10 cm<br />
(ST), <strong><strong>an</strong>d</strong> deep tillage to a depth of 20 cm (DT). All<br />
treatments were replicated three times. In this paper,<br />
each m<strong>an</strong>agement system is designated by the letter<br />
for tillage followed by the letter for amendment. Thus,<br />
for example, ZTB designates the zero tillage system<br />
with no amendment <strong><strong>an</strong>d</strong> DTS designates deep tillage<br />
with <strong>an</strong> amendment of straw. The six m<strong>an</strong>agement<br />
systems that <strong>in</strong>volve tillage are discussed <strong>in</strong> depth. The<br />
zero tillage systems (ZTB, ZTF, <strong><strong>an</strong>d</strong> ZTS), which<br />
show a different <strong>runoff</strong> behavior th<strong>an</strong> the tillage<br />
systems are only used for comparison (Rao et al.,<br />
1998).<br />
Each year (generally <strong>in</strong> the second half of June),<br />
all ®elds (except for no-till treatments) were tilled<br />
to a depth of 10 cm us<strong>in</strong>g duck foot t<strong>in</strong>es mounted<br />
on a tractor-operated tool bar. The two different tillage<br />
treatments (DT <strong><strong>an</strong>d</strong> ST) were then imposed. Org<strong>an</strong>ic<br />
amendments were applied at the time of sow<strong>in</strong>g,<br />
generally with<strong>in</strong> a week after tillage. Plots were<br />
cropped with either Sorghum bicolor (1989,<br />
1990, 1993, <strong><strong>an</strong>d</strong> 1994) or Zea mays (1991 <strong><strong>an</strong>d</strong><br />
1992).<br />
The methods used to record ra<strong>in</strong>fall, <strong>runoff</strong>, <strong><strong>an</strong>d</strong> soil<br />
cover <strong><strong>an</strong>d</strong> to perform the regression <strong>an</strong>alysis were<br />
described <strong>in</strong> Part I (Rao et al., 1998). Brie¯y, ra<strong>in</strong>fall at<br />
the site was measured with a tipp<strong>in</strong>g bucket pluviometer<br />
(0.2 mm/tip) <strong><strong>an</strong>d</strong> <strong>runoff</strong> <strong>from</strong> the experimental<br />
plots was recorded with tipp<strong>in</strong>g buckets (approximately<br />
0.05 mm/tip) at 1 m<strong>in</strong> <strong>in</strong>tervals us<strong>in</strong>g a Campbell<br />
CR10 logger (Smith <strong><strong>an</strong>d</strong> Thomas, 1988). From the<br />
®eld data, daily ra<strong>in</strong>fall <strong><strong>an</strong>d</strong> <strong>runoff</strong> amounts <strong><strong>an</strong>d</strong><br />
maximum 5, 15, <strong><strong>an</strong>d</strong> 30 m<strong>in</strong> <strong>in</strong>tensities of ra<strong>in</strong>fall<br />
were calculated. Dur<strong>in</strong>g the 6-year study, a total of<br />
265 ra<strong>in</strong>fall events <strong>in</strong> excess of 45 mm were recorded<br />
of which 211 produced <strong>runoff</strong>. In the regression<br />
<strong>an</strong>alysis, data <strong>from</strong> all replicates were used as opposed<br />
to their averages.<br />
Soil cover was determ<strong>in</strong>ed by tak<strong>in</strong>g slides of <strong>an</strong><br />
area of 1.5 1.5 m 2 at two locations <strong>in</strong> each plot at<br />
time of tillage, application of amendments, approximately<br />
30 <strong><strong>an</strong>d</strong> 60 days after sow<strong>in</strong>g <strong><strong>an</strong>d</strong> after harvest<br />
of the crop. Soil cover for all ra<strong>in</strong>fall events was<br />
derived by <strong>in</strong>terpolation.
3. Results <strong><strong>an</strong>d</strong> discussion<br />
3.1. Runoff<br />
Although <strong>an</strong>nual <strong>runoff</strong> <strong>from</strong> tilled plots was not<br />
statistically different <strong>from</strong> that of zero tilled plots with<br />
the same amendment (Smith et al., 1992; Yule et al.,<br />
1992; , <strong>in</strong>dividual storm data <strong>in</strong>dicated that differences<br />
existed after tillage. For example, <strong>runoff</strong> for the STB<br />
system (shallow tillage without amendments) as a<br />
portion of the ZTB system (zero tillage without<br />
amendments) for <strong>in</strong>dividual events hav<strong>in</strong>g 2 mm or<br />
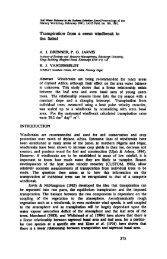
more <strong>runoff</strong> is plotted aga<strong>in</strong>st time <strong>in</strong> Fig. 1. Each<br />
year, <strong>runoff</strong> decl<strong>in</strong>ed to a m<strong>in</strong>imum follow<strong>in</strong>g the<br />
tillage operation <strong><strong>an</strong>d</strong> reverted back to that of the<br />
untilled system after a few storms. In 1989, most of<br />
the bene®t of tillage on <strong>in</strong>creased <strong>in</strong>®ltration rates was<br />
lost dur<strong>in</strong>g a s<strong>in</strong>gle storm of 115 mm of ra<strong>in</strong> 5 days<br />
after tillage. In 1993 <strong><strong>an</strong>d</strong> 1994 tillage effect on <strong>in</strong>®ltration<br />
rate lasted for 60 days. Most ra<strong>in</strong>fall events<br />
dur<strong>in</strong>g these 2 years were smaller th<strong>an</strong> 20 mm <strong><strong>an</strong>d</strong> the<br />
crop protected the soil surface before the crust was<br />
fully developed. Thus, although the period that tillage<br />
reduced <strong>runoff</strong> varied <strong>from</strong> year to year, the <strong>runoff</strong><br />
<strong>from</strong> tilled <strong><strong>an</strong>d</strong> zero tilled systems was similar after<br />
approximately 150 mm of ra<strong>in</strong> after the soil was tilled.<br />
To qu<strong>an</strong>tify ra<strong>in</strong>fall±<strong>runoff</strong> observations, the ra<strong>in</strong>fall±<strong>runoff</strong><br />
events were divided <strong>in</strong>to three groups: the<br />
Fallow Period (last<strong>in</strong>g <strong>from</strong> the crop harvest <strong>in</strong> Octo-<br />
Table 1<br />
Cumulative <strong>runoff</strong> <strong>from</strong> different systems between 1989 <strong><strong>an</strong>d</strong> 1994 <strong>in</strong> different periods<br />
Treatment Runoff (mm) dur<strong>in</strong>g<br />
K.P.C. Rao et al. / Soil & Tillage Research 48 (1998) 61±69 63<br />
Fig. 1. Comparison of <strong>runoff</strong> <strong>from</strong> shallow tillage without<br />
amendments (STB) plots with zero tillage without amendments<br />
(ZTB) plots. Arrows <strong>in</strong>dicate time of tillage for STB plots.<br />
ber to the ®rst tillage operation <strong>in</strong> the next season),<br />
Crop Period 1 (<strong>from</strong> the ®rst tillage operation to <strong>an</strong><br />
accumulation of 150 mm ra<strong>in</strong>fall) <strong><strong>an</strong>d</strong> Crop Period 2<br />
(<strong>from</strong> the end of Period 1 to harvest). Total <strong>runoff</strong> for<br />
each period over the 6 years is given <strong>in</strong> Table 1. The<br />
distribution of total ra<strong>in</strong>fall was 30% dur<strong>in</strong>g the<br />
Fallow Period, 25% dur<strong>in</strong>g Crop Period 1 <strong><strong>an</strong>d</strong> 45%<br />
dur<strong>in</strong>g Crop Period 2. Total <strong>runoff</strong>, compared with the<br />
ZTB system, was 93% <strong><strong>an</strong>d</strong> 80% for the STB <strong><strong>an</strong>d</strong> DTB<br />
systems, respectively. Dur<strong>in</strong>g the Fallow Period <strong><strong>an</strong>d</strong><br />
Crop Period 2 <strong>runoff</strong> for the three tillage systems was<br />
similar. However, dur<strong>in</strong>g Crop Period 1, <strong>runoff</strong> with<br />
Fallow Crop Crop Total<br />
Period Period 1 Period 2 (3854)<br />
(1165) (949) (1740)<br />
ZTB 417 336 415 1168<br />
ZTF 333 153 173 659<br />
ZTS 225 62 85 372<br />
STB 468 225 391 1084<br />
STF 323 111 196 630<br />
STS 255 48 110 413<br />
DTB 386 195 348 929<br />
DTF 353 102 162 617<br />
DTS 247 30 91 369<br />
Legend: Figures <strong>in</strong> parenthesis <strong>in</strong>dicate total ra<strong>in</strong>fall (mm) dur<strong>in</strong>g the period; Crop Period 1: From first tillage operation to 150 mm ra<strong>in</strong><br />
follow<strong>in</strong>g tillage; Crop Period 2: From 150 mm ra<strong>in</strong> s<strong>in</strong>ce tillage to harvest of crop; The first two letters of the treatments <strong>in</strong>dicate type of<br />
tillage ± ZT: Zero; ST: Shallow; DT: Deep; The last letter is the type of amendment ± B: Bare no amendments; F: Amended with<br />
15 Mg ha 1 yr 1 farmyard m<strong>an</strong>ure; S: Amended with 5 Mg ha 1 yr 1 rice straw.
64 K.P.C. Rao et al. / Soil & Tillage Research 48 (1998) 61±69<br />
the STB <strong><strong>an</strong>d</strong> DTB systems was 67% <strong><strong>an</strong>d</strong> 58% of that<br />
with the ZTB system <strong>runoff</strong>, respectively. Amended<br />
systems resulted <strong>in</strong> lower <strong>runoff</strong> th<strong>an</strong> unamended<br />
systems for all periods. The highest reduction <strong>in</strong> <strong>runoff</strong><br />
was observed dur<strong>in</strong>g the crop season (Crop Periods 1<br />
<strong><strong>an</strong>d</strong> 2). Total <strong>runoff</strong> for systems with farmyard m<strong>an</strong>ure<br />
r<strong>an</strong>ged <strong>from</strong> 53% to 56% of the zero tilled system<br />
without amendments (ZTB). For the systems with rice<br />
straw mulch the total <strong>runoff</strong> was approximately 1/3 of<br />
the ZTB system. Tillage had no effect on <strong>runoff</strong> when<br />
amendments were added. To develop qu<strong>an</strong>titative<br />
relationships between <strong>runoff</strong> <strong><strong>an</strong>d</strong> other variables, such<br />
as ra<strong>in</strong>fall amount <strong><strong>an</strong>d</strong> <strong>in</strong>tensity, we carried out a<br />
regression <strong>an</strong>alysis. Variables with signi®c<strong>an</strong>t correlation<br />
were selected us<strong>in</strong>g a procedure similar to that<br />
described <strong>in</strong> Part I (Rao et al., 1998).<br />
3.2. Fallow period (<strong>from</strong> harvest to pl<strong>an</strong>t<strong>in</strong>g <strong>in</strong> the<br />
next season)<br />
Dur<strong>in</strong>g the fallow period, <strong>runoff</strong> was high because<br />
the soil rema<strong>in</strong>ed bare with very little residue or<br />
stubble cover <strong><strong>an</strong>d</strong> the surface had a well-developed<br />
crust. About 51% to 67% of the total <strong>runoff</strong> <strong>from</strong> the<br />
unamended system plots <strong><strong>an</strong>d</strong> more th<strong>an</strong> 50% of the<br />
total <strong>runoff</strong> <strong>from</strong> the amended system plots occurred<br />
dur<strong>in</strong>g this period (Table 1). <strong>Ra<strong>in</strong>fall</strong> amount <strong><strong>an</strong>d</strong> soil<br />
cover were signi®c<strong>an</strong>tly related to <strong>runoff</strong>. <strong>Ra<strong>in</strong>fall</strong><br />
alone expla<strong>in</strong>ed about 84% of the variation <strong>in</strong> <strong>runoff</strong><br />
for the STB system while only 46% of the variation <strong>in</strong><br />
<strong>runoff</strong> for the DTS system was due to ra<strong>in</strong>fall. Correlation<br />
coef®cients between <strong>runoff</strong> <strong><strong>an</strong>d</strong> soil cover r<strong>an</strong>ged<br />
between 0.189 <strong><strong>an</strong>d</strong> 0.314. The best ®t equations<br />
for different systems under this group are given <strong>in</strong><br />
Table 2. The relations were relatively poor for rice<br />
straw systems (R 2 r<strong>an</strong>ged between 55% <strong><strong>an</strong>d</strong> 60%)<br />
compared to bare <strong><strong>an</strong>d</strong> farmyard m<strong>an</strong>ure systems<br />
(R 2 >73%).<br />
The relationship between ra<strong>in</strong>fall <strong><strong>an</strong>d</strong> <strong>runoff</strong> at<br />
me<strong>an</strong> surface cover (20%) for different systems are<br />
compared <strong>in</strong> Fig. 2. These relationships essentially<br />
represent the residual effect of tillage <strong><strong>an</strong>d</strong> amendment<br />
application at the beg<strong>in</strong>n<strong>in</strong>g of the crop season. Runoff<br />
c<strong>an</strong> be expected with 6 to 7 mm of ra<strong>in</strong>fall. Shallow<br />
tillage did not lead to decreased <strong>runoff</strong> dur<strong>in</strong>g the fall<br />
period. In fact, <strong>runoff</strong> with the STB system was<br />
slightly higher th<strong>an</strong> with the ZTB system. This might<br />
<strong>in</strong>dicate the long-term negative effect of tillage on soil<br />
Table 2<br />
Regression equations for <strong>runoff</strong> <strong>from</strong> different systems dur<strong>in</strong>g the<br />
fallow period (Nˆ192)<br />
Treatment Equation R 2<br />
STB Qˆ0.601*P 0.079*SC 2.530 0.868<br />
STF Qˆ0.414*P 0.088*SC 0.980 0.725<br />
STS Qˆ0.330*P 0.068*SC 0.135 0.602<br />
DTB Qˆ0.458*P 0.058*SC 1.590 0.750<br />
DTF Qˆ0.461*P 0.081*SC 1.574 0.756<br />
DTS Qˆ0.301*P 0.069 *SC‡0.093 0.55<br />
Legend: Qˆevent <strong>runoff</strong> (mm); Pˆevent ra<strong>in</strong>fall (mm); SCˆSoil<br />
cover (%); The first two letters of the treatments <strong>in</strong>dicate type of<br />
tillage ± ZT: Zero; ST: Shallow; DT: Deep; The last letter is the<br />
type of amendment ± B: Bare no amendments; F: Amended with<br />
15 Mg ha 1 yr 1<br />
farmyard m<strong>an</strong>ure; S: Amended with<br />
5 Mg ha 1 yr 1 rice straw.<br />
Fig. 2. Predicted ra<strong>in</strong>fall <strong><strong>an</strong>d</strong> <strong>runoff</strong> relationship for different<br />
tillage systems dur<strong>in</strong>g the Fallow Period with 20% cover. The first<br />
two letters of the treatments <strong>in</strong>dicate type of tillage ± ZT: Zero; ST:<br />
Shallow; DT: Deep; The last letter is the type of amendment ± B:<br />
Bare no amendments; F: Amended with 15 Mg ha 1 yr 1 farmyard<br />
m<strong>an</strong>ure; S: Amended with 5 Mg ha 1 yr 1 rice straw.<br />
structure <strong><strong>an</strong>d</strong> <strong>in</strong>®ltration rate. The addition of farmyard<br />
m<strong>an</strong>ure had no effect under deep tillage <strong><strong>an</strong>d</strong><br />
<strong>runoff</strong> with the DTF system was similar to that with<br />
the DTB system. Structural amelioration with farmyard<br />
m<strong>an</strong>ure was more evident under shallow tillage.<br />
This is attributed to the dilution of org<strong>an</strong>ic matter<br />
content through mix<strong>in</strong>g of soil to a greater depth under<br />
deep tillage. The effect of rice straw was very similar<br />
under both shallow <strong><strong>an</strong>d</strong> deep tillage.
3.3. Crop period 1 (<strong>from</strong> tillage to 150 mm ra<strong>in</strong><br />
after tillage)<br />
Runoff with the ZTB system <strong>in</strong> this period was<br />
similar to that dur<strong>in</strong>g the fallow period (<strong>in</strong> both<br />
periods, 35% of ra<strong>in</strong>fall was lost as <strong>runoff</strong>). Amendments<br />
<strong><strong>an</strong>d</strong> tillage were effective dur<strong>in</strong>g this period as<br />
evidenced by low <strong>runoff</strong> volumes (Table 1). The<br />
gradual <strong>in</strong>crease <strong>in</strong> the rate of <strong>runoff</strong> with tilled<br />
systems c<strong>an</strong> best be illustrated by the ra<strong>in</strong>fall-<strong>runoff</strong><br />
data of the 115 mm ra<strong>in</strong>storm that occurred a few days<br />
after tillage <strong>in</strong> 1989 (Fig. 3). At the beg<strong>in</strong>n<strong>in</strong>g of the<br />
storm, the zero tillage system with all amendments<br />
resulted <strong>in</strong> a higher <strong>runoff</strong> rate th<strong>an</strong> the tilled system<br />
with the same amendments. However, as the storm<br />
progressed, <strong>runoff</strong> rates became nearly equal. Tilled<br />
systems also resulted <strong>in</strong> a greater amount of ra<strong>in</strong>fall<br />
before <strong>runoff</strong> started compared to the zero tilled<br />
K.P.C. Rao et al. / Soil & Tillage Research 48 (1998) 61±69 65<br />
Fig. 3. Rate of <strong>runoff</strong> dur<strong>in</strong>g a 115 mm ra<strong>in</strong>storm shortly after tillage for: (a) tillage systems without amendments, (b) farmyard m<strong>an</strong>ure<br />
systems, <strong><strong>an</strong>d</strong> (c) rice straw systems.<br />
system: Runoff started <strong>from</strong> the ZTB, STB, <strong><strong>an</strong>d</strong><br />
DTB system plots after 7.9, 22.0, <strong><strong>an</strong>d</strong> 32.0 mm of<br />
ra<strong>in</strong>fall, respectively (Fig. 3a). Runoff rates with the<br />
three systems were almost equal after approximately<br />
105 mm of ra<strong>in</strong>fall. Runoff rate <strong>from</strong> the DTB system<br />
plot was less th<strong>an</strong> that <strong>from</strong> the STB system plot<br />
dur<strong>in</strong>g the ®rst 40 mm of ra<strong>in</strong>fall. For farmyard m<strong>an</strong>ure<br />
systems, <strong>runoff</strong> due to the three tillage methods<br />
was similar after about 80 mm of ra<strong>in</strong>fall (Fig. 3b).<br />
For the ®rst 65 mm of ra<strong>in</strong>, rates of <strong>runoff</strong> were lower<br />
<strong>from</strong> DTF system plot. Thereafter, the <strong>runoff</strong> pattern<br />
was similar with the STF <strong><strong>an</strong>d</strong> DTF systems. Straw<br />
systems resulted <strong>in</strong> longer times before <strong>runoff</strong> started<br />
<strong><strong>an</strong>d</strong> lower <strong>runoff</strong> rates (Fig. 3c). The effect of different<br />
tillage methods persisted through the entire storm.<br />
The <strong>in</strong>®ltration rate for the STB system is plotted<br />
aga<strong>in</strong>st cumulative ra<strong>in</strong>fall s<strong>in</strong>ce tillage <strong>in</strong> Fig. 4. The<br />
<strong>in</strong>®ltration rates were obta<strong>in</strong>ed <strong>from</strong> the ra<strong>in</strong>fall <strong><strong>an</strong>d</strong>
66 K.P.C. Rao et al. / Soil & Tillage Research 48 (1998) 61±69<br />
Fig. 4. Infiltration rate as a function of cumulative ra<strong>in</strong>fall for the<br />
shallow tilled system without amendments (STB).<br />
<strong>runoff</strong> hydrographs of the events that occurred <strong>from</strong><br />
the date of tillage up to when the accumulated ra<strong>in</strong>fall<br />
equaled 150 mm. The <strong>in</strong>®ltration rate for freshly tilled<br />
soil is dif®cult to obta<strong>in</strong> by this method as the ®rst<br />
ra<strong>in</strong>s normally do not result <strong>in</strong> <strong>runoff</strong>. Consequently,<br />
the <strong>in</strong>®ltration rate without a crust at the time of<br />
pl<strong>an</strong>t<strong>in</strong>g was measured with the double r<strong>in</strong>g <strong>in</strong>®ltrometer<br />
(Bajracharya et al., 1996).<br />
The decl<strong>in</strong>e <strong>in</strong> <strong>in</strong>®ltration rate as shown <strong>in</strong> Fig. 4 is<br />
often described by <strong>an</strong> exponential equation as a function<br />
of time (Horton, 1940). Mor<strong>in</strong> <strong><strong>an</strong>d</strong> Benyam<strong>in</strong>i<br />
(1977) used cumulative ra<strong>in</strong>fall <strong>in</strong>stead of time,<br />
viz<br />
it ˆ if ‡ …ii if†exp… b R† (1)<br />
where it is <strong>in</strong>®ltration rate at time t (mm h 1 ); ii is<br />
<strong>in</strong>itial <strong>in</strong>®ltration rate at tillage (mm h 1 ); ifˆ®nal<br />
<strong>in</strong>®ltration rate (mm h 1 ); bˆempirical const<strong>an</strong>t;<br />
Rˆcumulative ra<strong>in</strong>fall s<strong>in</strong>ce tillage (mm).<br />
From Eq. (1), tak<strong>in</strong>g the ®nal <strong>in</strong>®ltration rate, if, of<br />
9.6 mm h 1 <strong>from</strong> Part I (Rao et al., 1998) <strong><strong>an</strong>d</strong> by<br />
l<strong>in</strong>early regress<strong>in</strong>g the natural log of the <strong>in</strong>®ltration<br />
rate <strong><strong>an</strong>d</strong> cumulative ra<strong>in</strong>fall s<strong>in</strong>ce tillage we ®nd <strong>an</strong><br />
<strong>in</strong>itial <strong>in</strong>®ltration rate of 610 mm h 1 <strong><strong>an</strong>d</strong> bˆ0.0757.<br />
The <strong>in</strong>®ltration rate for the ZTB system c<strong>an</strong> then be<br />
expressed as:<br />
it ˆ 9:6 ‡ 600:4 exp… 0:0757 R† (2)<br />
The DTB systems had a slightly higher <strong>in</strong>®ltration<br />
rates dur<strong>in</strong>g the ®rst ra<strong>in</strong>s, but the reduction <strong>in</strong> <strong>in</strong>®ltration<br />
rate over time was very similar to the STB<br />
system.<br />
Table 3<br />
Regression equations for <strong>runoff</strong> <strong>from</strong> different systems dur<strong>in</strong>g Crop<br />
Period 1 (tillage to 150 mm ra<strong>in</strong> after tillage) (Nˆ150)<br />
Treatment Equation R 2<br />
STB Qˆ0.482*P 4.640 0.843<br />
STF Qˆ0.498*PI30 0.652 0.916<br />
STS Qˆ0.309*PI30 0.823 0.744<br />
DTB Qˆ0.401*P 3.706 0.816<br />
DTF Qˆ0.370*PI30 0.100 0.792<br />
DTS Qˆ0.162*PI30 0.330 0.711<br />
Legend: Qˆevent <strong>runoff</strong> (mm); Pˆevent ra<strong>in</strong>fall (mm); PI30ˆ<br />
product of ra<strong>in</strong>fall <strong>in</strong> mm; <strong><strong>an</strong>d</strong> 30 m<strong>in</strong> <strong>in</strong>tensity divided by one<br />
hundred; The first two letters of the treatments <strong>in</strong>dicate type of<br />
tillage ± ZT: Zero; ST: Shallow; DT: Deep; The last letter is<br />
the type of amendment ± B: Bare no amendments; F: Amended<br />
with 15 Mg ha 1 yr 1 farmyard m<strong>an</strong>ure; S: Amended with<br />
5 Mg ha 1 yr 1 rice straw.<br />
The amount of ra<strong>in</strong>fall <strong><strong>an</strong>d</strong> product of ra<strong>in</strong>fall<br />
amount <strong><strong>an</strong>d</strong> 30 m<strong>in</strong> ra<strong>in</strong>fall <strong>in</strong>tensity were positively<br />
correlated with <strong>runoff</strong> dur<strong>in</strong>g this period. While ra<strong>in</strong>fall<br />
amount correlated well with <strong>runoff</strong> <strong>from</strong> bare<br />
system (STB <strong><strong>an</strong>d</strong> DTB) plots, the product of ra<strong>in</strong>fall<br />
amount <strong><strong>an</strong>d</strong> 30 m<strong>in</strong> <strong>in</strong>tensity were correlated with<br />
<strong>runoff</strong> <strong>from</strong> amended system (STF, STS, DTF, <strong><strong>an</strong>d</strong><br />
DTS) plots. Simple regression equations <strong>in</strong>volv<strong>in</strong>g<br />
these variables expla<strong>in</strong>ed 71 to 92% of the variation<br />
<strong>in</strong> <strong>runoff</strong> <strong>from</strong> the different system plots (Table 3).<br />
The relationships between ra<strong>in</strong>fall <strong><strong>an</strong>d</strong> <strong>runoff</strong> for <strong>an</strong><br />
average <strong>in</strong>tensity of 20 mm h 1 <strong>in</strong>dicate signi®c<strong>an</strong>t<br />
differences <strong>in</strong> <strong>runoff</strong> <strong>from</strong> bare system plots compared<br />
to that <strong>from</strong> amended system plots (Fig. 5). Both<br />
shallow <strong><strong>an</strong>d</strong> deep tillage reduced <strong>runoff</strong> compared<br />
to ZTB. The effect of tillage depth was relatively<br />
small with shallow tillage result<strong>in</strong>g <strong>in</strong> higher <strong>runoff</strong>.<br />
3.4. Crop period 2 (<strong>from</strong> 150 mm ra<strong>in</strong>fall s<strong>in</strong>ce<br />
tillage to harvest)<br />
Runoff <strong>from</strong> the ZTB system plots was about 24%<br />
of the ra<strong>in</strong>fall compared to 35% dur<strong>in</strong>g the other<br />
periods. Tilled systems without amendment (DTB<br />
<strong><strong>an</strong>d</strong> STB) resulted <strong>in</strong> <strong>runoff</strong> similar to the no-tilled<br />
systems (ZTB) while <strong>runoff</strong> <strong>from</strong> amended system<br />
plots was lower. Runoff <strong>from</strong> system plots amended<br />
with farmyard m<strong>an</strong>ure (DTF <strong><strong>an</strong>d</strong> STF) was 40% to<br />
47% of that <strong>from</strong> the ZTB system plots <strong><strong>an</strong>d</strong> that <strong>from</strong><br />
the straw plot was 21% to 26% of that <strong>from</strong> the ZTB<br />
system plot.
Fig. 5. Predicted ra<strong>in</strong>fall <strong><strong>an</strong>d</strong> <strong>runoff</strong> relationship for different<br />
tillage systems dur<strong>in</strong>g Crop Period 1 (first tillage up to 150 mm<br />
cumulative ra<strong>in</strong>fall) for storms with <strong>an</strong> average 30 m<strong>in</strong> <strong>in</strong>tensity<br />
of 20 mm h 1 . The first two letters of the treatments <strong>in</strong>dicate type<br />
of tillage ± ZT: Zero; ST: Shallow; DT: Deep; The last letter is<br />
the type of amendment ± B: Bare no amendments; F: Amended<br />
with 15 Mg ha 1 yr 1 farmyard m<strong>an</strong>ure; S: Amended with<br />
5 Mg ha 1 yr 1 rice straw.<br />
Among the variables tested, the product of ra<strong>in</strong>fall<br />
amount <strong><strong>an</strong>d</strong> 30 m<strong>in</strong> <strong>in</strong>tensity resulted <strong>in</strong> the highest<br />
correlation with <strong>runoff</strong> for all systems. Best ®t regression<br />
equations for different systems are summarized <strong>in</strong><br />
Table 4 <strong><strong>an</strong>d</strong> their slopes (us<strong>in</strong>g <strong>an</strong> average 30 m<strong>in</strong><br />
ra<strong>in</strong>fall <strong>in</strong>tensity of 20 mm h 1 ) are compared <strong>in</strong><br />
Fig. 6. The equations expla<strong>in</strong>ed <strong>from</strong> 73% to 83%<br />
of the variation <strong>in</strong> <strong>runoff</strong>. Better relation between<br />
Table 4<br />
Regression equations for <strong>runoff</strong> <strong>from</strong> different systems dur<strong>in</strong>g Crop<br />
Period 2 (<strong>from</strong> 150 mm ra<strong>in</strong>fall s<strong>in</strong>ce tillage to harvest of crop)<br />
(Nˆ291)<br />
Treatment Equation R 2<br />
STB Qˆ0.783*PI30‡0.531 0.789<br />
STF Qˆ0.704*PI30 1.129 0.834<br />
STS Qˆ0.544*PI30 1.292 0.767<br />
DTB Qˆ0.709*PI30‡0.411 0.728<br />
DTF Qˆ0.464*PI30 0.409 0.745<br />
DTS Qˆ0.364*PI30 0.685 0.729<br />
Legend: Qˆevent <strong>runoff</strong> (mm); PI30ˆproduct of ra<strong>in</strong>fall <strong>in</strong> mm;<br />
<strong><strong>an</strong>d</strong> 30 m<strong>in</strong> <strong>in</strong>tensity divided by one hundred; The first two letters<br />
of the treatments <strong>in</strong>dicate type of tillage ± ZT: Zero; ST: Shallow;<br />
DT: Deep; The last letter is the type of amendment ± B: Bare no<br />
amendments; F: Amended with 15 Mg ha 1 yr 1 farmyard m<strong>an</strong>ure;<br />
S: Amended with 5 Mg ha 1 yr 1 rice straw.<br />
K.P.C. Rao et al. / Soil & Tillage Research 48 (1998) 61±69 67<br />
Fig. 6. Predicted ra<strong>in</strong>fall <strong><strong>an</strong>d</strong> <strong>runoff</strong> relationship for different<br />
tillage systems dur<strong>in</strong>g Crop Period 2 (150 mm cumulative ra<strong>in</strong>fall<br />
up to harvest) for storms with <strong>an</strong> average 30 m<strong>in</strong> <strong>in</strong>tensity of<br />
20 mm h 1 . The first two letters of the treatments <strong>in</strong>dicate type<br />
of tillage ± ZT: Zero; ST: Shallow; DT: Deep; The last letter is<br />
the type of amendment ± B: Bare no amendments; F: Amended<br />
with 15 Mg ha 1 yr 1 farmyard m<strong>an</strong>ure; S: Amended with<br />
5 Mg ha 1 yr 1 rice straw.<br />
<strong>runoff</strong> <strong><strong>an</strong>d</strong> the product of ra<strong>in</strong>fall amount <strong><strong>an</strong>d</strong><br />
30 m<strong>in</strong> <strong>in</strong>tensity <strong>in</strong>dicate that the <strong>in</strong>®ltration rates<br />
were higher (Rao et al., 1998). This is attributed to<br />
the high percentage of crop cover.<br />
4. Implications for soil m<strong>an</strong>agement<br />
Crop production on Al®sols <strong>in</strong> <strong>semi</strong>-<strong>arid</strong> tropics c<strong>an</strong><br />
be improved by <strong>in</strong>creas<strong>in</strong>g the amount of soil water<br />
available to the pl<strong>an</strong>ts. <strong>Ra<strong>in</strong>fall</strong> is the only source of<br />
water <strong><strong>an</strong>d</strong> loss of ra<strong>in</strong>water as <strong>runoff</strong> needs to be<br />
m<strong>in</strong>imized. Runoff occurs on Al®sols whenever ra<strong>in</strong>fall<br />
<strong>in</strong>tensities exceed the <strong>in</strong>®ltration rate of the soil<br />
(Mor<strong>in</strong>, 1993). Hence, soil m<strong>an</strong>agement options<br />
should <strong>in</strong>clude practices that ma<strong>in</strong>ta<strong>in</strong> high <strong>in</strong>®ltration<br />
rates. Because for crusted soils the <strong>in</strong>®ltration rate<br />
becomes const<strong>an</strong>t shortly after the ra<strong>in</strong>fall starts, it is<br />
possible to estimate the fraction of ra<strong>in</strong> that runs off by<br />
calculat<strong>in</strong>g a portion of ra<strong>in</strong>fall <strong>in</strong> excess of <strong>in</strong>®ltration<br />
rates of the soil. This is demonstrated below.<br />
First, the ra<strong>in</strong>fall amount <strong>in</strong> excess of a given<br />
<strong>in</strong>tensity for all storms between 1989 <strong><strong>an</strong>d</strong> 1994 was<br />
calculated <strong>from</strong> 5 m<strong>in</strong> totals. The results are plotted <strong>in</strong><br />
Fig. 7, which is a plot of the percent of total ra<strong>in</strong>fall
68 K.P.C. Rao et al. / Soil & Tillage Research 48 (1998) 61±69<br />
Fig. 7. Relationship of the percentage of total ra<strong>in</strong>fall <strong>in</strong> excess of<br />
a given <strong>in</strong>tensity.<br />
that occurred <strong>in</strong> excess of a given <strong>in</strong>tensity. Thus, for<br />
example <strong>in</strong> 1989, 45% of the total amount of ra<strong>in</strong><br />
exceeded <strong>an</strong> <strong>in</strong>tensity of 10 mm h 1 <strong><strong>an</strong>d</strong> 10% was<br />
above <strong>an</strong> <strong>in</strong>tensity of 50 mm h 1 . Next, the <strong>in</strong>®ltration<br />
rate of the soil is estimated by assum<strong>in</strong>g that ra<strong>in</strong>fall<br />
<strong>in</strong>tensity at which the fraction of ra<strong>in</strong>fall (<strong>in</strong> excess of<br />
that ra<strong>in</strong>fall <strong>in</strong>tensity) is equal to the fraction of ra<strong>in</strong>water<br />
that runs off <strong>in</strong> Fig. 7. To test this assumption,<br />
we used the zero tillage system without amendments<br />
(ZTB) for which the <strong>in</strong>®ltration rate of the soil was<br />
9.6 mm h 1 (Rao et al., 1998). From Table 1 we ®nd<br />
that the amount of <strong>runoff</strong> for the ZTB system is<br />
approximately 30% of the total ra<strong>in</strong>fall amount, which<br />
corresponds reasonably well with a ra<strong>in</strong>fall <strong>in</strong>tensity<br />
<strong>in</strong> excess of 10 mm h 1 (Fig. 7). Thus, <strong>in</strong>deed the<br />
<strong>in</strong>®ltration rate of crusted soils may be estimated by<br />
the ra<strong>in</strong>fall <strong>in</strong>tensity where the portion of total ra<strong>in</strong>fall<br />
<strong>in</strong> excess of that <strong>in</strong>tensity is equal to the (measured)<br />
portion of ra<strong>in</strong> runn<strong>in</strong>g off.<br />
We c<strong>an</strong> now estimate the <strong>in</strong>®ltration rate for the<br />
systems with amendments us<strong>in</strong>g Table 1 <strong><strong>an</strong>d</strong> Fig. 7.<br />
The <strong>runoff</strong> <strong>from</strong> farmyard m<strong>an</strong>ure systems was<br />
approximately 16% of the total ra<strong>in</strong>fall (Table 1)<br />
<strong><strong>an</strong>d</strong> represents ra<strong>in</strong>fall <strong>in</strong> excess of 23 mm h 1 <strong>in</strong>tensity<br />
(Fig. 7). We expect, therefore, the <strong>in</strong>®ltration<br />
rate for the soil with m<strong>an</strong>ure amendments to be<br />
23 mm h 1 . Similarly, the 10% <strong>runoff</strong> <strong>from</strong> straw<br />
systems (Table 1) equals the <strong>in</strong>®ltration rate of<br />
32 mm h 1 <strong>in</strong>tensity. Thus, straw is, by far, the most<br />
effective m<strong>an</strong>agement practice to <strong>in</strong>crease the <strong>in</strong>®ltra-<br />
tion rate (a three-fold <strong>in</strong>crease above the systems<br />
without amendments).<br />
It may not be possible to elim<strong>in</strong>ate <strong>runoff</strong> completely,<br />
consider<strong>in</strong>g the occasional <strong>in</strong>tensities of exceed<strong>in</strong>g<br />
100 mm h 1 (far <strong>in</strong> excess of the <strong>in</strong>®ltration rate<br />
under straw). An <strong>an</strong>alysis of ra<strong>in</strong>fall excess distribution<br />
at small time <strong>in</strong>tervals is very useful <strong>in</strong> identify<strong>in</strong>g<br />
the potential <strong>runoff</strong>. Soil m<strong>an</strong>agement options c<strong>an</strong><br />
then be tailored to reduce <strong>runoff</strong> to desired levels<br />
by m<strong>an</strong>ipulat<strong>in</strong>g the <strong>in</strong>®ltration rate or by creat<strong>in</strong>g<br />
surface storage.<br />
5. Conclusions<br />
The <strong>an</strong>alysis of data reported here <strong><strong>an</strong>d</strong> <strong>in</strong> Part I (Rao<br />
et al., 1998) clearly <strong>in</strong>dicates that a surface crust is the<br />
major factor that limits <strong>in</strong>®ltration rates for Al®sols of<br />
<strong>semi</strong>-<strong>arid</strong> <strong>tropical</strong> India. Effectiveness of m<strong>an</strong>agement<br />
practices <strong>in</strong> reduc<strong>in</strong>g <strong>runoff</strong>, therefore, depends on the<br />
ability to reduce the formation of crusts. The conventional<br />
practice of tillage to mech<strong>an</strong>ically break the<br />
crust has little long-term impact <strong>in</strong> <strong>in</strong>creas<strong>in</strong>g <strong>in</strong>®ltration<br />
rate as the effect of tillage is soon lost with the<br />
formation of a surface crust after a few ra<strong>in</strong>falls.<br />
Amendments offer a susta<strong>in</strong>able way to improve<br />
<strong>in</strong>®ltration rates but is constra<strong>in</strong>ed by the availability<br />
of the material that may have other uses like fuel <strong><strong>an</strong>d</strong><br />
fodder. There is a need to develop alternative methods<br />
to improve the org<strong>an</strong>ic matter content of the soil<br />
<strong><strong>an</strong>d</strong> the structural stability of the soil that are required<br />
to ma<strong>in</strong>ta<strong>in</strong> high <strong>in</strong>®ltration rates. Systems like perennial±<strong>an</strong>nual<br />
rotations <strong><strong>an</strong>d</strong> agro-forestry hold promise.<br />
Acknowledgements<br />
We wish to acknowledge the help received <strong>from</strong> the<br />
®eld staff: N. Ramasamy, G.P. Kumar, M.M. Ali, P.J.<br />
George, P. Kistaiah, P. Rajaiah, <strong><strong>an</strong>d</strong> L.S. J<strong>an</strong>gawad of<br />
the Soil <strong><strong>an</strong>d</strong> Agroclimatology Division at ICRISAT,<br />
Asia Center, <strong>in</strong> ma<strong>in</strong>ta<strong>in</strong><strong>in</strong>g <strong><strong>an</strong>d</strong> operat<strong>in</strong>g the experiment.<br />
The reviewers were very helpful <strong>in</strong> clarify<strong>in</strong>g<br />
the text. The senior author was at Cornell University<br />
dur<strong>in</strong>g data <strong>an</strong>alysis with support of a Frosty Hill<br />
Fellowship. The authors also acknowledge the valuable<br />
role of Mrs. Betty Czarniecki <strong>in</strong> edit<strong>in</strong>g <strong><strong>an</strong>d</strong><br />
prepar<strong>in</strong>g the m<strong>an</strong>uscript.
References<br />
Bajracharya, R.M., Cogle, A.L., Lal, R., Rao, K.P.C., Smith, G.D.,<br />
Yule, D.F., 1996. Surface crust<strong>in</strong>g as a constra<strong>in</strong>t to soil<br />
m<strong>an</strong>agement on a <strong>tropical</strong> <strong>Alfisol</strong>. I. Soil physical properties. J.<br />
Susta<strong>in</strong>able Agriculture 8, 25±44.<br />
Hoogmoed, W.B., Stroosnijder, L., 1984. Crust formation on s<strong><strong>an</strong>d</strong>y<br />
soils <strong>in</strong> the Sahel. I. <strong>Ra<strong>in</strong>fall</strong> <strong><strong>an</strong>d</strong> <strong><strong>in</strong>filtration</strong>. Soil Tillage Res.<br />
4, 5±23.<br />
Horton, R.E., 1940. An approach toward a physical <strong>in</strong>terpretation<br />
of <strong><strong>in</strong>filtration</strong> capacity. Soil Sci. Soc. Am. Proc. 5, 399±417.<br />
Laryea, K.B., Pathak, P., Klaij, M.C., 1991. Tillage systems <strong><strong>an</strong>d</strong><br />
soils <strong>in</strong> the <strong>semi</strong>-<strong>arid</strong> tropics. Soil Tillage Res. 20, 201±<br />
218.<br />
Mead, J.A., Ch<strong>an</strong>, K.Y., 1988. Effect of deep tillage <strong><strong>an</strong>d</strong> seed bed<br />
preparation on the growth <strong><strong>an</strong>d</strong> yield of wheat on a hard sett<strong>in</strong>g<br />
soil. Aust. J. Exp. Agric. 28, 491±498.<br />
Mor<strong>in</strong>, J., 1993. <strong>Ra<strong>in</strong>fall</strong> for tillage m<strong>an</strong>agement decisions. Soil<br />
Tillage Res. 27, 241±252.<br />
Mor<strong>in</strong>, Y., Benyam<strong>in</strong>i, Y., 1977. <strong>Ra<strong>in</strong>fall</strong> <strong><strong>in</strong>filtration</strong> <strong>in</strong>to bare soils.<br />
Water Resour. Res. 13, 813±817.<br />
Pathak, P., S<strong>in</strong>gh, S., Sudi, R., 1987. Soil <strong><strong>an</strong>d</strong> water m<strong>an</strong>agement<br />
alternatives for <strong>in</strong>creased productivity on SAT <strong>Alfisol</strong>s. Soil<br />
Conservation <strong><strong>an</strong>d</strong> Productivity. Proceed<strong>in</strong>gs of the IV International<br />
Conference on Soil Conservation. Soil Conservation<br />
Society of Venezuela, pp. 533±550.<br />
K.P.C. Rao et al. / Soil & Tillage Research 48 (1998) 61±69 69<br />
Rao, K.P.C., Steenhuis, T.S., Cogle, A.L., Sr<strong>in</strong>ivas<strong>an</strong>, S.T., Yule,<br />
D.F., Smith, G.D., 1998. <strong>Ra<strong>in</strong>fall</strong> <strong><strong>in</strong>filtration</strong> <strong><strong>an</strong>d</strong> <strong>runoff</strong> <strong>from</strong> <strong>an</strong><br />
alfisol <strong>in</strong> <strong>semi</strong> <strong>arid</strong> <strong>tropical</strong> India, I. No-till systems. Soil<br />
Tillage Res., (this issue).<br />
Smith, G.D., Thomas, N.P., 1988. Monitor<strong>in</strong>g small plot <strong>runoff</strong><br />
with tipp<strong>in</strong>g buckets. Indi<strong>an</strong> J. Dryl<strong><strong>an</strong>d</strong> Agric. Res. Dev. 3,<br />
159±165.<br />
Smith, G.D., Coughl<strong>an</strong>, K.J., Yule, D.F., Laryea, K.B., Srivastava,<br />
K.L., Thomas, N.P., Cogle, A.L., 1992. Soil m<strong>an</strong>agement<br />
options to reduce <strong>runoff</strong> <strong><strong>an</strong>d</strong> erosion on <strong>an</strong> hard sett<strong>in</strong>g <strong>Alfisol</strong><br />
<strong>in</strong> the <strong>semi</strong>-<strong>arid</strong> tropics. Soil Tillage Res. 25, 195±215.<br />
Tisdall, J.M., Oades, J.M., 1982. Org<strong>an</strong>ic matter <strong><strong>an</strong>d</strong> water stable<br />
aggregates <strong>in</strong> soil. J. Soil Sci. 33, 141±163.<br />
Venkateswarlu, J., 1987. Effect of resource m<strong>an</strong>agement systems<br />
for dryl<strong><strong>an</strong>d</strong>s of India. In: Stewart, B.A. (Ed.), Adv<strong>an</strong>ces <strong>in</strong> Soil<br />
Sci. 7, 165±221.<br />
Vijayalakshmi, K., 1987. Soil m<strong>an</strong>agement for <strong>in</strong>creas<strong>in</strong>g productivity<br />
<strong>in</strong> <strong>semi</strong>-<strong>arid</strong> red soils: Physical aspects. <strong>Alfisol</strong>s <strong>in</strong> the<br />
Semi-Arid Tropics. Proceed<strong>in</strong>gs of the Consultative Workshop<br />
on the State of the Art <strong><strong>an</strong>d</strong> M<strong>an</strong>agement Alternatives for<br />
Optimiz<strong>in</strong>g the Productivity of SAT <strong>Alfisol</strong>s <strong><strong>an</strong>d</strong> Related Soils.<br />
International Crops Research Institute for the Semi-Arid<br />
Tropics Center, Pat<strong>an</strong>cheru, AP, India, pp. 115±121.<br />
Yule, D.F., Cogle, A.L., Smith, G.D., Rao, K.P.C., George, P.J.,<br />
1992. Soil m<strong>an</strong>agement of <strong>Alfisol</strong>s for water conservation <strong><strong>an</strong>d</strong><br />
utilization. J. Indi<strong>an</strong> Water Resources Soc. 4, 10±13.