Part 4 - Berg - Hughes Center
Part 4 - Berg - Hughes Center
Part 4 - Berg - Hughes Center
SHOW LESS

You also want an ePaper? Increase the reach of your titles
YUMPU automatically turns print PDFs into web optimized ePapers that Google loves.
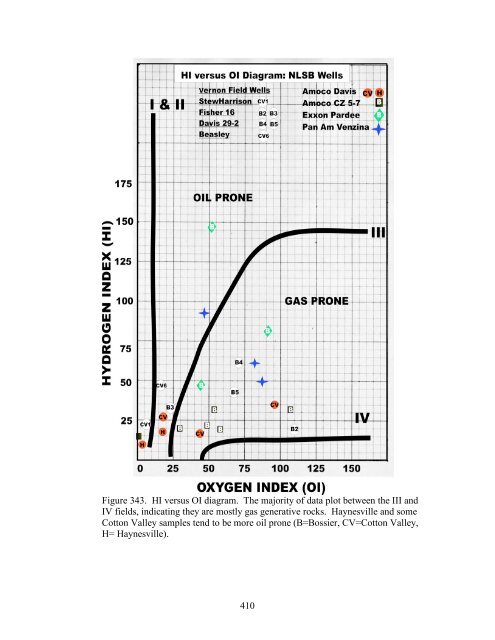
Figure 343. HI versus OI diagram. The majority of data plot between the III and<br />
IV fields, indicating they are mostly gas generative rocks. Haynesville and some<br />
Cotton Valley samples tend to be more oil prone (B=Bossier, CV=Cotton Valley,<br />
H= Haynesville).<br />
410