Maple Quick Reference Card - University of Michigan
Maple Quick Reference Card - University of Michigan
Maple Quick Reference Card - University of Michigan

You also want an ePaper? Increase the reach of your titles
YUMPU automatically turns print PDFs into web optimized ePapers that Google loves.
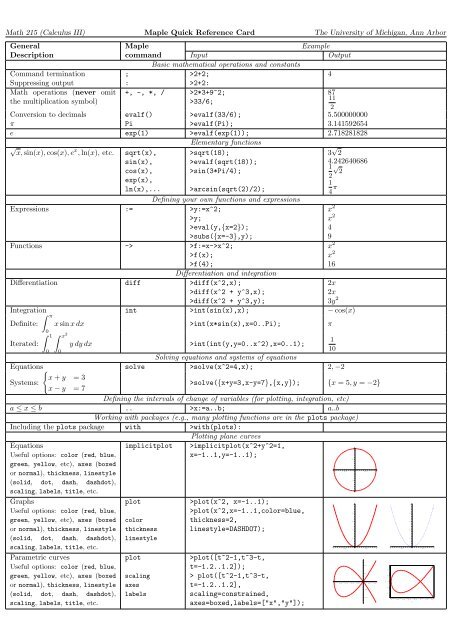
Math 215 (Calculus III) <strong>Maple</strong> <strong>Quick</strong> <strong>Reference</strong> <strong>Card</strong> The <strong>University</strong> <strong>of</strong> <strong>Michigan</strong>, Ann Arbor<br />
General <strong>Maple</strong> Example<br />
Description command Input Output<br />
Basic mathematical operations and constants<br />
Command termination ; >2+2; 4<br />
Suppressing output : >2+2:<br />
Math operations (never omit<br />
the multiplication symbol)<br />
+, -, *, / >2*3+9^2;<br />
>33/6;<br />
Conversion to decimals evalf() >evalf(33/6); 5.500000000<br />
π Pi >evalf(Pi); 3.141592654<br />
e exp(1) >evalf(exp(1)); 2.718281828<br />
√ x<br />
x, sin(x), cos(x), e , ln(x), etc. sqrt(x),<br />
sin(x),<br />
cos(x),<br />
exp(x),<br />
ln(x),...<br />
Elementary functions<br />
>sqrt(18);<br />
>evalf(sqrt(18));<br />
>sin(3*Pi/4);<br />
>arcsin(sqrt(2)/2);<br />
Expressions :=<br />
Defining your own functions and expressions<br />
>y:=x^2;<br />
>y;<br />
>eval(y,{x=2});<br />
>subs({x=-3},y);<br />
Functions -> >f:=x->x^2;<br />
>f(x);<br />
>f(4);<br />
Differentiation diff<br />
Differentiation and integration<br />
>diff(x^2,x);<br />
>diff(x^2 + y^3,x);<br />
>diff(x^2 + y^3,y);<br />
87<br />
11<br />
2<br />
3 √ 2<br />
4.242640686<br />
1 √<br />
2<br />
2<br />
1<br />
4 π<br />
Integration int >int(sin(x),x); − cos(x)<br />
π<br />
Definite: x sin x dx >int(x*sin(x),x=0..Pi); π<br />
0 1 2<br />
x<br />
Iterated: y dy dx<br />
0 0<br />
>int(int(y,y=0..x^2),x=0..1);<br />
Solving equations and systems <strong>of</strong> equations<br />
1<br />
10<br />
Equations solve >solve(x^2=4,x); 2, −2<br />
Systems:<br />
x + y<br />
x − y<br />
= 3<br />
= 7<br />
>solve({x+y=3,x-y=7},{x,y}); {x = 5, y = −2}<br />
Defining the intervals <strong>of</strong> change <strong>of</strong> variables (for plotting, integration, etc)<br />
a ≤ x ≤ b .. >x:=a..b; a..b<br />
Working with packages (e.g., many plotting functions are in the plots package)<br />
Including the plots package with >with(plots):<br />
Plotting plane curves<br />
Equations<br />
implicitplot >implicitplot(x^2+y^2=1,<br />
1<br />
Useful options: color (red, blue,<br />
x=-1..1,y=-1..1);<br />
green, yellow, etc), axes (boxed<br />
0.5<br />
or normal), thickness, linestyle<br />
-1<br />
-0.5<br />
y 0<br />
0<br />
x<br />
0.5<br />
1<br />
(solid, dot, dash, dashdot),<br />
-0.5<br />
scaling, labels, title, etc.<br />
-1<br />
Graphs<br />
plot<br />
>plot(x^2, x=-1..1);<br />
1<br />
Useful options: color (red, blue,<br />
>plot(x^2,x=-1..1,color=blue,<br />
0.8<br />
green, yellow, etc), axes (boxed color<br />
thickness=2,<br />
0.6<br />
or normal), thickness, linestyle thickness linestyle=DASHDOT);<br />
0.4<br />
(solid, dot, dash, dashdot), linestyle<br />
0.2<br />
scaling, labels, title, etc.<br />
-1 -0.5<br />
0<br />
0<br />
x<br />
0.5<br />
1<br />
Parametric curves<br />
plot<br />
>plot([t^2-1,t^3-t,<br />
Useful options: color (red, blue,<br />
t=-1.2..1.2]);<br />
0.4<br />
green, yellow, etc), axes (boxed scaling<br />
> plot([t^2-1,t^3-t,<br />
0.2<br />
or normal), thickness, linestyle axes<br />
t=-1.2..1.2],<br />
-1 -0.8 -0.6 -0.4 -0.2<br />
0<br />
0 0.2 0.4<br />
y<br />
(solid, dot, dash, dashdot), labels<br />
scaling=constrained,<br />
-0.2<br />
-0.4<br />
scaling, labels, title, etc.<br />
axes=boxed,labels=["x","y"]);<br />
x 2<br />
x 2<br />
4<br />
9<br />
x 2<br />
x 2<br />
16<br />
2x<br />
2x<br />
3y 2<br />
0.4<br />
0.2<br />
0<br />
-0.2<br />
-0.4<br />
-1 -0.5<br />
1<br />
0.8<br />
0.6<br />
0.4<br />
0.2<br />
0<br />
0<br />
x<br />
0.5<br />
-1 -0.8 -0.6 -0.4 -0.2 0 0.2 0.4<br />
x<br />
1
Parametric curves<br />
Useful options: color (red, blue,<br />
green, yellow, etc), axes (boxed<br />
or normal), thickness, linestyle<br />
(solid, dot, dash, dashdot),<br />
scaling, labels, title, etc.<br />
Equations<br />
Useful options: color, axes,<br />
style (wireframe, patchnogrid,<br />
contour, patchcontour), scaling,<br />
numpoints, orientation, labels,<br />
title, etc.<br />
Graphs<br />
Useful options: color, axes,<br />
style (wireframe, patchnogrid,<br />
contour, patchcontour), scaling,<br />
numpoints, orientation, labels,<br />
title, etc.<br />
Parametric surfaces<br />
Useful options: color, axes,<br />
style (wireframe, patchnogrid,<br />
contour, patchcontour), scaling,<br />
numpoints, orientation, labels,<br />
title, etc.<br />
Level curves<br />
Useful options: color, filled<br />
(true or false), contours<br />
(either number <strong>of</strong> contours,<br />
contours=20, or level values,<br />
contours=[-2,-1,0,3,5]), etc.<br />
Gradient fields ∇f<br />
General vector fileds<br />
Useful options: color, scaling<br />
(constrained or unconstrained),<br />
arrows (LINE, THIN, SLIM, THICK),<br />
grid, etc.<br />
Combining plots by first assigning<br />
them to expressions and then<br />
using the display command.<br />
Important: Always use : when<br />
you assign plots to expressions.<br />
Note: Both [] and {} can be<br />
used in the display command.<br />
It is also possible to combine<br />
plots directly in the display<br />
command.<br />
spacecurve<br />
color<br />
thickness<br />
axes<br />
implicitplot3d<br />
axes<br />
style<br />
title<br />
plot3d<br />
axes<br />
style<br />
plot3d<br />
axes<br />
numpoints,<br />
orientation<br />
contourplot<br />
contourplot3d<br />
contours<br />
filled<br />
Plotting space curves<br />
>spacecurve([cos(t),sin(t),t],<br />
t=0..4*Pi);<br />
>spacecurve([cos(t),sin(t),t],<br />
t=0..4*Pi, thickness=3,<br />
color=red,axes=boxed);<br />
Plotting surfaces<br />
>implicitplot3d(x^2+y^2+z^2=1,<br />
x=-1..1,y=-1..1,z=-1..1,<br />
axes=boxed);<br />
>implicitplot3d(x^2+y^2+z^2=1,<br />
x=-1..1,y=-1..1, z=-1..1,<br />
axes=boxed, style=wireframe,<br />
title="Wireframe sphere");<br />
>plot3d(x^2+y^2,x=-2..2,<br />
y=-2..2,axes=normal);<br />
>plot3d(x^2+y^2,x=-2..2,<br />
y=-2..2,axes=normal,<br />
style=contour,contours=20);<br />
>plot3d([u*cos(v),u*sin(v),v],<br />
u=-1..1,v=0..4*Pi);<br />
>plot3d([u*cos(v),u*sin(v),v],<br />
u=-1..1,v=0..4*Pi,<br />
axes=boxed, numpoints=2000,<br />
orientation=[20,60]);<br />
Plotting level curves<br />
>contourplot(x^2+y^2,<br />
x=-2..2,y=-2..2);<br />
>contourplot(x^2+y^2,<br />
x=-2..2,y=-2..2,<br />
contours=15,filled=true);<br />
Plotting vector fields<br />
gradplot >gradplot(x^2+y^2,<br />
fieldplot x=-2..2,y=-2..2);<br />
>fieldplot([-y,x],x=-2..2,<br />
contours y=-2..2,grid=[15,15],<br />
filled<br />
thickness=3,arrows=SLIM,<br />
color=blue,scaling=constrained);<br />
Combining Plots<br />
display levels:=contourplot(x^2+y^2,<br />
x=-2..2,y=-2..2,contours=15):<br />
gf:=gradplot(x^2+y^2,<br />
x=-2..2, y=-2..2,color=blue,<br />
arrows=THICK,grid=[10,10]):<br />
>display([levels,gf],axes=boxed,<br />
scaling=constrained);<br />
display >display([<br />
display3d plot3d(x^2-y^2,x=-2..2,y=-2..2,<br />
style=patchnogrid,color=yellow),<br />
style<br />
implicitplot3d(x^2+y^2=1,<br />
color<br />
x=-2..2,y=-2..2,z=-2..2,<br />
thickness style=patchnogrid,color=green),<br />
axes<br />
spacecurve([cos(t),sin(t),<br />
scaling<br />
cos(t)^2-sin(t)^2], t=0..2*Pi,<br />
view<br />
color=red,thickness=4)],<br />
orientation axes=boxed,scaling=constrained,<br />
view=[-2..2,-2..2,-2..2],<br />
orientation=[-55,65]);<br />
2<br />
1<br />
y 0<br />
-1<br />
-2<br />
2<br />
1<br />
0<br />
-1<br />
-2<br />
-2<br />
-2<br />
-2<br />
-1<br />
1<br />
-0.5<br />
0.5<br />
-2 -2<br />
1<br />
8<br />
6<br />
4<br />
2<br />
-1 -1<br />
x y<br />
00 0<br />
2 2<br />
2<br />
1<br />
1<br />
y<br />
0<br />
0<br />
x<br />
0.5<br />
-0.5<br />
1<br />
-1<br />
y 0<br />
-1 0 1<br />
2<br />
-1<br />
-2<br />
x<br />
y 0<br />
-1 0 1<br />
2<br />
-2 -1 0<br />
1<br />
x<br />
2<br />
1<br />
-1<br />
-2<br />
x<br />
-1 0<br />
y<br />
0<br />
x<br />
-1<br />
1<br />
2<br />
-2<br />
1<br />
2<br />
2<br />
12<br />
10<br />
8<br />
6<br />
4<br />
2<br />
0<br />
-2<br />
-1<br />
-2<br />
-1<br />
1<br />
-1<br />
1<br />
-0.5<br />
0.5<br />
Wireframe˚sphere<br />
0<br />
0<br />
-0.5<br />
0.5<br />
-2 -2<br />
1<br />
8<br />
6<br />
4<br />
2<br />
-1 -1<br />
x y<br />
00 0<br />
2 2<br />
-0.5<br />
0<br />
2<br />
1<br />
0.5<br />
y 0<br />
-1 0<br />
-1<br />
-2<br />
2<br />
1<br />
x<br />
1<br />
y<br />
0<br />
1<br />
1<br />
1<br />
0.5<br />
-0.5<br />
0<br />
x<br />
0.5<br />
0<br />
0.5<br />
1<br />
-1<br />
-0.5<br />
1<br />
-1<br />
-1<br />
-0.5<br />
y 0<br />
-1 0 1<br />
2<br />
-1<br />
-2<br />
x<br />
2