Fission Product Yield Data for the Transmutation of Minor Actinide ...
Fission Product Yield Data for the Transmutation of Minor Actinide ...
Fission Product Yield Data for the Transmutation of Minor Actinide ...

Create successful ePaper yourself
Turn your PDF publications into a flip-book with our unique Google optimized e-Paper software.
cross-section also has to be incorporated. The calculations<br />
are per<strong>for</strong>med with <strong>the</strong> level density<br />
parameters stemming from a fit to experimental<br />
neutron and proton induced fission cross-sections<br />
<strong>for</strong> 209 Bi and 197 Au.<br />
The basic assumption made is that <strong>the</strong> saddle<br />
point to ground state ratios a f /a n vary smoothly over<br />
<strong>the</strong> isotopes and hence that <strong>the</strong> ratios <strong>for</strong> 208 Pb and<br />
203,205 Tl lie in between those <strong>of</strong> 209 Bi and 197 Au. The<br />
fission cross-sections in this region <strong>of</strong> <strong>the</strong> chart <strong>of</strong><br />
nuclides can be predicted with an accuracy <strong>of</strong> 10%.<br />
This has to be added to <strong>the</strong> uncertainty in <strong>the</strong><br />
prediction <strong>of</strong> <strong>the</strong> normalized yields.<br />
The predictions in Fig. 4.6.13 <strong>for</strong> <strong>the</strong> production<br />
cross-sections <strong>of</strong> fission product masses in 190 MeV<br />
proton induced fission <strong>of</strong> nat W, 197 Au, nat Pb and 208 Pb<br />
are less satisfactory. The experimental data have<br />
been obtained from Ref. [4.6.2]. Figure 4.6.13 also<br />
contains, apart from <strong>the</strong> experimental data and <strong>the</strong><br />
calculation (solid line), a Gaussian (dashed line)<br />
that originates from a fit to <strong>the</strong> data and is given by<br />
<strong>the</strong> original authors. The calculation does a fairly<br />
good job in <strong>the</strong> description <strong>of</strong> <strong>the</strong> left wings and <strong>of</strong><br />
<strong>the</strong> top, but <strong>the</strong> experimental yields are underestimated<br />
by one order <strong>of</strong> magnitude in <strong>the</strong> right wings.<br />
The huge discrepancy <strong>for</strong> heavier masses is mainly<br />
due to <strong>the</strong> prediction <strong>of</strong> a too small width. In<br />
addition, <strong>the</strong> predicted mean mass is shifted to lighter<br />
masses compared to <strong>the</strong> measured value. A lighter<br />
mean mass is related to an overestimation <strong>of</strong> <strong>the</strong> total<br />
number <strong>of</strong> evaporated mass units. This may indicate<br />
an underprediction <strong>of</strong> <strong>the</strong> energy carried away by<br />
<strong>the</strong> emitted particles prior to or after scission. A<br />
possible explanation <strong>of</strong> <strong>the</strong> first effect lies in <strong>the</strong><br />
calculation <strong>of</strong> <strong>the</strong> post-scission neutron multiplicities.<br />
With <strong>the</strong> temperature dependent Brosa model<br />
as described in Section 4.6.4.1, <strong>the</strong> neutron<br />
evaporation between <strong>the</strong> saddle and scission points<br />
is neglected. This results in an excitation energy <strong>of</strong><br />
<strong>the</strong> fragments that is too high. Since <strong>the</strong> division <strong>of</strong><br />
<strong>the</strong> excitation energy available at scission between<br />
<strong>the</strong> two fragments is proportional to <strong>the</strong> fragment<br />
mass, <strong>the</strong> heavy fragment will have a relatively<br />
higher post-scission neutron multiplicity. There<strong>for</strong>e<br />
it will shift more towards lower masses than <strong>the</strong><br />
light fragment, <strong>the</strong>reby reducing <strong>the</strong> width <strong>of</strong> <strong>the</strong><br />
mass distribution. A similar situation <strong>of</strong> a higher<br />
scission temperature occurs if <strong>the</strong> energy carried<br />
away by <strong>the</strong> pre-scission neutrons is too small. An<br />
overestimation <strong>of</strong> <strong>the</strong> post-scission neutron multiplicity<br />
can also be caused by an under-prediction <strong>of</strong><br />
<strong>the</strong> energy required <strong>for</strong> <strong>the</strong> emission <strong>of</strong> neutrons by<br />
<strong>the</strong> fragments. The last two assumptions would<br />
Normalized <strong>Yield</strong><br />
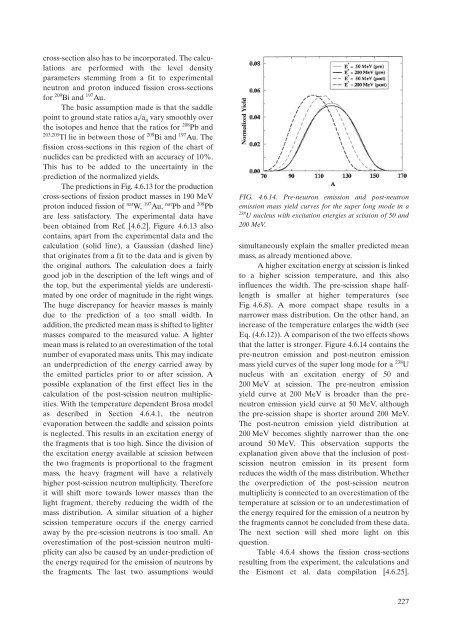
FIG. 4.6.14. Pre-neutron emission and post-neutron<br />
emission mass yield curves <strong>for</strong> <strong>the</strong> super long mode in a<br />
238U nucleus with excitation energies at scission <strong>of</strong> 50 and<br />
200 MeV.<br />
simultaneously explain <strong>the</strong> smaller predicted mean<br />
mass, as already mentioned above.<br />
A higher excitation energy at scission is linked<br />
to a higher scission temperature, and this also<br />
influences <strong>the</strong> width. The pre-scission shape halflength<br />
is smaller at higher temperatures (see<br />
Fig. 4.6.8). A more compact shape results in a<br />
narrower mass distribution. On <strong>the</strong> o<strong>the</strong>r hand, an<br />
increase <strong>of</strong> <strong>the</strong> temperature enlarges <strong>the</strong> width (see<br />
Eq. (4.6.12)). A comparison <strong>of</strong> <strong>the</strong> two effects shows<br />
that <strong>the</strong> latter is stronger. Figure 4.6.14 contains <strong>the</strong><br />
pre-neutron emission and post-neutron emission<br />
mass yield curves <strong>of</strong> <strong>the</strong> super long mode <strong>for</strong> a 238 U<br />
nucleus with an excitation energy <strong>of</strong> 50 and<br />
200 MeV at scission. The pre-neutron emission<br />
yield curve at 200 MeV is broader than <strong>the</strong> preneutron<br />
emission yield curve at 50 MeV, although<br />
<strong>the</strong> pre-scission shape is shorter around 200 MeV.<br />
The post-neutron emission yield distribution at<br />
200 MeV becomes slightly narrower than <strong>the</strong> one<br />
around 50 MeV. This observation supports <strong>the</strong><br />
explanation given above that <strong>the</strong> inclusion <strong>of</strong> postscission<br />
neutron emission in its present <strong>for</strong>m<br />
reduces <strong>the</strong> width <strong>of</strong> <strong>the</strong> mass distribution. Whe<strong>the</strong>r<br />
<strong>the</strong> overprediction <strong>of</strong> <strong>the</strong> post-scission neutron<br />
multiplicity is connected to an overestimation <strong>of</strong> <strong>the</strong><br />
temperature at scission or to an underestimation <strong>of</strong><br />
<strong>the</strong> energy required <strong>for</strong> <strong>the</strong> emission <strong>of</strong> a neutron by<br />
<strong>the</strong> fragments cannot be concluded from <strong>the</strong>se data.<br />
The next section will shed more light on this<br />
question.<br />
Table 4.6.4 shows <strong>the</strong> fission cross-sections<br />
resulting from <strong>the</strong> experiment, <strong>the</strong> calculations and<br />
<strong>the</strong> Eismont et al. data compilation [4.6.25].<br />
227