- Page 1 and 2:
Fission Product Yield Data for the
- Page 3 and 4:
AFGHANISTAN ALBANIA ALGERIA ANGOLA
- Page 5 and 6:
COPYRIGHT NOTICE All IAEA scientifi
- Page 7 and 8:
CONTRIBUTING AUTHORS Denschlag, J.-
- Page 9 and 10:
3.2.1. Introduction . . . . . . . .
- Page 11 and 12:
6. BENCHMARK EXERCISE . . . . . . .
- Page 13 and 14:
However, this CRP entered an entire
- Page 15 and 16:
‘Provisional masses’ are determ
- Page 17 and 18:
Three scientists were invited to pa
- Page 19 and 20:
8 (d) Prompt or delayed neutron emi
- Page 21 and 22:
[2.1.40] ITKIS, M.G., OGANESSIAN, Y
- Page 23 and 24:
[2.1.96] PATE, B.D., et al., Distri
- Page 25 and 26:
[2.1.152] JACOBS, E., et al., Produ
- Page 27 and 28:
16 2.2. MEASUREMENTS OF THE ENERGY
- Page 29 and 30:
FIG. 2.2.3. 94 Sr: best experimenta
- Page 31 and 32:
FIG. 2.2.15. 132 Te: best experimen
- Page 33 and 34:
FIG. 2.2.27. 146 Ba: best experimen
- Page 36 and 37:
3. EVALUATIONS 3.1. ACTINIDE NUCLEO
- Page 38 and 39:
3.1.2. Statistical model At least t
- Page 40 and 41:
J Â K=-J 2 2 2 ^ sym Krot ( U, J)
- Page 42 and 43:
nuclei with N > 144. However, for h
- Page 44 and 45:
neutron number. The observed fissio
- Page 46 and 47:
FIG. 3.1.6. 235 U(n,f) fission cros
- Page 48 and 49:
FIG. 3.1.10. 237 Np(n,f) fission cr
- Page 50 and 51:
from higher fission chances [3.1.43
- Page 52 and 53:
[3.1.48] DUSHIN, V.N., et al., Stat
- Page 54 and 55:
where Y S is our new standard, and
- Page 56 and 57:
TABLE 3.2.2. EVALUATED REFERENCE FI
- Page 58 and 59:
TABLE 3.2.2. EVALUATED REFERENCE FI
- Page 60 and 61:
TABLE 3.2.3. EVALUATED REFERENCE YI
- Page 62 and 63:
TABLE 3.2.3. EVALUATED REFERENCE YI
- Page 64 and 65:
The comparisons of our evaluated da
- Page 66 and 67:
TABLE 3.2.4. COMPARISON OF RECOMMEN
- Page 68 and 69:
TABLE 3.2.4. COMPARISON OF RECOMMEN
- Page 70 and 71:
TABLE 3.2.4. COMPARISON OF RECOMMEN
- Page 72 and 73:
TABLE 3.2.4. COMPARISON OF RECOMMEN
- Page 74 and 75:
TABLE 3.2.4. COMPARISON OF RECOMMEN
- Page 76 and 77:
TABLE 3.2.4. COMPARISON OF RECOMMEN
- Page 78 and 79:
TABLE 3.2.4. COMPARISON OF RECOMMEN
- Page 80 and 81:
TABLE 3.2.5. COMPARISON OF RECOMMEN
- Page 82 and 83:
TABLE 3.2.5. COMPARISON OF RECOMMEN
- Page 84 and 85:
TABLE 3.2.5. COMPARISON OF RECOMMEN
- Page 86 and 87:
TABLE 3.2.5. COMPARISON OF RECOMMEN
- Page 88 and 89:
TABLE 3.2.5. COMPARISON OF RECOMMEN
- Page 90 and 91:
TABLE 3.2.6. COMPARISON OF RECOMMEN
- Page 92 and 93:
TABLE 3.2.7. COMPARISON OF RECOMMEN
- Page 94 and 95:
TABLE 3.2.8. COMPARISON OF THE UNCE
- Page 96:
REFERENCES TO SECTION 3.2 [3.2.1] I
- Page 99 and 100: where N C , N U are the modified an
- Page 101 and 102: activities were recorded with a pro
- Page 103 and 104: 3.3.4. Results and discussion The r
- Page 105 and 106: FIG. 3.3.10. Li Ze et al. data: com
- Page 107 and 108: 96 Annex 3.3.1 EVALUATED EXPERIMENT
- Page 109 and 110: Li Ze et al. [3.3.8] Thierens et al
- Page 111 and 112: 100 Annex 3.3.3 EVALUATED DATA SET
- Page 113 and 114: The range of target nuclides availa
- Page 115 and 116: condensation of cross-sections by t
- Page 117 and 118: (h) REFERENCE (C,80KIEV,171,1980) i
- Page 119 and 120: uncertainties of the calculation. T
- Page 122 and 123: 4. SYSTEMATICS AND MODELS FOR THE P
- Page 124 and 125: FIG. 4.1.2. 235 U total cross-secti
- Page 126 and 127: FIG. 4.1.9. Total and mode separate
- Page 128 and 129: 4.2. SYSTEMATICS OF FISSION PRODUCT
- Page 130 and 131: A - = (PA - NT)/2 (4.2.1b) 4.2.2.3.
- Page 132 and 133: FIG. 4.2.4(a). 238 U + 5.5 MeV n, L
- Page 134 and 135: FIG. 4.2.8(a). U238 + 300 MeV p, LS
- Page 136 and 137: TABLE 4.2.1. EQUATIONS FOR SYSTEMAT
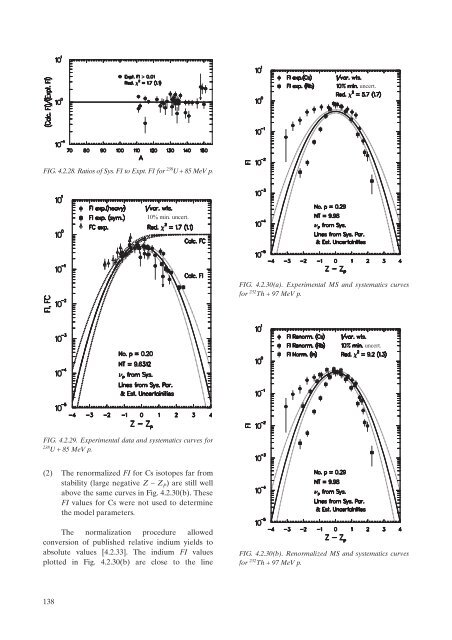
- Page 138 and 139: values (points) and the derived fun
- Page 140 and 141: distributions. Values of N(A) seldo
- Page 142 and 143: FIG. 4.2.19. Systematic Z P paramet
- Page 144 and 145: FIG. 4.2.21. Systematic Z P paramet
- Page 146 and 147: FIG. 4.2.23. Nuclear charge displac
- Page 150 and 151: epresenting model values and thus s
- Page 152 and 153: FIG. 4.2.36. n T(A) for CF249T. FIG
- Page 154 and 155: FIG. 4.2.41. U235T, line: model; po
- Page 156 and 157: The FAST subroutine in the CYFP pro
- Page 158 and 159: [4.2.28] BELHAFAF, D., et al., Kine
- Page 160 and 161: 4.3. FIVE GAUSSIAN SYSTEMATICS FOR
- Page 162 and 163: Derived from measured data Fitted r
- Page 164 and 165: FIG. 4.3.7. Mass distribution of 23
- Page 166 and 167: FFIG. 4.3.12. Mass distribution of
- Page 168 and 169: 4.4. PHENOMENOLOGICAL MODEL FOR FRA
- Page 170 and 171: where = 2mE is the wavelength, E
- Page 172 and 173: FIG. 4.4.4. Fragment mass distribut
- Page 174 and 175: FIG. 4.4.6. Fragment mass distribut
- Page 176 and 177: fragment mass distributions are des
- Page 178 and 179: FIG. 4.4.9. Fragment mass distribut
- Page 180 and 181: FIG. 4.4.10. Fragment mass distribu
- Page 182 and 183: P LD È Ê * E - 44. 7ˆ ˘ = Í1 +
- Page 184 and 185: FIG. 4.4.13. Pre-neutron emission m
- Page 186 and 187: FIG. 4.4.15. Post-neutron emission
- Page 188 and 189: FIG. 4.4.17. Post-neutron emission
- Page 190 and 191: fragment mass and charge distributi
- Page 192 and 193: of the energy dependence of the fus
- Page 194 and 195: 4.5. MODAL APPROACH TO THE DESCRIPT
- Page 196 and 197: This information was used for the p
- Page 198 and 199:
two neighbouring isotopes at differ
- Page 200 and 201:
FIG.4.5.2. Experimental relative ma
- Page 202 and 203:
Frequently, the yields Y i (M) are
- Page 204 and 205:
the nine optimum description parame
- Page 206 and 207:
TABLE 4.5.6. RELATIVE CONTRIBUTIONS
- Page 208 and 209:
TABLE 4.5.8. RELATIVE CONTRIBUTIONS
- Page 210 and 211:
Extracted values of s 2 M,S demonst
- Page 212 and 213:
FIG. 4.5.10. Fission fragment charg
- Page 214 and 215:
FIG. 4.5.12. Unchanged charge densi
- Page 216 and 217:
FIG. 4.5.16. Mass yield variance fo
- Page 218 and 219:
FIG. 4.5.20. Experimental mass yiel
- Page 220 and 221:
[4.5.24] GOVERDOVSKII, A.A., MITROF
- Page 222 and 223:
TABLE 4.6.1. FISSION PRODUCT YIELD
- Page 224 and 225:
TABLE 4.6.2. FIT PARAMETER VALUES O
- Page 226 and 227:
FIG. 4.6.2. Charge distributions fo
- Page 228 and 229:
model which is elucidated elsewhere
- Page 230 and 231:
the agreement is better. The observ
- Page 232 and 233:
inner barrier is much lower than th
- Page 234 and 235:
e determined in a self-consistent m
- Page 236 and 237:
FIG. 4.6.11. Overview of the coupli
- Page 238 and 239:
cross-section also has to be incorp
- Page 240 and 241:
FIG. 4.6.16. Same as Fig. 4.6.15, b
- Page 242 and 243:
FIG. 4.6.20. Pre-neutron emission m
- Page 244 and 245:
present have a reasonable contribut
- Page 246 and 247:
TABLE 4.6.5. ACCURACIES OBTAINED FR
- Page 248 and 249:
[4.6.7] BEIJERS, J.P.M., et al., Se
- Page 250 and 251:
5. NEW MODELS AND SYSTEMATICS: DEFI
- Page 252 and 253:
therefore his benchmark calculation
- Page 254 and 255:
mass distributions and practically
- Page 256 and 257:
5.2. BENCHMARK EXERCISE 5.2.1. Benc
- Page 258 and 259:
thorough and detailed analysis of t
- Page 260 and 261:
the fissioning nucleus and the numb
- Page 262:
should be undertaken — such a stu
- Page 265 and 266:
experimental method in order to der
- Page 267 and 268:
256 Valley heights and peak-to-vall
- Page 269 and 270:
FIG. 6.2.3. Benchmark exercise, par
- Page 271 and 272:
260 Wahl uncert. margins Wahl uncer
- Page 273 and 274:
262 Wahl uncert. margins Wahl uncer
- Page 275 and 276:
264 Wahl uncert. margins (adj. Wahl
- Page 277 and 278:
Wahl (1.6-160 MeV): Distributions a
- Page 279 and 280:
TABLE 6.2.2. 238 U PRE-NEUTRON EMIS
- Page 281 and 282:
as most features are very similar t
- Page 283 and 284:
FIG. 6.2.14. Benchmark exercise, pa
- Page 285 and 286:
274 Wahl uncert. margins Wahl uncer
- Page 287 and 288:
276 Wahl uncert. margins Wahl uncer
- Page 289 and 290:
278 REFERENCES TO SECTION 6 [6.1] B
- Page 291 and 292:
As mentioned above, the mass distri
- Page 293 and 294:
I.3.2.6. Liu Conggui et al. [I.8] M
- Page 295 and 296:
after prompt-neutron emission, and
- Page 297 and 298:
286 Zöller (1995) 89-110 MeV, post
- Page 299 and 300:
(1) Data were linearly interpolated
- Page 301 and 302:
1. 290 Annex to Appendix I RECOMMEN
- Page 303 and 304:
1.2. E n = 5.5 MeV 292 Nagy et al.
- Page 305 and 306:
1.3. E n ª 8 MeV 294 Chapman (1978
- Page 307 and 308:
1.5. E n = 14-15 MeV 296 Daroczy et
- Page 309 and 310:
1.7. E n = 27.5 (22-33) MeV, Zölle
- Page 311 and 312:
1.9. E n = 99.5 (89-110) MeV, Zöll
- Page 313 and 314:
3. 302 239 Pu NEUTRON INDUCED FISSI
- Page 316 and 317:
Appendix II DATA ADJUSTMENT FOR MAS
- Page 318 and 319:
Vivès [II.8], Zöller [II.7] and
- Page 320 and 321:
Annex 1 to Appendix II ADJUSTED DAT
- Page 322 and 323:
Zöller (1995) [II.7] E n = 13 (11.
- Page 324 and 325:
E n = 50 (45-55) MeV Post-neutron e
- Page 326 and 327:
Äystö et al. (1998) [II.9] E p =
- Page 328 and 329:
E n = 1.60 MeV Pre-neutron emission
- Page 330 and 331:
E n = 27.5 (22-33) MeV Post-neutron
- Page 332 and 333:
E n = 99.5 (89-110) MeV Post-neutro
- Page 334 and 335:
Appendix III FISSION YIELD SYSTEMAT
- Page 336 and 337:
FIG. III.6. Dependence of chain yie
- Page 338 and 339:
TABLE III.2. Ln(y)-LINEAR(E) FIT CO
- Page 340 and 341:
FIG. III.14. Dependence of paramete
- Page 342 and 343:
FIG. III.26. Comparison of the mass
- Page 344 and 345:
FIG. III.38. Comparison of the mass
- Page 346 and 347:
TABLE III.3. QUADRATIC FUNCTION FIT
- Page 348 and 349:
Uncertainty ratio or uncertainty Ad
- Page 350:
CONTENTS OF THE CD-ROM The attached
- Page 353:
This publication reports on a coord