Responsive Access Small Cargo Affordable Launch (RASCAL ...
Responsive Access Small Cargo Affordable Launch (RASCAL ...
Responsive Access Small Cargo Affordable Launch (RASCAL ...

Create successful ePaper yourself
Turn your PDF publications into a flip-book with our unique Google optimized e-Paper software.
<strong>Responsive</strong> <strong>Access</strong> <strong>Small</strong> <strong>Cargo</strong> <strong>Affordable</strong><br />
<strong>Launch</strong> (<strong>RASCAL</strong>) Independent<br />
Performance Evaluation<br />
David Young<br />
AE8900 Special Project Report<br />
May 3, 2004<br />
School of Aerospace Engineering<br />
Space System Design Laboratory<br />
Georgia Institute of Technology<br />
Atlanta, Georgia 30332-0150<br />
Advisor: Dr. John R. Olds
Table of Contents:<br />
Table of Contents:............................................................................................................... ii<br />
List of Figures:...................................................................................................................iii<br />
Abstract:.............................................................................................................................. v<br />
List of Acronyms and Symbols: ........................................................................................ vi<br />
Introduction:........................................................................................................................ 1<br />
Motivation:.......................................................................................................................... 1<br />
Initial <strong>RASCAL</strong> Design:..................................................................................................... 2<br />
Design Methodology:.......................................................................................................... 7<br />
Design Disciplines: .............................................................................................................8<br />
Aerodynamics: ................................................................................................................ 8<br />
Propulsion Design:........................................................................................................ 11<br />
Turbofan Design:...................................................................................................... 12<br />
MIPCC Design: ........................................................................................................ 13<br />
Hybrid Design:.......................................................................................................... 18<br />
Solid Design:............................................................................................................. 19<br />
Trajectory:..................................................................................................................... 19<br />
Aircraft Trajectory:................................................................................................... 19<br />
<strong>Launch</strong> Vehicle Trajectory: ...................................................................................... 20<br />
Weights and Sizing: ...................................................................................................... 23<br />
Aeroheating:.................................................................................................................. 26<br />
Operations:.................................................................................................................... 28<br />
Safety and Reliability:................................................................................................... 29<br />
Cost Estimation:............................................................................................................ 31<br />
Baseline Conclusions:....................................................................................................... 36<br />
Design Alternatives:.......................................................................................................... 36<br />
Alternative 1: ................................................................................................................ 37<br />
Alternative 2: ................................................................................................................ 37<br />
Alternative 3: ................................................................................................................ 37<br />
Alternative 4: ................................................................................................................ 38<br />
Alternative 5: ................................................................................................................ 38<br />
GT <strong>RASCAL</strong>: ................................................................................................................... 43<br />
Conclusions:...................................................................................................................... 51<br />
References:........................................................................................................................ 53<br />
ii
List of Figures:<br />
Figure 1: <strong>Launch</strong> Component Breakdown.......................................................................... 3<br />
Figure 2: Three-view of Baseline <strong>RASCAL</strong> 1st Stage. ...................................................... 4<br />
Figure 3: 1st Stage Mission Profile..................................................................................... 5<br />
Figure 4: <strong>RASCAL</strong> Total Mission Profile.......................................................................... 6<br />
Figure 5: Design Structure Matrix for <strong>RASCAL</strong> Design. .................................................. 8<br />
Figure 6: Drag Variation as a Function of Mach Number................................................ 10<br />
Figure 7: Lift Curve Slopes for 1st Stage of the <strong>RASCAL</strong> Design................................. 10<br />
Figure 8: Drag Polars for 1st Stage <strong>RASCAL</strong> Design...................................................... 11<br />
Figure 9: Pratt and Whitney F-100 Turbofan. .................................................................. 12<br />
Figure 10: TBEAT data for F-100 Engine........................................................................ 13<br />
Figure 11: MIPCC Design Features [2]............................................................................ 14<br />
Figure 12: Apparent Flight Altitude Experienced by the Turbo Machinery as a Function<br />
of Actual Flight Altitude [6]. .................................................................................... 15<br />
Figure 13: Apparent Mach Number Experienced by Turbo Machinery as a Function of<br />
Actual Flight Mach Number[6]. ............................................................................... 16<br />
Figure 14: MIPCC Propellant Consumption Curve Fits as a Function of SLS Fuel Flow<br />
Rate [6]...................................................................................................................... 17<br />
Figure 15: Seven Port Hybrid Design............................................................................... 18<br />
Figure 16: Baseline Trajectory (Altitude and Mach Number).......................................... 22<br />
Figure 17: Baseline Trajectory (Thrust and ISP).............................................................. 23<br />
Figure 18: Weight Breakdown for 1st Stage Baseline...................................................... 24<br />
Figure 19: Weight Breakdown for 2nd Stage Hybrid....................................................... 25<br />
Figure 20: Weight Breakdown of Third Stage Solid. ....................................................... 25<br />
Figure 21: Radiative Equilibrium Temperature Calculated from MiniVer. ..................... 27<br />
Figure 22: Excel Operations Tool .................................................................................... 29<br />
Figure 23: Cost Breakdown for <strong>RASCAL</strong> 1st Stage. ....................................................... 31<br />
Figure 24: Cost Breakdown for Upper Stages. ................................................................. 32<br />
Figure 25: Cost Calculator Input Page.............................................................................. 33<br />
Figure 26: Baseline Cost per Flight. ................................................................................. 34<br />
Figure 27: Baseline Dollars per Pound of Payload........................................................... 35<br />
Figure 28: Payload Capacity for Alternative Designs ...................................................... 39<br />
Figure 29: Optimized Alternatives Performance Comparison.......................................... 40<br />
Figure 30: Cost per Flight Comparisons of Optimized Alternatives. ............................... 41<br />
Figure 31: Dollars per Pound of Payload of Optimized Trajectories. .............................. 42<br />
Figure 32: GT <strong>RASCAL</strong> Three-view Drawing. ............................................................... 43<br />
Figure 33: Comparison of GT <strong>RASCAL</strong>, Baseline, and F-15.......................................... 44<br />
Figure 34: Weight Breakdown of 1st Stage of GT <strong>RASCAL</strong>. ......................................... 45<br />
Figure 35: Weight Breakdown of GT <strong>RASCAL</strong> 2nd Stage. ............................................ 46<br />
Figure 36: Weight Breakdown of GT <strong>RASCAL</strong> 3rd Stage. ............................................. 46<br />
Figure 37: First Stage Fuel Breakdown of GT <strong>RASCAL</strong>................................................. 47<br />
Figure 38: Overall Weight Breakdown of GT <strong>RASCAL</strong> (Fourth Stage Omitted)........... 48<br />
Figure 39: GT <strong>RASCAL</strong> Mission Profile. ........................................................................ 49<br />
Figure 40: GT <strong>RASCAL</strong> Trajectory (Mach & Altitude). ................................................. 50<br />
Figure 41: GT <strong>RASCAL</strong> Trajectory (Thrust and ISP)...................................................... 50<br />
iii
List of Tables:<br />
Table 1: Propulsion Design Breakdown. .......................................................................... 12<br />
Table 2: F-100 Engine Characteristics [4]........................................................................ 12<br />
Table 3: Propellant Mass Fraction Comparison of Solid Propellant Upper Stages [7]. ... 19<br />
Table 4: Mission Fuel Fractions. ...................................................................................... 20<br />
Table 5: POST Trajectory Constraints.............................................................................. 21<br />
Table 6: Payload Comparisons for Baseline..................................................................... 23<br />
Table 7: Comparison of First Stage Weights to Similar Fighter Aircraft [8]. .................. 26<br />
Table 8: GT Safety Outputs. ............................................................................................. 30<br />
Table 9: Cost Goal Summary for Baseline. ...................................................................... 36<br />
Table 10: Design Alternatives for <strong>RASCAL</strong> Baseline. .................................................... 36<br />
Table 11: Comparison of GT <strong>RASCAL</strong> with Baseline. ................................................... 44<br />
Table 12: GT <strong>RASCAL</strong> Flights per Year to Attain $5,000 per Pound of Payload.......... 51<br />
Table 13: GT <strong>RASCAL</strong> Flights per Year to Attain $750,000 per Flight ......................... 51<br />
iv
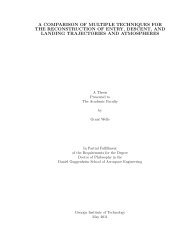
Abstract:<br />
<strong>RASCAL</strong> is a Defense Department initiative that stands for <strong>Responsive</strong> <strong>Access</strong>,<br />
<strong>Small</strong> <strong>Cargo</strong>, <strong>Affordable</strong> <strong>Launch</strong> [2]. The overall launch concept involves three stages.<br />
The first stage will consist of a reusable aircraft similar to a large scale Air Force fighter.<br />
The first stage will also utilize Mass Injection Pre-Compressor Cooling (MIPCC) turbojet<br />
engines that will propel the stage to approximately two hundred thousand feet before<br />
releasing the second and third rocket stages. The first stage will be similar to a large<br />
fighter of the F-22 class, although the turbofans will be that of the more available F100<br />
class. The MIPCC system will be a plug-in addition to the engines to help high altitude<br />
performance. This stage will be not only a “<strong>Launch</strong> Platform”, but more of a first stage<br />
in that it will contribute significantly to the overall acceleration of the vehicle<br />
The second and third stages will consist of simple expendable rockets. Releasing<br />
the upper stages outside the atmosphere will reduce the loads on the stages as well as the<br />
risk of staging. Also by relying on the reusable portion for all atmospheric flight, the<br />
expendable stages can be designed simpler and therefore cheaper.<br />
The purpose of this project is to compare the published <strong>RASCAL</strong> numbers with<br />
those computed using a design methodology currently used in the Space System Design<br />
Laboratory (SSDL) at The Georgia Institute of Technology. When the initial Space<br />
<strong>Launch</strong> Corporation design was evaluated using the SSDL methodology it was found to<br />
fall short of the performance as well as the cost goals set by DARPA for the <strong>RASCAL</strong><br />
program. The baseline vehicle was found to only carry 52 lbs to the 270 nmi sun<br />
synchronous orbit. Several alternatives were evaluated off of the baseline design. The<br />
best of these alternatives can meet DARPA’s performance goals and reach the cost goals<br />
of $5,000 per pound of payload with eight first stage vehicles flying 46 times per year for<br />
a total of 363 flights per year. Different economic cases were also evaluated to try and<br />
meet the cost goals in a less ambitious number of flights per year. It was found that if the<br />
DDT&E was paid for by another party (NASA, DOD, etc.) the cost goals can be met with<br />
just three vehicles flying 42 times per year for a total of 125 flights per year.<br />
v
List of Acronyms and Symbols:<br />
APAS Aerodynamic Preliminary Analysis System<br />
CAD Computer Aided Design<br />
CBO Congressional Budget Office<br />
CER Cost Estimating Relationships<br />
Cl Coefficient of Lift<br />
cj Specific Fuel Consumption<br />
Cr Cruise<br />
DARPA Defense Advanced Research Projects Agency<br />
DDT&E Design, Development, Testing and Evaluation<br />
DOD Department of Defense<br />
DSM Design Structure Matrix<br />
Ff Fuel Fraction<br />
GTOW Gross Takeoff Weight<br />
ICBM Intercontinental Ballistic Missile<br />
H2O2 Hydrogen Peroxide<br />
HABP Hypersonic Arbitrary Body Program<br />
HTPB Hydroxyl Terminated Polybutadiene<br />
Isp Specific Impulse<br />
L/D Lift to Drag Ratio<br />
LOX Liquid Oxygen<br />
Ltr Loiter<br />
M Mach<br />
MER Mass Estimating Relationships<br />
MiniVer Mini-Version<br />
MIPCC Mass Injection Pre-Compressor Cooling<br />
MMC Metal Matrix Composite<br />
MTBF Mean Time Between Failures<br />
NAFCOM NASA- Air Force Cost Model<br />
NASA National Aeronautics and Space Administration<br />
O/F Oxidizer Fuel Ratio<br />
POST Program to Optimize Simulated Trajectories<br />
Pro E Pro Engineer<br />
Q Dynamic Pressure<br />
R Range<br />
<strong>RASCAL</strong> <strong>Responsive</strong> <strong>Access</strong> <strong>Small</strong> <strong>Cargo</strong> <strong>Affordable</strong> <strong>Launch</strong><br />
SLS Sea Level Static<br />
SSDL Space System Design Laboratory<br />
TAT Turn Around Time<br />
TBEAT Turbine Based Engine Analysis Tool<br />
TFU Theoretical First Unit<br />
TPS Thermal Protection System<br />
T/W Thrust to Weight Ratio<br />
USAF United States Air Force<br />
∆V Ideal Change in Velocity<br />
vi
Introduction:<br />
Due to the uncertainty in today’s world and the reliance of the US military on<br />
space based assets there is a need for assured and timely access to space. One way to<br />
accomplish this assured access to space is to use a combination of reusable and<br />
expendable vehicles. This combination will involve the use of a completely reusable first<br />
stage that is very similar to today’s fighter aircraft. The second and third stages will<br />
comprise of a low cost expendable rockets for exo-atmospheric flight. The goal of this<br />
project is to get 250 lbs to any inclination with a high flight rate and a low cost of less<br />
than $5,000 per pound of payload or $750,000 per flight.<br />
<strong>RASCAL</strong> is a Defense Department initiative that stands for <strong>Responsive</strong> <strong>Access</strong>,<br />
<strong>Small</strong> <strong>Cargo</strong>, <strong>Affordable</strong> <strong>Launch</strong>. The first stage will consist of a reusable aircraft similar<br />
to a large scale Air Force fighter. The first stage will also utilize Mass Injection Pre-<br />
Compressor Cooling (MIPCC) turbojet engines that will propel the stage to<br />
approximately two hundred thousand feet before releasing the second and third rocket<br />
stages. The first stage will be similar to a large fighter of the F-22 class, although the<br />
turbofans will be that of the more available F100 class. The MIPCC system will be a<br />
plug-in addition to the engines to help high altitude performance. This stage will be not<br />
only a “<strong>Launch</strong> Platform”, but more of a first stage in that it will contribute significantly<br />
to the overall acceleration of the vehicle<br />
The second and third stages will consist of simple expendable rockets. Releasing<br />
the upper stages outside the atmosphere will reduce the loads on the stages as well as the<br />
risk of staging. Also by relying on the reusable portion for all atmospheric flight, the<br />
expendable stages can be designed simpler and therefore cheaper.<br />
Motivation:<br />
The current launch vehicle market is not equipped to offer the assured and cost<br />
affective access to space. The smallest and cheapest launch vehicle currently available is<br />
the Orbital Sciences Pegasus rocket. The Pegasus utilizes an air launch system which<br />
costs over 20 million dollars per launch with a payload of approximately 1000 lbs [1].<br />
This results in about 20,000 dollars per pound of payload. This cost is prohibitive to<br />
smaller companies and universities trying to access space. The Pegasus also requires<br />
1
months of planning before a launch can be conducted. This long mission planning time<br />
is especially crucial to DOD payloads. The US military relies heavily on space assets to<br />
conduct surveillance, targeting, and communications. If these assets were to fail by either<br />
mechanical failure or hostile action replacements would have to wait at least weeks<br />
before they could be successfully launched.<br />
The <strong>RASCAL</strong> program is DARPA’s attempt to solve the space access problem.<br />
The goals of the program are to develop a responsive, routine, and small scale launch<br />
system. The goals of the project are to have a one hour mission scramble capability<br />
(responsive), a 24 hour TAT with a high flight rate (routine), and 250 lbs to sun<br />
synchronous orbit (small scale). The total goal for cost per flight is $750,000 with a cost<br />
per pound of payload goal of $5,000 per pound. If these goals are meet it should benefit<br />
both military and commercial customers. The military will benefit from <strong>RASCAL</strong> by<br />
having assured access to a highly strategic commodity (polar orbits). The commercial<br />
customer will benefit from the low costs and small payload capacity which allows small<br />
companies and universities to launch payloads into orbit.<br />
Initial <strong>RASCAL</strong> Design:<br />
The initial <strong>RASCAL</strong> program was initiated by DARPA in March of 2002. Phase<br />
I of <strong>RASCAL</strong> was a nine-month study contracted six teams to evaluate the feasibility of<br />
launching small payloads at a significant cost reduction over current launch systems.<br />
After the initial nine-month study phase II was initiated. This phase was awarded to the<br />
Space <strong>Launch</strong> Corporation in January of 2003 [2]. This eighteen-month phase is<br />
intended to advance the <strong>RASCAL</strong> design and allow for risk reduction testing [2]. The<br />
final phase will be initiated in July of 2004 for construction, testing and demonstration of<br />
the <strong>RASCAL</strong> design for an initial operating capability of 2006.<br />
The initial <strong>RASCAL</strong> design consists of a combination of reusable and expendable<br />
vehicles. The first stage is a “fighter like” design implementing MIPCC (Mass Injecting<br />
and PreCooling Compressors) engines for exo-atmospheric flight. This segment will<br />
allow for the faster TATs than conventional launch vehicles and the low operating costs<br />
necessary to reach the <strong>RASCAL</strong> goals. The upper stages will consist of mass produced<br />
low cost expendables. In the initial design this consists of two stages. A low cost, high<br />
performance hybrid engine will propel the upper stage when released from the first stage.<br />
2
This stage will then propel the vehicle until a third solid stage ignites to take 250 lb<br />
payload into orbit. These stages will be mass produced in large quantities to take<br />
advantage of learning curves to reduce the cost per vehicle. A summary of the <strong>RASCAL</strong><br />
baseline system is shown as Figure 1.<br />
4 F-100 turbofans<br />
2 nd Stage Hybrid<br />
81 ft Wingspan<br />
3 rd Stage Solid<br />
42 ft long payload bay<br />
2700 ft 2 S ref<br />
Figure 1: <strong>Launch</strong> Component Breakdown.<br />
250 lb, 10 ft Long, 6 ft Diameter Payload<br />
GTOW 1st Stage<br />
GW Upper Stages<br />
Manned 1 st Stage<br />
89 ft long<br />
90,000 lbs<br />
16,000 lbs<br />
This figure depicts some of the Space <strong>Launch</strong> Corporations specifications for the<br />
<strong>RASCAL</strong> design. This design utilizes an 89 ft long, 90,000 lb first stage and a 42 ft long,<br />
16,000 lb upper stage.<br />
The first stage of this <strong>RASCAL</strong> design is slightly larger and heavier than a typical<br />
USAF fighter. This first stage is powered by four F-100 turbofans. These are the same<br />
turbofans that power both the F-15 and the F-16 currently in the USAF inventory. This<br />
reliance on proven technology should drive down the initial DDT&E costs for the<br />
<strong>RASCAL</strong> design. Unlike other next generation launch vehicles the <strong>RASCAL</strong> design<br />
does carry a pilot. The pilot restricts the performance of the first stage by forcing the<br />
aircraft to maneuver with less than six g’s of acceleration. The pilot does help keep the<br />
DDT&E costs of the initial design low since there is no need for a complicated automatic<br />
flight system. Also the USAF is a major proponent of the <strong>RASCAL</strong> design and prefers to<br />
3
have a manned fighter aircraft as opposed to unmanned air vehicles. A three-view of the<br />
baseline first stage is included as Figure 2.<br />
89 ft<br />
Figure 2: Three-view of Baseline <strong>RASCAL</strong> 1st Stage.<br />
The <strong>RASCAL</strong> program requires the flight profile of the first stage aircraft to have<br />
a circular range of 250 nautical miles with a loiter capability of one half and hour. The<br />
flight profile (Figure 3) involves a high speed acceleration and vertical rise segment<br />
which the <strong>RASCAL</strong> designers refer to as the “zoom maneuver”. This maneuver is<br />
accomplished by throttling up the MIPCC F-100s to full throttle and accelerating a high<br />
flight path angle to the operating limits of the MIPCC engines. The first stage engines<br />
shut down when this operating limit is reached and the entire vehicle coasts on<br />
momentum to over 200,000 ft. At 200,000 ft the first stage and second stage separate.<br />
This high altitude of separation allows the second stage to be released without high<br />
aerodynamic forces experiences at lower separation altitudes. This low dynamic pressure<br />
of separation allows the upper stages to operate without any added structure for<br />
aerodynamic fairings. This removal of structure increases the mass fraction of these<br />
upper stages and therefore the performance. The first stage then releases the upper<br />
81 ft<br />
4
stages which continue on to orbit. The first stage reenters the atmosphere unpowered<br />
along the glide slope determined by the trajectory. Once the dynamic pressure is within<br />
acceptable levels the MIPCC engines restart and the first stage returns to the airport as an<br />
aircraft. The zoom maneuver covers a downrange distance of over 180 nautical miles.<br />
This requires the first stage to fly a worst case of 430 nautical miles to the landing strip.<br />
1- Start-up<br />
2- Taxi<br />
3- Takeoff<br />
5– Cruise Out<br />
192 nmi<br />
50,000 ft<br />
M =0.8<br />
4– Climb<br />
58 nmi<br />
6– Loiter<br />
30 mins<br />
7- Zoom Maneuver<br />
Downrange 90 nmi<br />
Engine Shutdown- 88,000 ft<br />
Release – q
the second stage was chosen over solid propellant for a number of reasons. First, the<br />
hybrid engines offer a higher performance than solids due to the higher Isp that hybrids<br />
provide. A second reason hybrids were chosen over solids was that hybrids have the<br />
ability to shutdown if an anomaly in the firing of the engine is detected. This shutdown<br />
ability is not available in solid motors which could pose a danger to the manned first<br />
stage if a catastrophic failure were to occur soon after separation. The final stage was<br />
chosen to be solid for packaging as well as the cost considerations. These stages insert<br />
the payload directly into a 270 nautical mile circular orbit at a sun synchronous<br />
inclination of 98 degrees.<br />
Figure 4: <strong>RASCAL</strong> Total Mission Profile.<br />
The <strong>RASCAL</strong> design is intended to launch a 250 lb payload into a 270 nautical mile<br />
circular orbit at a sun synchronous inclination of 98 degrees. The design goal is to also<br />
launch 400 lbs of payload into a 270 nautical mile, 28.5 degree inclination low earth<br />
orbit. Both of these mission profiles will be simulated with the <strong>RASCAL</strong> design being<br />
set for the more constraining mission. The secondary mission (the one which is not the<br />
6
driving constraint) will then be flown with the same design with the resulting payload<br />
exceeding the <strong>RASCAL</strong> design requirements.<br />
Design Methodology:<br />
The purpose of this project is to compare the published <strong>RASCAL</strong> numbers with<br />
those computed using a design methodology currently used in the Space System Design<br />
Laboratory at The Georgia Institute of Technology. To accomplish the <strong>RASCAL</strong><br />
baseline design was analyzed in the following design structure matrix (DSM) (Figure 5).<br />
The DSM is a method of graphically interpreting the way that different contributing<br />
analyses (design disciplines) interact to create a design. This DSM is very similar to<br />
most launch vehicle designs. There is a strong iteration loop between the propulsion<br />
design, trajectory, and weights and sizing. This iteration loop does the major convergence<br />
of the vehicle. A smaller feedback occurs between aeroheating and weights and sizing<br />
(TPS weight). This is a smaller feedback since there are not radical departures in TPS<br />
design between similar trajectories. There is no feedback to the aerodynamics from the<br />
trajectory contributing analysis as one would expect. This is because the aerodynamic<br />
coefficients are non-dimensional and scale with the vehicle.<br />
This design methodology is used for the <strong>RASCAL</strong> design. Due to the complexity<br />
of the design some contributing analyses are broken down into the two main constituents<br />
of the design (the first stage and the upper stage) to get converged solutions. These<br />
converged solutions are then recombined and reconverged in the contributing analysis<br />
before continuing through the DSM.<br />
This method of simplifying the problem was mainly used in the trajectory<br />
contributing analysis. It was too difficult of a problem to run the entire trajectory from an<br />
initial guess so the first and upper stages were run independently matched at the<br />
separation point. Once this is achieved the two solutions are combined into one<br />
trajectory analysis with the solutions to the separate problems given as initial guesses to<br />
the combined problem. These “better guesses” allow the entire vehicle to be optimized<br />
and then closed in the main iteration loop.<br />
7
Configuration<br />
Aerodynamic<br />
Design Disciplines:<br />
Figure 5: Design Structure Matrix for <strong>RASCAL</strong> Design.<br />
As the DSM predicts many different design disciplines are combined to create the<br />
converged design. Each design discipline was executed to verify both the feasibility and<br />
viability of the <strong>RASCAL</strong> design. Each discipline will be presented with the tool used and<br />
results obtained from the analysis.<br />
Aerodynamics:<br />
Propulsion/<br />
MIPPC<br />
Trajectory<br />
Aeroheating<br />
Weights<br />
& Sizing<br />
Operation<br />
Safety<br />
The aerodynamic analysis for the <strong>RASCAL</strong> design was conducted using the<br />
Aerodynamic Preliminary Analysis System (APAS) computer code. APAS is a<br />
conceptual design aerodynamics tool used to obtain the lift, drag, and moment<br />
coefficients for a conceptual design. The APAS code is used to define the geometry of<br />
the conceptual design and then the analysis is conducted in one of two analysis codes.<br />
The geometry of the first stage, the total upper stage, as well as the third stage were all<br />
modeled in APAS. It should be noted that the second and third stages will be operating<br />
close to the APAS threshold of 350,000 ft and therefore the aerodynamic coefficients will<br />
be much less significant than that of the first stage.<br />
Cost<br />
8
Once the geometry is defined it must be analyzed to produce the aerodynamic<br />
coefficients necessary for the trajectory simulation. To analyze the aerodynamics<br />
historical data was used for the subsonic and transonic analysis Hypersonic Arbitrary<br />
Body Program (HABP) for was used for the hypersonic analysis. The historical data for<br />
subsonic and transonic analyses was obtained from F-14 design data [3]. This data<br />
contains the lift and drag coefficients as a function of Mach number and angle of attack.<br />
These coefficients were taken at a wing sweep of 55 degrees (that of the <strong>RASCAL</strong><br />
design). The aerodynamic forces are then scaled by the coefficients and the <strong>RASCAL</strong><br />
wing area of 2700 ft 2 . This data was then combined with the HABP hypersonic analysis<br />
to create a complete the aerodynamic data for both the first stage and the upper stages of<br />
the <strong>RASCAL</strong> design.<br />
The first aerodynamic data presented is the effect of Mach number on the zero lift<br />
drag coefficient (CD0) (Figure 6). As this plot depicts the drag is highest for the first<br />
stage at a Mach number of 1. The drag then decreases until Mach three and levels off.<br />
The ramp up to Mach 1 is an effect of the transonic drag in this region. This abrupt<br />
increase in drag can also be attributed to limited number of points before Mach 1 in the<br />
F-14 design data. This plot was not carried out for higher Mach numbers because the<br />
first stage will never achieve speeds in excess of Mach 4 (MIPCC cutoff speed).<br />
The next set of data is the lift curve slopes for the first stage of the <strong>RASCAL</strong><br />
design (Figure 7). These again are a compilation of both the F-14 data and the HABP<br />
analysis. As expected as the angle of attack increases the lift increases. Also as the<br />
Mach number increases the coefficient of lift decreases (The actual lift increases, but the<br />
coefficient is normalized by velocity squared).<br />
The final set of aerodynamic data included is the drag polars (Figure 8). These<br />
drag polars relate the total drag (induced and zero lift) to the lift produced. The lift<br />
produced is a function of angle attack and Mach as depicted in Figure 8. Therefore given<br />
angle of attack and speed (Mach) of the vehicle all of the aerodynamic properties of the<br />
vehicle can be calculated.<br />
9
Coefficent of Drag<br />
Coefficient of Lift<br />
0.08<br />
0.07<br />
0.06<br />
0.05<br />
0.04<br />
0.03<br />
0.02<br />
0.01<br />
0<br />
0 0.5 1 1.5 2 2.5<br />
Mach<br />
3 3.5 4 4.5 5<br />
Figure 6: Drag Variation as a Function of Mach Number<br />
1.5<br />
1<br />
0.5<br />
0<br />
-15 -10 -5 0 5 10 15 20 25<br />
-0.5<br />
-1<br />
Angle of Attack (deg)<br />
Figure 7: Lift Curve Slopes for 1st Stage of the <strong>RASCAL</strong> Design.<br />
Mach .8<br />
Mach 1.2<br />
Mach 2.0<br />
Mach 2.4<br />
Mach 3.0<br />
Mach 4.0<br />
10
Coefficient of Drag<br />
0.6<br />
0.5<br />
0.4<br />
0.3<br />
0.2<br />
0.1<br />
0<br />
0 0.2 0.4 0.6 0.8 1 1.2 1.4 1.6<br />
Coefficient of Lift<br />
Propulsion Design:<br />
Figure 8: Drag Polars for 1st Stage <strong>RASCAL</strong> Design.<br />
Mach .8<br />
Mach 1.2<br />
Mach 2.0<br />
Mach 2.4<br />
Mach 3.0<br />
Mach 4.0<br />
The design of the propulsion system for <strong>RASCAL</strong> involves four parts. The first<br />
part is the design of the turbofan engines. This will be conducted using historical data [4]<br />
as well as an airbreathing turbojet design tool, TBEAT [5]. The second part of the<br />
propulsion design involves the performance of the MIPCC engines. This will be<br />
evaluated via an AIAA paper written by Preston Carter and Vladimir Balepin [6]. The<br />
MIPCC design will then be combined with the TBEAT analysis to evaluate the<br />
performance of the first stage engines. The third part of the propulsion design will be the<br />
second stage hybrid design. This part will be design using historical data [7]. The final<br />
part of the propulsion design will be the design of the third stage solid propellant engine.<br />
This will again be designed from historical data [7]. The propulsion elements will then<br />
be combined to be used in the trajectory analysis.<br />
11
Table 1: Propulsion Design Breakdown.<br />
Engine Main Design Tool<br />
First Stage F-100 TBEAT [5]<br />
First Stage MIPCC AIAA Paper [6]<br />
Second Stage Hybrid Historical MERs [7]<br />
Third Stage Solid Historical MERs [7]<br />
Turbofan Design:<br />
The turbofans used in the <strong>RASCAL</strong> design are the Pratt and Whitney F-100s. As<br />
noted earlier these engines are the same as those used on the F-15 and F-16 fighters. In<br />
fact these engines were not chosen because of their performance. In fact the Pratt and<br />
Whitney F-119, which powers the F-22, provides over 20% more thrust. The F-100 was<br />
chosen due to the availability, and therefore low cost, of the engines. The characteristics<br />
of the F-100 are provided in Table 2.<br />
Table 2: F-100 Engine Characteristics [4].<br />
Thrust 29,000 lbs<br />
Weight 3,740 lbs<br />
T/W Ratio 7.754<br />
Length 191 in<br />
Inlet Diameter 34.8 in<br />
Max Diameter 46.5 in<br />
Bypass Ratio 0.36<br />
Pressure Ratio 32<br />
The F-100 is a low bypass turbofan which offers both high performance and efficiency.<br />
A diagram of the F-100 is included as Figure 9.<br />
Figure 9: Pratt and Whitney F-100 Turbofan.<br />
12
These characteristics were then analyzed in TBEAT using an afterburning turbofan to<br />
obtain the dependence of thrust and Isp on Mach number and altitude (Figure 10).<br />
Thrust<br />
80000<br />
70000<br />
60000<br />
50000<br />
40000<br />
30000<br />
20000<br />
10000<br />
0<br />
0 1 2 3 4 5<br />
Mach<br />
2500<br />
2000<br />
1500<br />
1000<br />
500<br />
0<br />
ISP<br />
Figure 10: TBEAT data for F-100 Engine.<br />
Thrust (10,000 ft)<br />
Thrust (50,000 ft)<br />
ISP (50,000 ft)<br />
ISP (10,000 ft)<br />
As expected as the altitude increases both the thrust and Isp diminish. This is the main<br />
problem for using turbofans in space access systems. As the altitude increases the<br />
density of the incoming air decreases and the engines become inefficient and unable to<br />
produce the required thrust. Another problem is that in high speed flight the turbo<br />
machinery exceeds the maximum temperature of the materials. This causes the engine to<br />
melt itself. The solution is to pre-cool the incoming air to below the machine limits and<br />
to increase the density at high altitudes to retain the high thrust experiences at lower<br />
altitudes.<br />
MIPCC Design:<br />
MIPCC (Mass Injecting Pre-Cooling Compressor) technology dates back to the<br />
early 1950’s. MIPCC is an engine enhancing technology initially designed to propel high<br />
speed fighters beyond Mach 3. These fighters were pursued by the USAF in the early<br />
1950’s to combat perceived cold war threat of high speed USSR bombers. As<br />
13
Intercontinental Ballistic Missile (ICBM) technologies improved the need to defend from<br />
high speed bombers was superceded by the need to protect from ICBMs. This put<br />
MIPCC on the technology shelf until recently with the advent of the <strong>RASCAL</strong> program.<br />
The MIPCC bolt-on additions to the F-100 turbofans are the single most<br />
important enabling technologies for the <strong>RASCAL</strong> design. The MIPCC is what is used to<br />
attain the engine inlet conditions desired in the turbofan design section. MIPCC is a<br />
technology that introduces tanked water and LOX to the incoming air flow (precompressor)<br />
at high Mach numbers and at high altitudes. Typical aircraft engines are<br />
limited in altitude by the density of the incoming fluid (oxidizer). Typical turbofans are<br />
also limited in speed of the flow by the temperature limits of the combustor materials.<br />
MIPCC pushes out the altitude and speed boundaries by both cooling and adding density<br />
to the incoming flow of a turbofan. The result is that at high Mach numbers the incoming<br />
air is cooled by the water and the LOX. This allows the engine to operate at Mach<br />
numbers far exceeding the design limits for the nominal turbofans. Another benefit is<br />
that the incoming water and LOX add density to the incoming flow. This allows the<br />
engine to operate at higher altitudes that the design limits. A third benefit is that the LOX<br />
in the intake acts as a stabilizer in the oxidizer deprived combustion chamber at high<br />
altitudes. A diagram of a MIPCC augmented engine is included as Figure 11.<br />
Figure 11: MIPCC Design Features [2].<br />
14
To analyze the effect of MIPCC an AIAA paper written by Preston Carter was<br />
analyzed [6]. MIPCC engines are able to operate to altitudes greater than 85,000 ft and<br />
Mach numbers in excess of Mach 4. At these conditions the MIPCC system cools and<br />
increases the density of the flow so the engine appears to be operating at a lower altitude<br />
and Mach number. To model this, a translation of the TBEAT data was preformed using<br />
the apparent altitude and apparent Mach number at the flight altitude and Mach numbers.<br />
A summary of the performance of the MIPCC engines is included as Figure 12 and<br />
Figure 13.<br />
Apparent Flight Altitude (ft)<br />
80000<br />
70000<br />
60000<br />
50000<br />
40000<br />
30000<br />
20000<br />
10000<br />
0<br />
MIPCC<br />
off<br />
MIPCC on<br />
0 20000 40000 60000 80000 100000<br />
Actual Flight Altitude (ft)<br />
Figure 12: Apparent Flight Altitude Experienced by the Turbo Machinery as a Function of Actual<br />
Flight Altitude [6].<br />
15
Apparent Flight Mach<br />
4<br />
3.5<br />
3<br />
2.5<br />
2<br />
1.5<br />
1<br />
0.5<br />
MIPCC<br />
off<br />
MIPCC on<br />
0<br />
0 0.5 1 1.5 2 2.5 3 3.5 4 4.5<br />
Actual Flight Mach<br />
Figure 13: Apparent Mach Number Experienced by Turbo Machinery as a Function of Actual Flight<br />
Mach Number[6].<br />
As these figures indicate the MIPCC system engages at Mach 0.9 and continues to<br />
operate throughout the trajectory. At Mach 4 and 88,000 ft the engine performs as if it is<br />
operating at an altitude of 24,000 ft and a Mach number of 1.6.<br />
Unfortunately the MIPCC concept does have drawbacks. First the increased<br />
weight of the oxygen and water carried increases the vehicle size. Also these propellants<br />
have to be stored in separate tanks and therefore further increase the vehicle dry weight.<br />
Also the Isp of the engines cannot be computed from a simple translation of the TBEAT<br />
data. As the tanked water and oxidizer flow rate increases, the Isp of the engine must be<br />
adjusted to account for the additional mass flow. This was accomplished by first<br />
calculating the MIPCC propellant flow rate as a function of SLS fuel flow rate according<br />
to Figure 14. This data was then curve fit so the MIPCC propellant flow rate could be<br />
calculated at every Mach number and altitude. This curve fit was broken up into four<br />
regions two for each type of tanked MIPCC propellant. In three of the four cases a linear<br />
fit produced a good representation of the data, but for the initial water injection profile a<br />
cubic polynomial was used to fit the data. These curve fits are also provided in Figure<br />
16
14. The new Isp of the MIPCC engine can then be calculated from the fuel flow rate<br />
(TBEAT Isp) and Equation 1.<br />
I<br />
sp<br />
T<br />
= (1)<br />
* *<br />
g(<br />
m fuel + m MIPCC )<br />
The result of this translation is a MIPCC thrust and Isp as a function of flight Mach and<br />
altitude. It should be noted that the percentage of LOX in the MIPCC flow is determined<br />
by oxidation limits of the F-100 turbofans. Therefore an upper limit of 23% of the total<br />
flow of incoming air was set. This percentage of LOX by weight was used since that<br />
approximated the amount of oxygen in standard air.<br />
Percentage of SLS Fuel Flow Rate<br />
0.2<br />
0.18<br />
0.16<br />
0.14<br />
0.12<br />
0.1<br />
0.08<br />
0.06<br />
0.04<br />
0.02<br />
Water Flow Rate<br />
y = 0.1006x 3 - 0.4262x 2 + 0.5975x - 0.264<br />
y = 0.0731x - 0.1185<br />
y = 0.07x - 0.1799<br />
y = 0.043x - 0.0989<br />
LOX Flow Rate<br />
0<br />
0 0.5 1 1.5 2 2.5 3 3.5 4 4.5<br />
Actual Flight Mach<br />
Figure 14: MIPCC Propellant Consumption Curve Fits as a Function of SLS Fuel Flow Rate [6].<br />
17
Hybrid Design:<br />
Hybrid engines are also a relatively new technology. Hybrid rocket engines<br />
combine both a solid fuel with a liquid oxidizer. The combination provides a<br />
performance greater than solid engines, but a cost and simplicity that can’t be achieved<br />
by liquid engines. Another benefit of the hybrid engines over solid engines is that the<br />
hybrid engine can be shut down if a problem occurs by simply shutting off the flow of<br />
oxidizer to the solid fuel. This will allow a shutdown of the upper stage if a problem<br />
occurs near the manned first stage.<br />
The hybrid engine for the second stage was designed using conceptual design<br />
methods 7 . Many different fuels were analyzed with HTPB/LOX combination providing<br />
the best Isp. Unfortunately for the size of the second stage this results in a vehicle that is<br />
almost 10 feet longer than the 42 foot payload bay designated in the baseline. Therefore<br />
hydrogen peroxide (H2O2) was used the next best performance and a higher mixture ratio<br />
than the HTPB/LOX configuration which results in a smaller vehicle (Since the oxidizer<br />
is more dense than the fuel).<br />
Once the propellant was determined the fuel chambers were designed to be as<br />
short as possible while still having the proper length to diameter ratio to support<br />
combustion. For hybrids this seemed to result in a seven port fuel chamber as shown in<br />
Figure 15.<br />
Figure 15: Seven Port Hybrid Design.<br />
The Isp for this design can be estimated using conceptual design equations [7] and nozzle<br />
parameters that were set to be the maximum nozzles to fit within the diameter as well as<br />
the length constraints of the upper stage (approximated as 80% of a 15 degree half cone).<br />
This resulted in an Isp of approximately 310 seconds. With this design and the propellant<br />
18
combination selected the overall weights can be calculated using MERs which will be<br />
described in subsequent sections.<br />
Solid Design:<br />
The solid third stage was designed in much the same way as the hybrid engine<br />
using conceptual design equations [7]. It was decided to use AL/HTPB propellant which<br />
would have commonality with the hybrid engine as well as providing an Isp of<br />
approximately 293 seconds in vacuum. Once the third stage was then compared with<br />
existing rockets such as the Star 37 and Orion 38 to compare appropriate mass fractions.<br />
Table 3: Propellant Mass Fraction Comparison of Solid Propellant Upper Stages [7].<br />
Mass Fraction<br />
Star 37 0.915<br />
Orion 38 0.859<br />
3rd Stage 0.875<br />
Trajectory:<br />
The trajectory analysis for the <strong>RASCAL</strong> design involved two separate parts. For<br />
the airplane components of the trajectory airplane fuel fraction estimates were used [8].<br />
This included segments 1-6 and 8-12 of the first stage mission profile (Figure 3). The<br />
second part of the trajectory analysis involved what is considered the launch vehicle<br />
segment of the trajectory. To analyze this segment of the trajectory POST was used.<br />
POST, the Program to Optimize Simulated Trajectories, is a three degree of freedom<br />
code written by Lockheed Martin and NASA [9]. POST was used to model the<br />
trajectory from Mach 0.8 through the zoom maneuver and the stage separations to third<br />
stage MECO.<br />
Aircraft Trajectory:<br />
The aircraft portion of this trajectory is very similar to the flight profiles flow by<br />
conventional aircraft. Because of the similarities between this profile and typical aircraft<br />
profiles a standard aircraft conceptual design method, fuel-fraction method [8], will be<br />
used to calculate the mission fuel in each segment of the mission profile (Figure 3). In<br />
this method the fuel fraction of each mission segment will be calculated from a<br />
combination of historical regressions as well as simple static values for similar aircraft<br />
19
types. Each fuel fraction is defined as the ratio of end weight to beginning weight. Fuel<br />
fractions for mission segments 1-3 and 9-12 were used as static historical values. While<br />
the remaining fuel fractions have been calculated using historical equations using aircraft<br />
characteristics. These equations are given below for the climb, cruise, and loiter portions<br />
of the mission profiles<br />
E cl<br />
cl = ( 1/<br />
c j ) cl ( L / D)<br />
LN(<br />
ff )<br />
(2)<br />
R j cr cr<br />
( V / c ) ( L / D)<br />
LN(<br />
ff )<br />
cr = (3)<br />
E j ltr ltr<br />
( 1/<br />
c ) ( L / D)<br />
LN(<br />
ff )<br />
ltr = (4)<br />
From these equations and the historical constants the calculated mission fuel fractions are<br />
given in Table 4.<br />
Table 4: Mission Fuel Fractions.<br />
1 FF Engine Start 0.9900<br />
2 FF Taxi 0.9900<br />
3 FF Takeoff 0.9900<br />
4 FF Climb 0.9714<br />
5 FF Cruise out 0.9596<br />
6 FF Loiter 0.9624<br />
8 FF Cruise In 0.9295<br />
9 FF Descent 0.9900<br />
10-12 FF Landing 0.9950<br />
With these fuel fractions the entire fuel consumed in the aircraft portions of the trajectory<br />
can be calculated.<br />
<strong>Launch</strong> Vehicle Trajectory:<br />
The second portion of the trajectory is the launch vehicle portion. This is the part<br />
of the trajectory which is unique to the <strong>RASCAL</strong> design. Because of the uniqueness of<br />
the trajectory POST was used to calculate the optimized trajectory. POST is a three<br />
dimensional trajectory optimization code which takes inputs from the propulsion,<br />
weights, and aerodynamics disciplines and simulates the trajectory of the spacecraft<br />
subject to the performance constraints listed in Table 5.<br />
20
Table 5: POST Trajectory Constraints.<br />
Max Axial Acceleration 6 g's<br />
Max Dynamic Pressure 2000 psf<br />
Max Angle of Attack 20 degrees<br />
Max Dynamic Pressure at Release 1 psf<br />
Final Orbit Apogee 270 nmi<br />
Final Orbit Perigee 270 nmi<br />
Final Orbit Inclination 98 degrees<br />
Due to the complexity of the <strong>RASCAL</strong> trajectory the airbreathing, and rocket portions of<br />
the trajectories were calculated separately to get approximate “guesses” for the combined<br />
trajectories. These outputs with their appropriate initial conditions are then combined<br />
into one POST input file which is then optimized to minimize the propellant consumed<br />
by the stages.<br />
The first stage input deck was set up to use the MIPCC engines as defined in the<br />
propulsion section. This input file starts with an initial weight, accelerates the aircraft<br />
until an appropriate time when the aircraft begins the zoom maneuver. This zoom<br />
maneuver involves increasing the altitude while still firing the MIPCC engines. Once the<br />
aircraft reaches the MIPCC limits of 88,000 ft and Mach 4 the engines shut down. The<br />
aircraft then continues to gain altitude by trading kinetic energy for potential energy. The<br />
first stage then coasts until the flight path angle drops to 20 degrees (other flight path<br />
angles were used, but 20 degrees results in the smallest vehicle). The first stage input<br />
deck actually tries to maximize the velocity of release to give the second stage as much<br />
energy as possible. The dynamic pressure constraint of release combined with this<br />
optimization scheme also results in an altitude in excess of 200,000 ft at release.<br />
Once the first stage is optimized the second stage begins at the altitude, velocity,<br />
azimuth, latitude, longitude, and flight path angle of the end of the first stage. The<br />
second stage ignites after a coast of 5 seconds after release from the aircraft to get a<br />
significant distance between the stages. The second stage hybrid then ignites until the<br />
ideal ∆V provided by the second stage reaches 11,000 fps. This ∆V number was set in<br />
the <strong>RASCAL</strong> design, but it was traded and found to be close to the optimal point. After<br />
the second stage falls away the third stage ignites after a five second delay. The third<br />
stage then fires until the proper orbit is reached. The entire upper stage input file is<br />
designed to optimize the weight consumed. The final weight at the end of the run is then<br />
21
the total payload weight and the dry weight. The dry weight can then be subtracted off<br />
from the weights and sizing sheet to get the maximum payload.<br />
Once both stages are optimized they are combined into one deck to verify the<br />
results and to optimize the entire system. This input file is set up differently that the two<br />
initial input files. The first stage deck already maximizes the velocity achieved by the<br />
first stage. These initial guesses are then put into the combined deck which is set up to<br />
minimize the weight consumed and therefore maximize the payload weight at the end of<br />
the simulation. This method starts the total deck at a solution very near the ideal solution,<br />
but then allows POST to determine if staging higher and slower is preferable to staging at<br />
the maximum velocity while still satisfying the dynamic pressure constraint of 1 psf. The<br />
optimized solution stages as soon as possible (while still meeting the dynamic pressure<br />
constraint) thereby firing the second stage with the highest relative velocity. The results<br />
of this trajectory are presented as Figure 16 and Figure 17. As these figures show that the<br />
first stage provides only a small amount of the overall altitude and velocity that it<br />
necessary to achieve orbit. The first stage does release the second stage outside the drag<br />
of the atmosphere and that is where the majority of the benefit of the first stage is<br />
achieved.<br />
Mach Mach<br />
30<br />
25<br />
20<br />
15<br />
10<br />
5<br />
0<br />
3rd 3 Stage Ignition<br />
rd Stage Ignition<br />
2nd 2 Stage Ignition<br />
nd Stage Ignition<br />
0 200 400<br />
Time of Flight (secs)<br />
600 800<br />
1800<br />
1600<br />
1400<br />
1200<br />
1000<br />
800<br />
600<br />
400<br />
200<br />
Figure 16: Baseline Trajectory (Altitude and Mach Number).<br />
0<br />
Altitude (kft)<br />
Mach<br />
Altitude<br />
22
Thrust (lbs)<br />
120000<br />
100000<br />
80000<br />
60000<br />
40000<br />
20000<br />
0<br />
0 200 400<br />
Time (secs)<br />
600 800<br />
2500<br />
2000<br />
1500<br />
1000<br />
500<br />
Figure 17: Baseline Trajectory (Thrust and ISP).<br />
0<br />
ISP (secs)<br />
Thrust<br />
Once the baseline trajectory was set the same vehicle was flown from the Cape<br />
Canaveral, Fl flying due east to calculate the payload capability to that orbit. The<br />
payload capability of the baseline to both orbits is included in Table 6.<br />
Table 6: Payload Comparisons for Baseline.<br />
98 Degree Sun-Synchronous Orbit 52 lbs<br />
28.5 Degree Low Earth Orbit 149 lbs<br />
Both payload capacities are below the required <strong>RASCAL</strong> payloads, but from a<br />
comparison of the requirements to the obtained payload amounts the sun-synchronous<br />
mission drives the design of the rocket. The LEO orbit will exceed the required 400 lbs if<br />
the sun-synchronous orbit attains the 250 lbs requirement.<br />
Weights and Sizing:<br />
Once the trajectory analysis is complete the dry weights for each of the stages<br />
must be computed from the propellant weights calculated in POST. These weights are<br />
then converged to close the baseline vehicle. The dry weights are calculated using<br />
historical mass estimating relationships (MERs). Most of the first stage MERs were<br />
calculated from historical aircraft data [10]. Other components were taken directly from<br />
ISP<br />
23
the actual flight hardware (ejection seat, turbofans, etc.). The only major exception is the<br />
TPS weight which was sized independently from the aeroheating data.<br />
The major components of the first stage are the wing, body, main propulsion, and<br />
landing gear. The weight breakdown of the first stage is included as Figure 18.<br />
Gross Weight<br />
Dry Weight<br />
Wing Group<br />
Tail Group<br />
Body Group<br />
TPS<br />
Landing Gear<br />
Main Propulsion<br />
Electrical Conversion and Distribution<br />
Hydraulic Systems<br />
Surface Control and Actuators<br />
Avionics<br />
Environmental Control<br />
Personnel Equipment<br />
Dry Weight Margin<br />
101,503 lb<br />
56,565 lb<br />
7,936 lb<br />
1,432 lb<br />
12,727 lb<br />
865 lb<br />
3,034 lb<br />
16,992 lb<br />
1,138 lb<br />
660 lb<br />
2,021 lb<br />
1,964 lb<br />
200 lb<br />
218 lb<br />
7,378 lb<br />
Environmental Control<br />
0%<br />
Avionics<br />
3%<br />
Surface Control and<br />
Actuators<br />
4%<br />
Hydraulic Systems<br />
1%<br />
Electrical Conversion<br />
and Distribution<br />
2%<br />
Main Propulsion<br />
30%<br />
Figure 18: Weight Breakdown for 1st Stage Baseline.<br />
Personnel Equipment<br />
0%<br />
Dry Weight Margin<br />
13%<br />
Wing Group<br />
14% Tail Group<br />
3%<br />
Body Group<br />
23%<br />
TPS<br />
2%<br />
Landing Gear<br />
5%<br />
From this weight breakdown it can be seen that the body and main propulsion (including<br />
MIPCC engines) are the main contributors to the dry weight. Weight growth margin is<br />
also a significant portion of the dry weight (15% of pre-margin dry weight).<br />
The second stage was modeled from MERs from both expendable rocket data<br />
[10], as well as conceptual design equations [7]. The hybrid engine was modeled as a<br />
pressurized oxidizer tank, a solid fuel casing, a feed system for the oxidizer, and a nozzle.<br />
The fuel casing is sized as a seven port solid with a 48% volumetric efficiency [7]. A<br />
weight breakdown of the second stage is included as Figure 19. It should be noted that<br />
the structure includes both the fuel and oxidizer tanks, while the propulsion elements<br />
include the engine nozzle and the feed system. The gross weight includes both the<br />
payload and the gross mass of the third stage.<br />
24
Gross Gross Weight<br />
Dry Dry Weight Weight Margin<br />
Structure<br />
Propulsion<br />
Power<br />
16,000 lb<br />
261 lb<br />
999 lb<br />
397 lb<br />
121 lb<br />
Dry Weight Margin<br />
15%<br />
Power<br />
7%<br />
Propulsion<br />
22%<br />
Figure 19: Weight Breakdown for 2nd Stage Hybrid.<br />
Structure<br />
56%<br />
The third stage of the <strong>RASCAL</strong> design was also modeled from MERs from both<br />
expendable rocket data [10] as well as conceptual design equations [7]. The solid engine<br />
was modeled as tank with a volumetric efficiency of 90%. The weight breakdown is<br />
very similar to that of the second stage except that the third stage has a more complicated<br />
avionics system. The third stage also has a larger percentage of the weight in the<br />
propulsion system since the nozzle is much larger percentage when compared to the<br />
overall third stage system. The third stage also carries the payload previsions. The gross<br />
weight contains the entire structure, propellant, and payload.<br />
Gross Weight 3,289 lb<br />
Structure<br />
Dry Weight Margin<br />
Structure<br />
Propulsion<br />
Power<br />
Avionics Avionics<br />
419 lb<br />
105 lb<br />
126 lb<br />
25 lb<br />
183 lb<br />
Avionics<br />
37%<br />
Dry Weight Margin<br />
10%<br />
Power<br />
5%<br />
Figure 20: Weight Breakdown of Third Stage Solid.<br />
23%<br />
Propulsion<br />
25%<br />
Once the dry weight was calculated it was compared to similar fighter aircraft (<br />
Table 7). As this table shows the percentage of dry weight to GTOW is very<br />
similar for all of the heavy fighter aircraft shown. The baseline is expensive when<br />
25
compared with state of the art fighter designs. This cost can be attributed to the mission<br />
and speeds for which the baseline is designed.<br />
Table 7: Comparison of First Stage Weights to Similar Fighter Aircraft [8].<br />
GTOW Dry Weight Percentage<br />
Baseline 101,500 lbs 56,564 lbs 56%<br />
F-111 92,000 lbs 46,172 lbs 50%<br />
Mig 25 79,800 lbs 44,100 lbs 55%<br />
F-14 74,350 lbs 39,762 lbs 53%<br />
Aeroheating:<br />
The aeroheating analysis for the <strong>RASCAL</strong> design was complete using Miniver.<br />
Miniver is an aeroheating code that predicts the radiative equilibrium temperature for a<br />
given cross section and trajectory. The Miniver analysis was conducted for the first stage<br />
(the upper stages are released outside the atmosphere), at both the centerline of the<br />
aircraft, as well as the quarter chord location of the wing. Miniver takes the trajectory<br />
outputs as well as the geometry defined in the configuration and calculates the<br />
temperature at each position. The trajectory (AOA, Sideslip angle, altitude, and velocity)<br />
of the first stage was inputted to Miniver using 35 points all for the first stage. To model<br />
the geometry, 19 points were used on both the windward and leeward sides of the<br />
fuselage, while 8 points were used for both sides of the wing. A temperature profile for<br />
both the wing and the fuselage are included in Figure 21.<br />
26
Temperature (F)<br />
1400<br />
1300<br />
1200<br />
1100<br />
1000<br />
900<br />
800<br />
Leeward<br />
Windward<br />
Wing Leeward<br />
Wing Windward<br />
0 20 40 60 80 100<br />
Body Position (ft from Front)<br />
Figure 21: Radiative Equilibrium Temperature Calculated from Miniver.<br />
As this plot shows the maximum stagnation temperature on both the wing and nose does<br />
not exceed 1300 degrees F. Unfortunately, Aluminum’s reuse temperature is only 300<br />
degrees F. Therefore TPS is needed on the first stage. MA-25 was chosen due to its<br />
availability, and will be used as a spray-on ablator which would be reapplied on every<br />
flight [11]. This ablator is used extensively in the shuttle program and can withstand one<br />
time uses exceeding 1,200 degrees F. The overall weight of the TPS system is 865 lbs<br />
and is included in the weights and sizing sheet.<br />
The TPS for the second and third stages was neglected as well as the reentry of<br />
the first stage. The upper stages are released outside the sensible atmosphere so would<br />
not experience much heating. The reentry of the first stage may be significant, but to<br />
accommodate it, a generous safety factor of 1.5 was applied to the TPS weight on the first<br />
stage.<br />
27
Operations:<br />
The operation model for the <strong>RASCAL</strong> design was analyzed using a manpower<br />
analysis derived from historical X-15 data [12]. The <strong>RASCAL</strong> program will be a<br />
reduced manpower program that resembles a small X-plane architecture rather than a<br />
massive Space Shuttle architecture. A tool was developed in Excel to model the<br />
manpower necessary for the <strong>RASCAL</strong> program based upon the number of flights per<br />
year and the premise that one first stage could fly no more than 50 flights per year (TAT<br />
greater than 1 week). It was assumed that it would take 12 ground operators working on<br />
each <strong>RASCAL</strong> first stage with 26 flight operations officers (X-15 heritage) and one pilot<br />
for each first stage. There would also be one manager for each first stage aircraft with a<br />
minimum of 3 managers. The number of people was then multiplied by the average manyear<br />
number given for 2004 in Transcost ($220,500 USD (FY’04)) [13]. The necessary<br />
supplies were taken to be ten percent of the labor costs for both the ground and flight ops.<br />
The cost of operating the aircraft was calculated using a USAF average of<br />
operations cost per hour of flight [14]. This is then multiplied by a conservative 2.5<br />
hours per flight (averaging 230 mph over the flight). This then computes the aircraft<br />
operating costs. New facilities were assumed to be the vehicle assembly building which<br />
was set at the cost of a typical hanger with equipment ($50 M USD (FY’04)). A screen<br />
shot of the operations model is included as Figure 22.<br />
28
Operations:<br />
Number 1st Stages 5<br />
Number of Flights/yr 50<br />
Vehicle 4 2 is alt 8, 3 is alt 9<br />
Number of Years 20<br />
Aircraft Aircraft Ops Cost ($/hr) Time in Flight (hrs)<br />
Rascal 7000 2.5 $0.018 M<br />
Facilities<br />
New 50<br />
Upkeep (per Year) 0<br />
Ground Ops HC 60<br />
Flight Ops HC 26<br />
Pilots 5<br />
Management 5<br />
Total Head Count 96<br />
Flight Rate 50<br />
Ground Ops Supplies $1.323 M<br />
Ground Ops Labor $13.230 M<br />
Ground Ops Total $14.553 M<br />
Flight Ops Supplies $0.287 M<br />
Flight Ops Labor $5.733 M<br />
Flight Ops Total $6.020 M<br />
Other Labor $2.205 M<br />
Aircraft Ops $0.875 M<br />
Total Ops $23.653 M<br />
Ops/Flight $0.473 M<br />
Figure 22: Excel Operations Tool.<br />
Safety and Reliability:<br />
The safety and reliability analysis was conducted using GT-Safety II v1.6. This<br />
safety program is an Excel model that uses failure rates, vehicle configuration, and<br />
weights and sizes to calculate vehicle failure rates and casualty rates. The <strong>RASCAL</strong><br />
design was modeled as two stages with the upper stages combined into one stage with<br />
two engines with no engine out capability.<br />
The first stage of the <strong>RASCAL</strong> design was analyzed using the operations data as<br />
well as the cost data for required flights per year. Aggressive options for abort options<br />
and windows as well as crew escape were taken since the first stage features a high speed<br />
ejection seat, as well as the ability to land while fully loaded. Other factors such as<br />
subsystem failure rates were taken at 1/10 of the ELV data since the fighter operation<br />
29
should be significantly more reliable that ELV launches. It was also assumed that the<br />
first stage could land safely with two engines out, but fail to make the mission. This<br />
would give the vehicle a thrust to weight of at worst 0.6 at takeoff, which is well within<br />
the flight regimes of most fighter aircraft.<br />
The upper stages of the <strong>RASCAL</strong> design were modeled in GT Safety with much<br />
less aggressive numbers. The subsystem failure rates were taken at 80% of the ELV data<br />
since the second stage will act as an ELV, just operating outside the atmosphere. It was<br />
also assumed that the staging point would not be over a populate area. The resulting<br />
numbers for the reliability and safety analysis are included as Table 8.<br />
Table 8: GT Safety Outputs.<br />
1st Stage<br />
Loss of Mission MTBF 1 in 1094 Flights<br />
Loss of Vehicle MTBF 1 in 6494 Flights<br />
Casualty Rate<br />
Upper Stages<br />
0.0014<br />
Loss of Mission MTBF 1 in 149 Flights<br />
Loss of Vehicle MTBF 1 in 186 Flights<br />
Casualty Rate<br />
Total Vehicle<br />
0<br />
Loss of Mission MTBF 1 in 131 Flights<br />
Loss of Vehicle MTBF 1 in 180 Flights<br />
Casualty Rate 0.0015<br />
As this table shows the MTBF for the first stage is very good with a mission failure only<br />
once in 1094 flights. A loss of vehicle is even rarer with one occurring in 6494 flights.<br />
The casualty rate of 0.0014 is also exceptional with only one accident occurring every<br />
715 years. The upper stage is not nearly as reliable since it operates as a rocket rather<br />
than an aircraft. The loss of mission every 149 flights with a loss of vehicle every 186<br />
flights (80% of LOM failures are consider LOV). This reliability analysis results in an<br />
overall launch system that will lose a mission every 131 flights, a vehicle ever 180<br />
flights, and a man every 660 years. This loss of crew number is very high due to the<br />
abort capability and ejection system built into the manned components of the vehicle<br />
(first stage).<br />
30
Cost Estimation:<br />
The cost estimation for this project was conducted using the NASA-Air Force<br />
Cost Mode (NAFCOM), with some inputs from the Transcost model [13]. NAFCOM<br />
with some Transcost cost estimating relationships was used to calculate the DDT&E as<br />
well as the TFU for the <strong>RASCAL</strong> vehicle.<br />
To compute the first stage vehicle costs the weights of each of the subsystems was<br />
entered into NAFCOM. Using weight based CERS of the form of equation 5.<br />
COST *<br />
B<br />
= CF * A Weight<br />
(5)<br />
Each of the subsystems of the design has its own coefficients A and B. Therefore the<br />
user of NAFCOM can manipulate the cost of the components by adjusting the CF or<br />
complexity factor. For the <strong>RASCAL</strong> baseline complexity factor of close to one were<br />
used for all subsystems except the avionics which typically uses a CF of approximately<br />
0.3. The resulting costs for the first stage are included as Figure 23.<br />
In Millions of $<br />
Wing Group<br />
Tail Group<br />
Body Group<br />
TPS Group<br />
Landing Gear<br />
Electrical Conversion &<br />
Dist.<br />
Hydraulic Systems<br />
Surface Control Actuation<br />
Avionics<br />
Environmental Control<br />
Personal Equipment<br />
Engines<br />
Total<br />
DDTE<br />
$ 149.82<br />
$ 53.55<br />
$ 198.70<br />
$ 96.18<br />
$ 20.40<br />
$ 44.34<br />
$ 31.98<br />
$ 121.78<br />
$ 126.67<br />
$ 20.58<br />
$ 33.21<br />
$ 583.00<br />
$ 2,931.00<br />
F-22 TFU ~ $345<br />
TFU<br />
$ 21.47<br />
$ 7.28<br />
$ 57.14<br />
$ 20.02<br />
$ 0.66<br />
$ 14.69<br />
$ 5.08<br />
$ 81.58<br />
$ 7.55<br />
$ 2.77<br />
$ 1.30<br />
$ 6.00<br />
$ 446.00<br />
DDTE<br />
Hydraulic Systems<br />
4%<br />
Electrical Conversion<br />
& Dist.<br />
6%<br />
TFU<br />
Avionics<br />
3%<br />
Surface Control<br />
Actuation<br />
38%<br />
Landing Gear<br />
2%<br />
Environmental<br />
Control<br />
1%<br />
Surface Control<br />
Actuation<br />
17%<br />
TPS Group<br />
13%<br />
Hydraulic Systems<br />
2%<br />
Electrical Conversion<br />
& Dist.<br />
7%<br />
Figure 23: Cost Breakdown for <strong>RASCAL</strong> 1st Stage.<br />
Wing Group<br />
21%<br />
Body Group<br />
29%<br />
Personal Equipment<br />
1% Wing Group<br />
10%<br />
Tail Group<br />
3%<br />
TPS Group<br />
9%<br />
Landing Gear<br />
0%<br />
31<br />
Tail Group<br />
7%<br />
Body Group<br />
26%
This analysis results in a DDT&E cost of just under $3 B USD (FY’04) with a<br />
TFU of $446 M USD (FY’04). The engine DDT&E number includes a cost for<br />
developing the MIPCC technology, but no cost for developing the F-100 turbofans.<br />
When these numbers are compared to the F-22 program the TFU of the baseline comes<br />
out slightly high. (The TFU of the F-22 was backed out from the initial production order<br />
of six aircraft at a cost of 1.6 billion dollars with a learning curve of 85% [15]). The<br />
surface control and actuation seems high for this vehicle, but the complexity factor was<br />
left at 0.9 since the aerodynamic maneuvers performed by the first stage are occurring at<br />
high dynamic pressures and therefore require expensive actuators.<br />
The second and third stages were again modeled together as two engines. The<br />
CERs are similar to the ones used in the first stage analysis except they have been<br />
adjusted to use expendable data from Transcost [13]. For the upper stages the fuel<br />
casings for the solid propellant (for both the hybrid and the solid) are considered<br />
propulsion weight along with the nozzles.<br />
In Millions of $<br />
Body Group<br />
Power<br />
Avionics<br />
Engine Engine 2nd Stage<br />
Engine Engine 3rd Stage<br />
Total<br />
DDTE<br />
$ 36.09<br />
$ 4.52<br />
$ 28.64<br />
$ 174.88<br />
$ 14.81<br />
$ 417<br />
TFU<br />
$ 3.59<br />
$ 1.13<br />
$ 1.56<br />
$ 2.98<br />
$ 0.80<br />
$ 17<br />
DDTE<br />
Engine 2nd Stage<br />
67%<br />
TFU<br />
Engine 2nd Stage<br />
30%<br />
Engine 3rd Stage<br />
6%<br />
Engine 3rd Stage<br />
8%<br />
Avionics<br />
16%<br />
Figure 24: Cost Breakdown for Upper Stages.<br />
Body Group<br />
14%<br />
Power<br />
2%<br />
Body Group<br />
35%<br />
Power<br />
11%<br />
Avionics<br />
11%<br />
32
As this figure depicts the DDT&E for the upper stages are $417 M USD (FY ’04)<br />
with a TFU of $17 M USD (FY ’04). This TFU number has been used taking aggressive<br />
cost cutting numbers for the structure, power, and avionics (0.4, 0.3, and 0.3<br />
respectively). These numbers were justified since the structure and power systems are<br />
much simpler than systems NAFCOM was created to design. The engines seem to<br />
dominate both the DDT&E as well as the TFU. That is because the engines comprise of<br />
the majority of the vehicle weight (Only the power systems, connecting structure, and<br />
LOX tanks are not considered propulsion).<br />
Once these numbers were calculated they were combined into a cost calculating<br />
spreadsheet. This spreadsheet calculated the required number of flights and resulting<br />
number of first stages (one first stage required for every 50 flights per year). This was<br />
then combined with the operations model into one spreadsheet to calculate the overall<br />
costs of the program. Learning curves for both the first and upper stages was set to 85%.<br />
The upper stage takes advantage of this learning curve tremendously due to the number<br />
of flights necessary to reach the cost goals of $750,000 per flight or $5,000 per pound. A<br />
screen shot of the inputs page of the cost calculator is included as Figure 25.<br />
Inputs:<br />
Number 1st Stages 5<br />
Number of Flights/yr 50<br />
Vehicle 4 t 8, 3 is alt 9, 4 is baseline<br />
Number of Years 20<br />
LC Upper 85%<br />
LC 1st 85%<br />
Purchase 1st Stage Vehicle Y<br />
Purchase 2nd Stage Vehicle Y<br />
Pay DDTE Y<br />
New Facilities Y<br />
Outputs:<br />
Total Cost/Flight 7.701 $M<br />
$/lb $148,097<br />
Figure 25: Cost Calculator Input Page.<br />
To calculate the overall cost of the <strong>RASCAL</strong> program some assumptions were<br />
made. First it was decided that the program will begin in 2005 and last for 20 years<br />
33
(spreads the DDT&E over the life of the program). It was also decided that different<br />
scenarios would be looked at and the number of flights necessary to reach the <strong>RASCAL</strong><br />
cost goals would be calculated. The cases are described below:<br />
Case 1: Only the upper stages are purchased every flight. The production of the<br />
first stage as well as the DDT&E are paid for by some other agency<br />
(NASA, USAF, etc.).<br />
Case 2: The upper stages are purchased for every flight as well as the necessary<br />
first stages. The DDT&R is paid for by some other agency (NASA,<br />
USAF, etc.).<br />
Case 3: The total cost for the program is paid for by <strong>RASCAL</strong>. This includes the<br />
entire vehicle as well as all DDT&E and facilities<br />
Each of the cases was then calculated for the baseline and evaluated against each of the<br />
<strong>RASCAL</strong> cost goals<br />
Cost per Flight (Millions)<br />
10<br />
9<br />
8<br />
7<br />
6<br />
5<br />
4<br />
3<br />
2<br />
1<br />
0<br />
0 50 100 150 200 250 300<br />
Number of Flights per Year<br />
Figure 26: Baseline Cost per Flight.<br />
Baseline Case 1<br />
Baseline Case 2<br />
Baseline Case 3<br />
As the above figure shows only Case 1 reaches the desired goals in less than 250 flights<br />
per year (155 flights). Case 2 takes 336 flights per year where Case 3 takes 660 flights<br />
per year to reach the <strong>RASCAL</strong> goal of $750,000 per flight. The somewhat saw-tooth<br />
34
profile of the cost charts is due to the fact that a new first stage must be purchased every<br />
fifty flights per year (A first stage can only fly 50 flights per year for 20 years). Every<br />
time a new first stage must be purchased there is a cost jump for all three cases (Case 1<br />
the small jump is only due to the pilot, where as in the other cases it is due to the pilot<br />
and aircraft.<br />
$/lb<br />
10000000<br />
1000000<br />
100000<br />
10000<br />
1000<br />
0 50 100 150 200 250 300<br />
Number of Flights per Year<br />
Figure 27: Baseline Dollars per Pound of Payload.<br />
Baseline Case 1<br />
Baseline Case 2<br />
Baseline Case 3<br />
When the second cost goal of <strong>RASCAL</strong> is analyzed the answer is not as promising. Due<br />
to the actual payload of 52 lbs calculated in the performance section no case reaches the<br />
$5,000 per pound goal in 250 flights. Case 1 takes 594 flights per year, Case 2 takes<br />
1511 flights per year, and Case 3 takes 2490 flights per year to meet the <strong>RASCAL</strong> cost<br />
goal. This is of course unreasonable numbers since the demand will never be close to two<br />
flights a day, which is the best case scenario for $5,000 per pound.<br />
35
Baseline Conclusions:<br />
After the <strong>RASCAL</strong> design has been evaluated it has been found to be<br />
underperforming and well above the cost numbers quoted as goals. The payload is far<br />
below the stated performance goal and the costs are far higher than the cost goals. The<br />
52 lbs of payload is only 20% of the stated goal of 250 lbs. This is well below the goal<br />
and the weight of most small satellites. The flight rates necessary to reach the two cost<br />
goals are summarized in Table 9.<br />
Table 9: Cost Goal Summary for Baseline.<br />
$750,000 per Flight $5,000 per lb<br />
Case 1 155 594<br />
Case 2 336 1511<br />
Case 3 660 2490<br />
Only the case 1 scenario approaches reasonable flight number of about once every 2.5<br />
days for $750,000 a flight. Even this number may be unachievable if the demand is not<br />
there.<br />
Design Alternatives:<br />
Because the shortcomings in the baseline <strong>RASCAL</strong> design the same DSM was<br />
used to evaluate different alternatives to this baseline. These alternatives were first<br />
evaluated on a performance basis and then the most promising alternative will be chosen<br />
to be completely evaluated as the GT <strong>RASCAL</strong> design. The alternatives looked at in the<br />
<strong>RASCAL</strong> designs are as follows in Table 10.<br />
Table 10: Design Alternatives for <strong>RASCAL</strong> Baseline.<br />
Alternatives Number Description:<br />
1 Changing the hybrid oxidizer from H2O2 to LOX<br />
Changing the first stage main structure (wing, tail, and<br />
2<br />
fuselage) to a Metal Matrix Composite (MMC).<br />
Add a fourth kick stage so the second and third stages<br />
3 only have to propel the rocket to an intermediate orbit<br />
(80X270)<br />
4 Combine Alternative 1 and 3<br />
5 Combine Alternative 1, 2, and 3<br />
36
Each of these alternatives will be closed in the performance aspects of the DSM (all<br />
except cost, operations, and economics). Unless noted all alternatives represent one<br />
change off of the baseline at a time.<br />
Alternative 1:<br />
The first alternative will be to change the second stage oxidizer from hydrogen<br />
peroxide to liquid oxygen. The advantage of making this change is that the Isp of the<br />
second stage will increase to 340 seconds vs. the 310 seconds for the hydrogen peroxide.<br />
A disadvantage to this change is that the second stage will become larger. This is due to<br />
the fact that the HTPB/LOX combination operates at a lower O/F ratio (1.9 vs. 6.5). This<br />
smaller mixture ratio results in a larger rocket. This alternative configuration was closed<br />
in the internal iteration loop of the DSM and this alternative resulted in the overall<br />
payload capacity of the baseline <strong>RASCAL</strong> design increasing from 52 lbs to 75 lbs.<br />
Alternative 2:<br />
The second alternative involves changing the baseline first stage structural<br />
material from standard aluminum to a metal matrix composite. This MMC will not only<br />
make the design much lighter, it will also eliminate the need for a thermal protection<br />
system (up to 1500 F). This is due to the fact that the reuse temperature of the MMC is<br />
higher than the temperatures encountered by the first stage. The disadvantage to the<br />
MMC is that it is an immature technology, and must be developed and tested far more<br />
that the typical aluminum structure. This will cause the DDT&E of the design to increase<br />
dramatically over the baseline. This alternative configuration was closed in the internal<br />
iteration loop of the DSM and this alternative resulted in the overall payload capacity of<br />
the baseline <strong>RASCAL</strong> design increasing from 52 lbs to 110 lbs.<br />
Alternative 3:<br />
The third alternative involves changing the trajectory of the upper stages so that<br />
the second and third stages put the payload into a transfer orbit (80 nmi by 270 nmi<br />
orbit). A fourth stage solid motor is then added to the upper stage to circularize the<br />
37
payload at the 270 nmi circular orbit. An advantage to this alternative is that the upper<br />
stages will become smaller each performing a smaller ∆V. A disadvantage of this<br />
approach is that the fourth stage will add dry mass to the system as well as involve<br />
another component that could fail. This could result in a lower total system reliability.<br />
This alternative could result in an increased cost due to the addition of the extra stage.<br />
(The GT <strong>RASCAL</strong> cost analysis will show this cost is actually made up for in the weight<br />
reduction). This alternative configuration was closed in the internal iteration loop of the<br />
DSM and this alternative resulted in the overall payload capacity of the baseline<br />
<strong>RASCAL</strong> design increasing from 52 lbs to 211 lbs.<br />
Alternative 4:<br />
The fourth alternative involves combining the LOX hybrid with the fourth stage<br />
kick motor. This will carry the advantages of improving the upper stages without altering<br />
the first stage design. It will result in a slightly more expensive rocket than the baseline,<br />
but will start to approach the payload numbers set out in the <strong>RASCAL</strong> program. This<br />
alternative configuration was closed in the internal iteration loop of the DSM and this<br />
alternative resulted in the overall payload capacity of the baseline <strong>RASCAL</strong> design<br />
increasing from 52 lbs to 224 lbs.<br />
Alternative 5:<br />
The fifth and final alternative involves combining the LOX hybrid with the fourth<br />
stage kick motor and the MMC upper stage. This design should result in the highest<br />
performance since it uses all of the enhancing alternatives presented. This alternative<br />
should also result in the most expensive vehicle since the LOX hybrid adds length to the<br />
first stage, the fourth stage adds the cost of a new stage, and the new MMC technology<br />
needs to be matured. When this configuration was closed in the internal iteration loop the<br />
DSM the payload increased from 52 lbs to 303 lbs. This is above the desired 250 lbs of<br />
payload set out in the <strong>RASCAL</strong> goal. This higher payload means that this alternative can<br />
be further scaled down to achieve the 250 lb goal.<br />
38
1+2+3<br />
1+3<br />
4th Stage<br />
MMC 1st<br />
Lox Hybrid<br />
Baseline<br />
0 50 100 150 200 250 300 350<br />
Payload (lbs)<br />
Figure 28: Payload Capacity for Alternative Designs<br />
A summary of the payload capacity of the alternatives is presented as Figure 28.<br />
The LOX Hybrid second stage shows promise for improving the performance of the<br />
second stage by adding efficiency (higher Isp), but comes with the cost of having a longer<br />
vehicle. The MMC alternative also adds performance, but at the cost of using an<br />
unproven technology on the first stage. This technology may not come to maturity by the<br />
time the <strong>RASCAL</strong> is ready to fly. Adding the fourth stage to the design adds the most<br />
performance without changing the first stage. This fourth stage adds performance by<br />
allowing the second and third stages to propel the satellite into a transfer orbit. This<br />
transfer orbit does not incur the same steering losses that are obtained by flying directly<br />
into a circular orbit. A combination of the alternatives needs to be used to create the<br />
optimal design. Only the fourth and fifth alternatives are capable of achieving the<br />
required performance so those designs will be further optimized to the <strong>RASCAL</strong><br />
performance goals and then compared.<br />
To fully evaluate the designs the fourth and fifth alternatives (1+3, 1+2+3) were<br />
reoptimized to the <strong>RASCAL</strong> goals (250 lbs to sun-synchronous orbit). This was possible<br />
by scaling up alternative four and scaling down alternative five. This reoptimization was<br />
39
done to compare the two vehicles with the same performance. This was be completed by<br />
combining both the first and second stages into one trajectory deck and letting the<br />
optimizer find the smallest vehicle (weight consumed) that can get 250 lbs to the 98<br />
degree sun-synchronous orbit. These vehicles will be closed in much the same way as<br />
the baseline with both vehicles being evaluated in the DSM and the resulting<br />
performance and costs compared.<br />
Each of the alternatives was able to meet the performance goals set out by the<br />
<strong>RASCAL</strong> program. A summary of the total weights of the resulting designs is included as<br />
Figure 29. As this figure shows, at each stage the fifth alternative results in a smaller<br />
vehicle. The MMC technology offered a lighter, better performing first stage, which<br />
allowed the second stage to achieve a smaller ∆V. The baseline is also included in this<br />
figure even though the payload of the baseline is only 20% that of the alternative designs.<br />
Weight (lbs)<br />
120000<br />
100000<br />
80000<br />
60000<br />
40000<br />
20000<br />
0<br />
Baseline<br />
Alternative 4<br />
Alternative 5<br />
Payload<br />
52 lbs<br />
250 lbs<br />
250 lbs<br />
Gross Weight Dry Weight 1st Gross Weight Upper<br />
Figure 29: Optimized Alternatives Performance Comparison<br />
Baseline<br />
Alternative 4<br />
Alternative 5<br />
40
The design alternatives were costed in much the same way as the baseline the<br />
alternative designs were costed using a combination of the NAFCOM tool as well as<br />
Transcost CERs. The cost analysis results for cost per flight follows as Figure 30.<br />
Cost per Flight (Millions)<br />
10<br />
9<br />
8<br />
7<br />
6<br />
5<br />
4<br />
3<br />
2<br />
1<br />
0<br />
0 50 100 150 200 250 300<br />
Number of Flights per Year<br />
Figure 30: Cost per Flight Comparisons of Optimized Alternatives.<br />
Alt 8 Case 1<br />
Alt 9 Case 1<br />
Baseline Case 1<br />
Alt 8 Case 2<br />
Alt 9 Case 2<br />
Baseline Case 2<br />
Alt 8 Case3<br />
Alt 9 Case 3<br />
Baseline Case 3<br />
As this figure shows the baseline has the cheapest cost per flight of every design.<br />
This is misleading because cost per flight does not take into account the fact that the<br />
baseline only carries 52 lbs to orbit. If only the alternatives which reach the performance<br />
requirement are evaluated alternative 5 results in the lowest cost per flight for Case 1 and<br />
2, with alternative 4 being the cheapest for Case 3. The reason alternative 4 is cheaper in<br />
Case 3 is due to the higher DDT&E costs of alternative 5 over alternative 4 ($3.675 B vs.<br />
$3.48 B respectively). This higher DDT&E is due to the increased cost of having a<br />
MMC first stage, which is not a fully mature technology. The increased cost of the<br />
MMC is taken into account through the use of complexity factors on the CERs. The<br />
complexity factors take into account the fact that some designs may cost more per pound<br />
than conventional designs due to the complexity of the materials or processes used in the<br />
manufacture of the design.<br />
41
Even though the complexity factors were set higher for the MMC design<br />
alternative 4 has a higher TFU than alternative 5 ($464 M vs. $446 M). This is due to<br />
alternative 5 having a much lower weight per stage than alternative 4. This weight<br />
savings results in a cheaper vehicle than alternative four even with complexity factors<br />
that are almost twice as high. This is due to the weight-based CERs favoring the lighter<br />
vehicle with the high complexity factors over the heavier vehicle.<br />
The dollars per pound of payload was also calculated for both alternatives as well<br />
as the baseline (Figure 31). This dollar per pound of payload comparison penalizes the<br />
baseline for only taking 52 lbs versus the 250lbs of the alternatives. As this figure shows<br />
the two alternatives are very similar again, with alternative 5 being slightly better in case<br />
1 and 2 and slightly worse in case 3.<br />
$/lb<br />
50000<br />
45000<br />
40000<br />
35000<br />
30000<br />
25000<br />
20000<br />
15000<br />
10000<br />
5000<br />
0<br />
0 50 100 150 200 250 300<br />
Number of Flights per Year<br />
Figure 31: Dollars per Pound of Payload of Optimized Trajectories.<br />
Alt 8 Case 1<br />
Alt 9 Case 1<br />
Baseline Case 1<br />
Alt 8 Case 2<br />
Alt 9 Case 2<br />
Baseline Case 2<br />
Alt 8 Case 3<br />
Alt 9 Case 3<br />
Baseline Case 3<br />
42
GT <strong>RASCAL</strong>:<br />
From this alternative analysis one design was chosen to be the Georgia Tech<br />
<strong>RASCAL</strong> design. From the alternative analysis either alternative 4 or alternative 5 were<br />
both feasible and viable solutions. Alternative 5 was chosen as the Georgia Tech design<br />
because of its lower costs on economic Cases 1 and 2. Case 3 was determined to be a<br />
non-factor since the flight rates necessary to reach this case were about one flight a day<br />
for the $5,000 per pound of payload and two flights a day for the $750,000 per flight<br />
goal. These flight rates will probably never be attainable, and therefore case three should<br />
not be a deciding factor on which alternative to chose. As three-view drawing of<br />
alternative 5 follows (Figure 32).<br />
95 ft<br />
Figure 32: GT <strong>RASCAL</strong> Three-view Drawing.<br />
As this drawing shows the GT <strong>RASCAL</strong> design is significantly longer than the baseline<br />
<strong>RASCAL</strong> design to accommodate the longer, yet lighter upper stage using a LOX/HTPB<br />
hybrid. A comparison of the GT <strong>RASCAL</strong> and the baseline <strong>RASCAL</strong> follows (Table 11).<br />
81 ft<br />
43
Table 11: Comparison of GT <strong>RASCAL</strong> with Baseline.<br />
Baseline GT <strong>RASCAL</strong><br />
Length 89 ft 95 ft<br />
Payload Bay Length 42 ft 48 ft<br />
GTOW 101,502 lbs 84,549 lbs<br />
Gross Weight Upper Stages 16,000 lbs 14,273 lbs<br />
Payload 52 lbs 250 lbs<br />
Technologies MIPCC, Hybrid 2nd Stage MIPCC, MMC, Hybrid 2nd Stage<br />
As this table shows the GT <strong>RASCAL</strong> is lighter in both the GTOW as well as the upper<br />
stage gross weight. The GT <strong>RASCAL</strong> design carries five times the payload to orbit only<br />
using one more technology than the baseline, as well as a fourth stage. A size<br />
comparison of the baseline, GT <strong>RASCAL</strong>, and an F-15 follows as Figure 33.<br />
10<br />
20<br />
30<br />
40<br />
ft<br />
50<br />
60 70<br />
F-15<br />
Figure 33: Comparison of GT <strong>RASCAL</strong>, Baseline, and F-15.<br />
80<br />
90<br />
Baseline<br />
GT <strong>RASCAL</strong><br />
44
As this figure shows the GT <strong>RASCAL</strong> design is only slightly longer than the baseline<br />
design and comparable with the F-15, whose engine the <strong>RASCAL</strong> designs share (F-15<br />
carries 2 F-100s while the GT <strong>RASCAL</strong> carries 4 F-100s).<br />
A weight breakdown was conducted for the GT <strong>RASCAL</strong> design. This dry<br />
weight breakdown for the <strong>RASCAL</strong> first stage follows (Figure 34). As this figure shows<br />
the TPS and hydraulic systems were eliminated in the GT <strong>RASCAL</strong> design. The TPS<br />
was eliminated due the high temperature resistance of the MMC and the hydraulic fluid<br />
was eliminated by using electromechanical actuators for all flight control systems. Since<br />
the propulsion segments remained static when compared with the baseline design, the<br />
percentage of propulsion weight actually increases due to the decreased weight of the<br />
system.<br />
Gross Weight Weight<br />
Dry Weight Weight<br />
Wing Group Group<br />
Tail Group Group<br />
Body Group<br />
TPS<br />
Landing Gear<br />
Main Propulsion<br />
Electrical Conversion and Distribution<br />
Hydraulic Systems<br />
Surface Control Control and Actuators<br />
Avionics<br />
Environmental Control<br />
Personnel Equipment<br />
Dry Weight Margin<br />
84,550 lb lb<br />
5,183 lb<br />
6,200 lb<br />
660 660 lb<br />
7,570 lb<br />
0 lb<br />
2,600 lb<br />
16,980 lb<br />
1,140 lb<br />
0 lb<br />
1,820 lb<br />
1,910 lb<br />
200 lb<br />
220 lb<br />
5,890 lb<br />
Environmental<br />
Control<br />
0%<br />
Avionics<br />
4%<br />
Surface Control and<br />
Actuators<br />
4%<br />
Hydraulic Systems<br />
0%<br />
Electrical<br />
Conversion and<br />
Distribution<br />
3%<br />
Personnel<br />
Equipment<br />
0%<br />
Dry Weight Margin<br />
13%<br />
Main Propulsion<br />
38%<br />
Figure 34: Weight Breakdown of 1st Stage of GT <strong>RASCAL</strong>.<br />
Wing Group<br />
14%<br />
Tail Group<br />
1%<br />
Body Group<br />
17%<br />
TPS<br />
0%<br />
Landing Gear<br />
6%<br />
A weight breakdown was also completed for the upper stages of the GT <strong>RASCAL</strong><br />
design. The following figure shows how the gross weight of the upper stages has<br />
decreased due to the fact that the higher Thrust to Weight Ratio (T/W) first stage can<br />
propel the upper stage higher and faster. (T/W increases since the 4 MIPCC F-100 thrust<br />
is constant and the MMC first stage is lighter). Also the transfer orbit, although requiring<br />
a faster insertion speed, doesn’t have as high of gravity and thrust vectoring losses as the<br />
45
higher orbit. Therefore the upper stage doesn’t have to provide as much energy to the<br />
system and can therefore be smaller.<br />
Gross Weight Weight<br />
Dry Dry Weight<br />
Structure<br />
Propulsion Propulsion<br />
Power<br />
Dry Weight Margin<br />
14,270 lb<br />
2,180 lb<br />
1,160 lb<br />
370 lb<br />
130 lb<br />
280 lb<br />
Dry Weight Margin<br />
15%<br />
Power<br />
7%<br />
Propulsion<br />
19%<br />
Figure 35: Weight Breakdown of GT <strong>RASCAL</strong> 2nd Stage.<br />
Structure<br />
59%<br />
The third stage of the GT <strong>RASCAL</strong> also benefits from the weight savings in the<br />
first stage. The third stage is 500 lbs lighter than the baseline. This can be attributed to<br />
the same energy savings as the second stage as well as the fact that a fourth stage has<br />
been added.<br />
Gross Weight<br />
Dry Weight<br />
Structure<br />
Propulsion<br />
Power<br />
Avionics<br />
Dry Weight Margin<br />
2,750 2,750 lb<br />
370 370 lb<br />
110 110 lb<br />
100 100 lb<br />
30 lb<br />
180 180 lb<br />
50 lb<br />
Dry Weight Margin<br />
10%<br />
Avionics<br />
40%<br />
Figure 36: Weight Breakdown of GT <strong>RASCAL</strong> 3rd Stage.<br />
Power<br />
5%<br />
Structure<br />
23%<br />
Propulsion<br />
22%<br />
The Fourth and final stage of the GT <strong>RASCAL</strong> design utilizes a very small<br />
apogee kick motor. This motor is just over 32 lbs with a dry weight of 9lbs. This engine<br />
was sized using a simple two body orbital mechanics as well as the rocket equation<br />
∆ (6)<br />
V = g 0I<br />
sp<br />
ln( MR)<br />
This finite burn is relatively accurate since the circularization burn is very short.<br />
It is also informative to look at the percentage of fuel used in each phase of the<br />
first stages flight (Figure 37). From this figure it can be seen that the majority of the fuel<br />
46
used in the GT <strong>RASCAL</strong> design is in the zoom maneuver. The cruise out and loiter are<br />
also significant since the first stage still is carrying the upper stages as payload. Once the<br />
first stage completes the zoom maneuver it must return back to the airfield. The zoom<br />
maneuver adds almost 180 nautical miles of downrange that must be flown in the cruise<br />
home segment of the trajectory. This cruise home uses less fuel that the cruise out even<br />
though it is 90 nautical mile longer because of the reduced weight of the first stage. In<br />
case of an abort, the first stage is not equipped to fly back the entire 430 nmi with the<br />
payload bay full. The extra fuel required to accomplish this would grow the first stage to<br />
over 120,000 lbs. This large increase in weight is due to the fact that the extra fuel must<br />
be carried during the zoom maneuver and results in a high weight penalty.<br />
When looking at the zoom maneuver almost all of the propellant is fuel. That is<br />
because the first stage accelerates to Mach 3 before it starts to climb out of the<br />
atmosphere and loses the majority of its oxidizer intake. The zoom maneuver uses more<br />
water than lox because the water is used from Mach 1 onward where are the LOX is not<br />
used until later in the trajectory. The water is the major factor in the MIPCC system<br />
since it increases the density of the flow and cools the turbo machinery, where as the<br />
LOX mainly stabilizes the combustion at high altitudes.<br />
Landing Taxi, Shutdown<br />
Descent<br />
Cruise Home<br />
Ascent Reserve Reserve and Unusable Unusable<br />
Zoom Maneuver Maneuver<br />
Loiter<br />
Cruise Cruise Out Out<br />
Climb<br />
Takeoff<br />
Taxi<br />
Engine Start and and Warm-up Losses<br />
Zoom Maneuver Fuel<br />
Fuel<br />
Water<br />
Lox<br />
228 lb<br />
461 lb<br />
3,497 lb<br />
19 lb<br />
9,690 lb<br />
2,876 lb<br />
3,216 3,216 lb lb<br />
2,344 lb<br />
829 lb lb<br />
837 lb<br />
845 lb<br />
6,008 lb<br />
1,758 lb<br />
525 525 lb<br />
Climb<br />
9%<br />
Engine Start and<br />
Warm-up Losses<br />
Taxi<br />
3%<br />
3%<br />
Takeoff<br />
3%<br />
Cruise Out<br />
13%<br />
Water<br />
21%<br />
Loiter<br />
12%<br />
Figure 37: First Stage Fuel Breakdown of GT <strong>RASCAL</strong>.<br />
Lox<br />
6%<br />
Landing Taxi,<br />
Shutdown<br />
1%<br />
Descent<br />
2%<br />
Cruise Home<br />
14%<br />
Ascent Reserve<br />
and Unusable<br />
0%<br />
Zoom Maneuver<br />
40%<br />
Fuel<br />
73%<br />
47
When the entire launch system is combined the weight breakdown follows<br />
(Figure 38). As this figure shows even with the MMC the dry weight is still 54% of the<br />
vehicle weight. That is important to note because over 54% weight of the system is<br />
reusable even though only one of the four stages are reusable.<br />
Gross Takeoff Weight<br />
1st Dry Dry<br />
1st Fuel<br />
1st Oxidizer<br />
1st H20<br />
2nd Dry<br />
2nd 2nd Fuel<br />
2nd Oxidizer<br />
3rd Dry<br />
3rd Fuel<br />
Payload<br />
84,549 84,549 lb lb<br />
45,661 45,661 lb<br />
22,583 22,583 lb<br />
525 lb<br />
1,758 lb<br />
2,178 lb<br />
3,220 3,220 lb<br />
6,118 6,118 lb<br />
421 lb<br />
2,086 lb<br />
250 lb<br />
2nd Fuel<br />
4%<br />
2nd Dry<br />
3%<br />
1st H20<br />
2%<br />
1st Oxidizer<br />
1%<br />
1st Fuel<br />
27%<br />
2nd Oxidizer 3rd Fuel<br />
7% 3rd Dry 2%<br />
0%<br />
Payload<br />
0%<br />
Figure 38: Overall Weight Breakdown of GT <strong>RASCAL</strong> (Fourth Stage Omitted).<br />
A final mission profile for the GT <strong>RASCAL</strong> design is also included (Figure 39).<br />
As this figure shows the release of the second stage is at a higher altitude and a higher<br />
velocity than the baseline. This allows the upper stage rockets to be much smaller and in<br />
turn reduces the first stage weight further. This mission profile also shows that the GT<br />
<strong>RASCAL</strong> design releases the payload from the bottom of the first stage. This was<br />
decided since when the first stage drops the payload there is still over 1200 lbs of lift on<br />
the first stage. When they payload is released it will fall faster than the first stage and<br />
therefore will be farther away that the same payload dropped from the top of the first<br />
stage.<br />
48<br />
1st Dry<br />
54%
Figure 39: GT <strong>RASCAL</strong> Mission Profile.<br />
The trajectory plots for the GT <strong>RASCAL</strong> vehicle follow as Figure 40 and Figure<br />
41. As these plots show the trajectory of the GT <strong>RASCAL</strong> is very similar to that of the<br />
baseline. The major differences are, as already noted, that the first stage releases the<br />
upper stages with much more energy and that the third stage puts the fourth stage and<br />
payload in a lower transfer orbit, where fewer losses incur. These plots also show the<br />
tendency of the MIPCC engines to peak in thrust when the fuel flow rate of the LOX and<br />
water is at its highest (~94% of SLS thrust). When this occurs the Isp of the MIPCC<br />
engines plummets due to this same increased flow rate.<br />
49
Mach<br />
35<br />
30<br />
25<br />
20<br />
15<br />
10<br />
Thrust (lbs)<br />
5<br />
0<br />
2 nd Stage Ignition<br />
0 100 200 300 400 500 600 700<br />
120000<br />
100000<br />
80000<br />
60000<br />
40000<br />
20000<br />
0<br />
3 rd Stage Ignition<br />
Time of Flight (secs)<br />
600<br />
500<br />
400<br />
300<br />
200<br />
100<br />
Figure 40: GT <strong>RASCAL</strong> Trajectory (Mach & Altitude).<br />
0 100 200 300 400 500 600 700<br />
Time (secs)<br />
0<br />
2500<br />
2000<br />
1500<br />
1000<br />
500<br />
Figure 41: GT <strong>RASCAL</strong> Trajectory (Thrust and ISP).<br />
0<br />
Altitude (kft)<br />
ISP (secs)<br />
Mach<br />
Altitude<br />
Thrust<br />
ISP<br />
50
When the final cost numbers of the GT <strong>RASCAL</strong> design were calculated, they<br />
were compared with the initial <strong>RASCAL</strong> goals. A summary of the number of flights<br />
necessary to obtain the two <strong>RASCAL</strong> cost goals follow as Table 12 and Table 13.<br />
Table 12: GT <strong>RASCAL</strong> Flights per Year to Attain $5,000 per Pound of Payload.<br />
Case 1: Purchase Only Expendables 91 flights per year<br />
Case 2: Purchase Only Flight Vehicles 125 flights per year<br />
Case 3: Purchase Vehicles and DDT&E 363 flights per year<br />
As Table 12 shows, the GT <strong>RASCAL</strong> design can meet the case 1 economic scenario with<br />
only 91 flights and two first stage aircraft, while the case 2 economic scenario can be<br />
meet with just 125 flight and three first stage aircraft. The third case, as previously<br />
noted, if very tough with even the GT <strong>RASCAL</strong> design. For this case the vehicle must<br />
fly about once a day with eight first stage vehicles. The alternative four design actually<br />
falls slightly below this number at 361 flights per year.<br />
Table 13: GT <strong>RASCAL</strong> Flights per Year to Attain $750,000 per Flight<br />
Case 1 176 flights per year<br />
Case 2 350 flights per year<br />
Case 3 742 flights per year<br />
The second cost goal of $750,000 dollars per flight is slightly harder to obtain. For case<br />
1 it takes 176 flights per year with four first stage aircraft. Case 2 requires 350 flights<br />
with seven first stage aircraft, while Case 3 requires 742 flights per year with a fleet of 15<br />
first stage aircraft.<br />
Conclusions:<br />
For this project both the baseline vehicle and five alternative vehicles were<br />
examined. When the baseline vehicle was evaluated it was found to fall short of the<br />
performance as well as the cost goals set by DARPA for the <strong>RASCAL</strong> program. The<br />
baseline vehicle was found to only carry 52 lbs to the 270 nmi sun synchronous orbit.<br />
When the baseline vehicle was costed it was found to meet the first cost goal of $750,000<br />
per flight in just 155 flights per year for economic Case 1, 366 flights per year for Case 2,<br />
and 660 flights per year for Case 3. Unfortunately the $5,000 dollar per pound goal was<br />
51
hindered by the smaller than expected payload capacity and the number of flights per<br />
year was greater than 500 for all cases.<br />
Several alternatives of the baseline design were analyzed to try to produce a<br />
feasible and viable design. From this alternative analysis two were continued through the<br />
entire design process. These optimized alternatives were both able to reach the<br />
performance goals set out by DARPA as well as being very similar in the number of<br />
flights necessary to meet the cost goals. The alternative 5 design was chosen as the GT<br />
<strong>RASCAL</strong> design because of the lower number of flights necessary to meet both cost<br />
goals of $750,000 per flight and $5,000 per pound for two of the three economic cases.<br />
The GT <strong>RASCAL</strong> only cost slightly more than alternative 4 in the Case 3 economic<br />
scenario. This was the most unlikely scenario since it required an enormous amount of<br />
flights to meet the <strong>RASCAL</strong> cost goals.<br />
The GT <strong>RASCAL</strong> design can meet DARPA’s performance goals and reach the<br />
cost goals of $5,000 per pound of payload with eight first stage vehicles flying 46 times<br />
per year for a total of 369 flights per year. Different economic cases were also evaluated<br />
to try and meet the cost goals in a less ambitious number of flights per year. It was found<br />
that if the DDT&E was paid for by another party (NASA, DOD, etc.) the cost goals can<br />
be met with just three vehicles flying 42 times per year for a total of 125 flights per year.<br />
52
References:<br />
1. Cyr, Kelley, “US <strong>Launch</strong> Vehicle Data,” March 26, 2004,<br />
URL: http://www.jsc.nasa.gov/bu2/ELV_US.html, Last visited 5/2/04.<br />
2. Space Space <strong>Launch</strong> Corporation, URL:<br />
http://www.spacelaunch.com/<strong>RASCAL</strong>.asp, Last visited 5/2/04.<br />
3. Alford, William, “NASA Assessment of United States Navy F-14 Airplane<br />
Designs,” Langley Working Paper LWP-794, Hampton Virginia, 1969.<br />
4. Pratt and Whitney Products: F-100, URL: http://www.prattwhitney.com/prod_mil_f100.asp,<br />
Last visited 5/2/04.<br />
5. Bechtel, Ryan, “Turbine Based Engine Analysis Tool”. URL:<br />
http://www.ssdl.gatech.edu/~ssdl/T-BEAT/T-BEAT.html, Last visited 4/15/04.<br />
6. Carter, Preston, “Mass Injection and Precompressor Cooling Engines Analyses,”<br />
AIAA-2002-4127, 38th AIAA Joint Propulsion Conference and Exhibit,<br />
Indianapolis, Indiana, July 7-10 2002.<br />
7. Humble, Ronald, Larson, Wiley, and Wertz, James, Space Mission Analysis and<br />
Design, 3rd Ed. Microcosm, New York: 1999.<br />
8. Roskam, Jan, Airplane Design Part I: Preliminary Sizing of Airplanes, DAR<br />
Corporation, Lawrence, Kansas: 1997.<br />
9. Powell, R.W., et. Al., “Program to Optimize Simulated Trajectories (POST)<br />
Utilization Manual, Volume II, Version 5.2,” NASA Langley Research Center,<br />
Hampton, VA; Martin Marietta Corporation, Denver, CO., October 1997.<br />
10. Rohrschneider, R., "Development of a Mass Estimating Relationship Database for<br />
<strong>Launch</strong> Vehicle Conceptual Design," AE8900 Special Project, Georgia Institute<br />
of Technology, April 26, 2002.<br />
11. Lockheed Martin Space Systems Company: Thermal Protection, URL:<br />
http://www.lockheedmartin.com/michoud/products/tpp/tpp_ma25.htm, Last visited 5/2/04.<br />
12. Morris, W. Douglas, “X-15/HL-20 Operations Support Comparison,” NASA<br />
Technical Memorandum 4453, June 1993.<br />
13. Koelle, Dietrich, “Handbook of Cost Engineering for Space Transportation<br />
Systems with Transcost ,” TransCostSystems, Liebigweg, Germany, 2000.<br />
14. Crippen, Dan L, “The Effects of Aging on the Costs of Operating and<br />
Maintaining Military Equipment,” Congressional Budget Office, August 2001.<br />
http://www.cbo.gov/showdoc.cfm?index=2982&sequence=0, Last visited 5/2/04.<br />
15. Rodrigues, Louis J. “Progress in Meeting F-22 Cost and Schedule Goals,”<br />
General Accounting Office,1999.<br />
General References:<br />
1. Benson, T., “Earth Atmosphere Model,” June 4, 2002,<br />
http://www.grc.nasa.gov/WWW/K- 12/airplane/atmos.html, Last visited 5/2/04.<br />
2. Raymer, Daniel P., Aircraft Design a Conceptual Approach, AIAA Education<br />
Series, Reston, VA, 1999.<br />
3. Wall, Robert, “Hot Rod to Space,” Aviation Week. McGraw<br />
Hill Corp: September 22, 2003.<br />
53
Appendix:<br />
Conceptual Design Renderings:<br />
54