l)"i11 - University of Oxford
l)"i11 - University of Oxford
l)"i11 - University of Oxford

Create successful ePaper yourself
Turn your PDF publications into a flip-book with our unique Google optimized e-Paper software.
CFI OCCASIONAL PAPER<br />
Number 20<br />
PLANNING, PERFORMANCE AND<br />
EVALUATION OF GROWTH<br />
AND YIELD STUDIES<br />
edited by<br />
H.L. Wright<br />
1983<br />
1:11- OD .<br />
Commonwealth Forestry Institute<br />
<strong>University</strong> <strong>of</strong> <strong>Oxford</strong><br />
Proceedings <strong>of</strong> the meeting <strong>of</strong><br />
IUFRO Subject Group 54.01<br />
<strong>Oxford</strong>. September 1979<br />
ISBN 0 85074 062 2<br />
ISSN 0141-8181
INTRODUCTION<br />
LIST OF PARTICIPANTS<br />
- i -<br />
TABLE OF CONTENTS<br />
PAPERS PRESENTED (in alphabetical order <strong>of</strong> author)<br />
Where is the ground?<br />
Do future establishments <strong>of</strong> permanent<br />
sample plots in Britain need to follow<br />
past practice to meet the requirements<br />
<strong>of</strong> forest management?<br />
Portable data terminals for data<br />
collection in the field<br />
Collecting growth data<br />
Growth functions for radiata pine<br />
plantations<br />
Sample plots and experiments in crop<br />
development studies<br />
A caliper for use in tropical rainforest<br />
management<br />
A stem analysis machine under<br />
development<br />
Stem pr<strong>of</strong>ile analysis<br />
The permanent sample plot system <strong>of</strong> the<br />
New Zealand Forest Service<br />
Comparison <strong>of</strong> two stand growth models for<br />
northern hardwoods<br />
Estimation <strong>of</strong> the volume <strong>of</strong> a stand using<br />
a tariff procedure<br />
A flexible yield and management model for<br />
spruce in the Belgian Ardennes<br />
A stand growth model as a tool in studying<br />
management options for MAB-rainforest<br />
ecosystem projects and for temperate<br />
forests<br />
Application <strong>of</strong> a factorial design to a<br />
thinning experiment in Eucalyptus grandis,<br />
with intermediate results<br />
Data collection in tropical forests<br />
Bruce, D.<br />
iii<br />
iv<br />
Christie, J .M. , and<br />
Edwards, P.N. 4<br />
Edwards, P.N. 10<br />
Ferguson, I.S. 15<br />
Ferguson, I.S. 25<br />
Gallagher, G.J., and<br />
Q'Brien, D. 46<br />
de Graaf, N.R. 56<br />
Howell, R.S., and<br />
Stickland, R.E. 61<br />
Lin, C.J. 62<br />
McEwen, A.D., and<br />
Goulding, C.J. 74<br />
Monserud, R.A. , and<br />
Ek, A.R. 83<br />
Rennolls, K., and<br />
Tee, v. 91<br />
Rondeux, J. 100<br />
Schneider, T.W., and<br />
Alder, D.<br />
Schonau, A.P.G.<br />
Singh, S.P.<br />
110<br />
120<br />
140
Growth and yield analysis <strong>of</strong> thinned<br />
uneven-aged spruce and fir stands<br />
in Maine<br />
Quantifying forest science with biomass.<br />
I-Site productivity<br />
Quantifying forest science with biomass.<br />
II-Conifer thinning studies<br />
- ii -<br />
Solomon, D.S., and<br />
Seegrist, D.W.<br />
Young, H.E., and<br />
Ribe, J.H.<br />
Young, H.E., and<br />
Ribe, J.H.<br />
149<br />
157<br />
166
- v -<br />
Gallagher, G. (Or) Research Branch, Forest and Wildlife Service EIRE<br />
Department <strong>of</strong> Fisheries and Forestry<br />
1/2 Sidmonton Place<br />
Bray, Co. Wicklow<br />
Goulding, C.J. (Dr) Forestry Research Institute NEW ZEALAND<br />
Rotorua<br />
de Graaf, N.R. (Dr) Forest Research Officer <strong>of</strong> <strong>University</strong> <strong>of</strong><br />
Wageningen, Netherlands<br />
Stationed at:<br />
CELOS (Centre for Agricultural Research in SURINAM<br />
Surinam)<br />
P.Q. Box 1914 Paramaribo<br />
Holte, A. Norwegian Forest Research Institute NORWAY<br />
Box 61, 1432 As-NLH<br />
Howell, R. Forestry Commission Research Station UK<br />
Alice Holt Lodge, Wrecclesham, Surrey<br />
Johann, K. (Or) A-1131 Wien AUSTRIA<br />
Forstliche Bundesversuchsanstalt<br />
Tirolergarten<br />
Kenk, G. (Dr) Forstliche Versuchs-und Forschungsanstalt GERMANY<br />
Baden-WUrttemberg, Abt. Waldwachstum<br />
Reichsgrafenstrasse 12 7800 Freiburg<br />
Lee, H.S. Forest Department MALAYSIA<br />
Kuching, Sarawak<br />
Liu, C.J. (Or) Department <strong>of</strong> Forestry (00731) USA<br />
<strong>University</strong> <strong>of</strong> Kentucky,<br />
Lexington, Kentucky 40546<br />
Masson, J.L. Silviculture & Management GHANA<br />
FAO/GHA/74/013<br />
P.O. Box 209, Takoradi<br />
Malleux, J. Forest Inventory Officer MOZAMBIQUE<br />
MOZ/16/007<br />
P.O. Box 4595, Maputo<br />
Meng, C. (Dr) Department <strong>of</strong> Forest Engineering CANADA<br />
<strong>University</strong> <strong>of</strong> New Brunswick<br />
Fredericton, N.B.<br />
Miller, H.G. (Or) Department <strong>of</strong> Peat and Forest Soils OK<br />
Macaulay Institute for Soil Research<br />
Craigiebuckler, Aberdeen<br />
Mitchell, C.P. (Dr) Forestry Department UK<br />
Aberdeen <strong>University</strong><br />
St. Machar Drive, Aberdeen<br />
Monserud, R.A. (Or) USDA Forest Service USA<br />
Intermountain Forest and Range Experiment<br />
Station<br />
1221 S. Hain St.<br />
Moscow, Idaho, 83843
Sutter, H.<br />
Thallon, K.P.<br />
Tint, Kyaw (Or)<br />
Turnbull, K. (Or)<br />
Wright, H.L.<br />
- vii -<br />
National Forest Survey and Inventory<br />
BUX!79!O 11<br />
UNDP, Rangoon<br />
Forestry Commission Research Station<br />
Alice Holt Lodge<br />
Wrecclesham, Farnham, Surrey<br />
Dept. <strong>of</strong> Forestry<br />
Arts and Science <strong>University</strong>, Rangoon<br />
College <strong>of</strong> Forest Resources<br />
<strong>University</strong> <strong>of</strong> Washington<br />
Seattle, Wash. 98195<br />
Commonwealth Forestry Institute, .<br />
South Parks Road, <strong>Oxford</strong><br />
BURMA<br />
OK<br />
BURMA<br />
USA<br />
OK
- 3 -<br />
To avoid bias in volume estimates in inventories, it is necessary to<br />
use the same definition <strong>of</strong> ground level in the volume table sample as in<br />
the inventory. I know <strong>of</strong> instances where this has not been done.<br />
There are many arguments favoring either <strong>of</strong> my two main definitions-<br />
(1) average ground level or (2) ground level on uphill side <strong>of</strong> tree. I<br />
favor the second because more foresters measure trees in inventories <strong>of</strong><br />
some kind than in growth studies. Furthermore, growth studies are made by<br />
scientists who should deal easily with changing levels <strong>of</strong> basal area<br />
determination. Finally, most trees can be measured 1.3 m above the ground<br />
level on uphill side <strong>of</strong> trees, while some cannot be measured 1.3 m above<br />
average ground level.<br />
Standardization <strong>of</strong> the definition <strong>of</strong> d.b.h. is good but is not complete<br />
until a standard definition <strong>of</strong> ground level has been accepted.
- 9 -<br />
Fries, J. 1967. Variation in Forest Stands as a basis for the Planning<br />
<strong>of</strong> Experiments. Paper to Section 25 IUFRO Congress 1967 Munich.<br />
Hamilton, G. J. 1976. Pennanent Sample Plots in Britain. Paper to<br />
IUFnO 54.01 meeting Warsaw in Permanent plots in forestry growth and<br />
yield research. Department <strong>of</strong> Forest Yield Research No 43 1976.<br />
11 September 1979
*The Wolf in Sheep's Clothing<br />
- 11 -<br />
The availability <strong>of</strong> computers enabled the forester to send<br />
his collected measurements away without doing any calculations.<br />
He then had much more time available for measuring the<br />
experiments, and all the time-consuming calculations were done<br />
by the computer. The procedure is now: the forester measures<br />
the trees; writes the measurements on paper; sends the paper<br />
to the computer centre; the data is copied into the computer<br />
by punch-operators; the computer prints out the results; these<br />
are returned to the forester for checking. This procedure is<br />
widely used, but it has 2 obvious problems.<br />
Errors may be introduced to the data while it is being<br />
copied to the computer. Secondly, the delays caused by the<br />
postal service, and pressure <strong>of</strong> work on the punch-operators,<br />
may mean that the forester receives the results so long after<br />
he measured the experiments that he is no longer in the area,<br />
he has forgotten all about the data, and therefore cannot<br />
check the data.<br />
*If you go down to the woods today, you're sure <strong>of</strong> a big<br />
surprise.<br />
Portable data terminals eliminate the first problem and<br />
reduce the second. A portable data terminal is a box which has<br />
a keyboard and a display similar to a calculator, but which<br />
also contains permanent solid state memory, usually 8K bytes or<br />
more. It has some intelligence, and a battery. Sorne models are<br />
available with casette tape memory in place <strong>of</strong> the solid state<br />
memory, but these are not suitable for forest use for obvious<br />
reasons. To send the data to the computer centre, the portable<br />
data terminal is connected to an acoustic coupler, and the data<br />
can be sent via a Post Office telephone to the modem at the<br />
computer centre.<br />
With a portable data terminal, the forester now uses the<br />
following procedure:he measures the trees; enters the data into<br />
the portable data terminal; sends the data via the Post Office<br />
telephone to the computer; the computer calculates the results;<br />
and the results are posted back to the forester. The possible<br />
errors introduced by copypunching have been eliminated, as have<br />
possible delays <strong>of</strong> getting the data into the computer. And half<br />
the postal delays have been eliminated as well! The forester<br />
can expect his results back within 3 days.
- 16 -<br />
Sophisticated analytical aids such as forest simulation and linear programming<br />
models are widely used in these plantations (Research Working Group<br />
No. 2, 1978; Elliott 1978). Various growth functions are incorporated in<br />
these models. However, because <strong>of</strong> the rapidity <strong>of</strong> changes in silvicultural<br />
and other practices, difficulty has been experienced in trying to ensure that<br />
these growth functions adequately reflect the impact <strong>of</strong> new practices, as well<br />
as old.<br />
The aim <strong>of</strong> this paper is therefore to review past practices in the collection<br />
<strong>of</strong> growth data and developments in the estimation <strong>of</strong> growth functions, and<br />
to examine the problems and advance possible solutions for future data collection<br />
and estimation <strong>of</strong> growth functions.<br />
GROWTH FUNCTIONS: AREAS PLANTED PRIOR TO 1970<br />
Prior to 1970, the progressive changes in establishment and thinning<br />
practices which had occurred in Australia and New Zealand had had comparatively<br />
little impact on the pattern or magnitude <strong>of</strong> growth on a given site. Admittedly,<br />
1970 is not a rigid dividing line for all plantations, radical changes having<br />
been initiated somewhat earlier in some plantations, and later in others.<br />
Existing data<br />
In aggregate, the areas planted prior to 1970 constitute a relatively<br />
homogeneous type for the purposes <strong>of</strong> sampling growth and estimating growth<br />
functions for a particular plantation. Many organisations have already developed<br />
growth functions which are deemed appropriate for these areas. If not,<br />
data from permanent inventory or other sample plots are generally available to<br />
estimate them. While these data frequently span a wide range <strong>of</strong> ages, the<br />
coverage with respect to site, stocking, and severity and timing <strong>of</strong> thinning may<br />
be less than ideal. The accuracy <strong>of</strong> some <strong>of</strong> the measurements also leaves a<br />
lot to be desired, especially in the case <strong>of</strong> top height (McEwen 1978; Ferguson<br />
1979). Nevertheless, initiation <strong>of</strong> new systems <strong>of</strong> data collection for these<br />
areas iSiunlikely to be warranted, unless to fill major gaps in coverage. In<br />
many cases, the major problem is how best to reduce the burden <strong>of</strong> continuing<br />
measurement, especially where permanent inventory systems I,ave been established.<br />
Cooperation and data pooling<br />
Some scope exists for cooperation between organisations in pooling data<br />
and thus improving coverage and sample size. Unfortunately, previous attempts<br />
at interchange or pooling <strong>of</strong> Monterey pine data in Australia have foundered<br />
because <strong>of</strong> concern to protect commercial interests, rivalries between the<br />
technical staff <strong>of</strong> different organisations, and the ability <strong>of</strong> some organisations<br />
to rely on growth functions prepared by others. To be fair, however, there are<br />
also limitations to the ability to pool data usefully. Differences in data<br />
definition or measurement techniques create problems. Substantial differences<br />
in growth are also believed to exist between different regions. Moreover, a<br />
diversity <strong>of</strong> approaches to the formulation and estimation <strong>of</strong> growth functions,<br />
and the construction <strong>of</strong> simulation models, also has its advantages at this early<br />
stage <strong>of</strong> development.
- 21 -<br />
Other examples <strong>of</strong> greater variability in field practice may also be cited in<br />
relation to initial spacing, initial survival, and spacing in thinning operations.<br />
The expected value <strong>of</strong> the dependent variable in the growth function should<br />
reflect this inevitable variability found in field practice.<br />
Temporal differences between silvicultural experiments and routine practice<br />
are also potentially important, although they have received little recognition<br />
to date. In research reported elsewhere (Ferguson 1979) the effect <strong>of</strong> climatic<br />
conditions on annual increment in gross basal area was quite marked in plantations<br />
<strong>of</strong> Monterey pine in the Australian Capital Territory. Thus an experiment<br />
established under favourable climatic conditions may well yield very different<br />
results in relation to fertilizing to one which suffered a sequence <strong>of</strong> drought<br />
years.<br />
The potential effects <strong>of</strong> interactions between the effects <strong>of</strong> standards <strong>of</strong><br />
work, space and time are obviously considerable and would inevitably arise in<br />
field practice.<br />
Davidson and Martin (1967) carried out research into the magnitude <strong>of</strong> the<br />
differences between experimental and farm yields in agriculture. Farm yields<br />
ranged from 57 to 72% <strong>of</strong> experimental yields in wheat farming, which involves<br />
relatively large areas in Australia. Experience in Australia and New Zealand<br />
suggests that similar values occur in plantation forestry, but no systematic<br />
study <strong>of</strong> the problem has been made.<br />
Clearly, in the light <strong>of</strong> these problems, data collected from experiments<br />
alone cannot be expected to provide a satisfactory answer for extending growth<br />
functions. Initially, such data will have to be used, because no other sources<br />
exist, and subjective adjustment factors will have to be applied to the resulting<br />
estimates <strong>of</strong> growth. In the longer run, however, data will have to be obtained<br />
which reflect field results. Experimental data must therefore be seen principally<br />
as a bridging device for planning until the field data are available.<br />
Bayesian estimation<br />
The future <strong>of</strong> proposals to sample growth occurring in field practice would<br />
have limited appeal if one had to wait for 20 years or more to accumulate<br />
sufficient data to attempt the estimation <strong>of</strong> the new growth function. Fortunately<br />
the use <strong>of</strong> Bayesian estimation <strong>of</strong>fers a means <strong>of</strong> overcoming this problem. In<br />
particular, it enables estimation to proceed sequentia11y, progressively improving<br />
the growth function as additional data become available. While neither <strong>of</strong><br />
the examples <strong>of</strong> Bayesian estimation available to date (Leech 1978, Fergu50n 1979)<br />
bear directly on the type <strong>of</strong> problem under discussion, Leech's work provides a<br />
useful analogy.<br />
Leech studied the effect <strong>of</strong> thinning on yield for Monterey pine plantations<br />
located in South Australia. The data included both thinned and unthinned plots,<br />
with an average <strong>of</strong> about 10 successive measurements in each plot. Given such<br />
a small number <strong>of</strong> observations in the first-stage, estimation <strong>of</strong> the parameters<br />
relating to the effects <strong>of</strong> thinning on yield was clearly impracticable in any<br />
direct way. However, the unthinned plots were used to estimate a function<br />
relating yield to age and site, using generalized least squares. This provided<br />
reasonably precise estimates <strong>of</strong> the parameters concerned. The paramet?r<br />
estimates and associated variance-covar;ance matrix were then used to derive<br />
the parameters <strong>of</strong> a prior probability function for use in the Bayesian estimation<br />
<strong>of</strong> the parameters, including additional thinning parameters, for each thinned<br />
plot. This sequential analysis worked well and enabled tests <strong>of</strong> the significance<br />
<strong>of</strong> the thinning parameters to be carried out. Without it, the analysis would<br />
have been impossible.
- 25 -<br />
IUFRO Subject Group S4.01, Mensuration, Growth and Yield,<br />
Meeting in <strong>Oxford</strong>, September 16 - 22, 1979<br />
GROWTH FUNCTIONS<br />
FOR<br />
RADIATA PINE PLANTATIONS<br />
lan S. Ferguson<br />
Department <strong>of</strong> Forestry<br />
Austral ian National <strong>University</strong><br />
Canberra, Austral ia<br />
SUMMARY<br />
Gross basal area increment functions were estimated by general ized least<br />
squares from annual data derived from 85 permanent plots. The preferred<br />
functions incorporated thinning and cl imatic variables, as wel I as age,<br />
site index, and forest.<br />
Noisy data prevented the same detai I being incorporated in height<br />
functions, but an anamorphic function relating to top height to age and site<br />
index was estimated using general ized least squares.<br />
Both functions seem satisfactory in their properties. Tests using<br />
independent data from Kowen Forest indicated that smal I biases may exist,<br />
although the direction <strong>of</strong> these biases alternated over time.<br />
(Keywords: growth functions, general ized least squares, radiata pine,<br />
thinning variables, cl imatic variables.)<br />
INTRODUCTION<br />
This paper reports the results <strong>of</strong> part <strong>of</strong> the research carried out under<br />
contract for the Forests Branch <strong>of</strong> the Austral ian Capital Territory (A.C.T.).<br />
The research contract involved the estimation <strong>of</strong> growth and related functions<br />
suitable for the development <strong>of</strong> a simulation model <strong>of</strong> forest growth and<br />
yield for A.C.T. plantations. This paper, however, deals only with the gross<br />
basal area and top height functions; other work relating to mortal ity and<br />
diameter distributions wi I I be reported elsewhere.<br />
GROSS BASAL AREA<br />
Gross basal area is defined as the sum <strong>of</strong> the basal area <strong>of</strong> living trees<br />
plus that <strong>of</strong> the accumulated\trees <strong>of</strong> which have died or were removed up to<br />
that point in time.
- 28 -<br />
Thinning was incorporated in Equation (2) in a purely mechanical way<br />
which avoided introducing further coefficients. The exponential term is<br />
essentially a discounting factor which takes account <strong>of</strong> the diminishing<br />
increment with age. The thinning variable (T) was defined as the proportion<br />
<strong>of</strong> standing basal area retained after thinning and was incorporated thus:<br />
' -p(CA/T)-A ) (4)<br />
8 = n exp 0<br />
Clearly, the effect <strong>of</strong> thinning wi I I only be felt in the year <strong>of</strong> thinning,<br />
under this formulation. No lagged effects could be examined because <strong>of</strong> the<br />
gaps in the annual series <strong>of</strong> measurements. The coefficient Aa in Equation (4)<br />
is the intercept on the horizontal axis and hence Equation (4) can be<br />
simplified to:<br />
f B = n* exp-pA/T<br />
Where n* = n exp pAo<br />
This reduces the number <strong>of</strong> coefficients to be estimated and is tenable<br />
provided A o can be estimated by other means, as is the case.<br />
Cl imatic variables examined included various forms <strong>of</strong> rainfal I defined<br />
as different periods <strong>of</strong> the year. However, prel iminary investigations<br />
suggested that annual rainfal I and seasonally effective rainfal I were worth<br />
pursuing further. Seasonally effective rainfal I is defined (Mi I lett 1944)<br />
as the rainfal lover the months August to December inclusive, plus that over<br />
the months March to May inclusive. Booth (pers. comm.) also provided an<br />
annual "growing index" for each <strong>of</strong> the four forests based on earl ier work by<br />
Fitzpatrick and Nix (1970). The index was calculated from mean weekly data<br />
on rainfal I and evaporation, appropriately weighted to reflect their impact<br />
on growth. Since the three variables developed here are mutually exclusive,<br />
the symbol R wi I I be used to denote anyone in terms <strong>of</strong> the form <strong>of</strong> the model.<br />
Whi le several variants were examined, the most satisfactory form was as<br />
follows:<br />
Equation (6) impl ies, <strong>of</strong> course, that both no and nl incorporate<br />
the value <strong>of</strong> n* in Equation CS).<br />
?irst-stage resuLts<br />
Using seasonally effective rainfal I as the cl imatic variable, comparisons<br />
were made between Equation (6) fitted with and without the thinning variable.<br />
For the permanent yield plots, inclusion resulted in a 4.7% reduction in the<br />
total residual sum <strong>of</strong> squares across at I 60 plots, and a reduction could be<br />
seen in the overwhelming majority <strong>of</strong> results for individual plots. However,<br />
two <strong>of</strong> the AFS plots showed substantial increases in the residual sums <strong>of</strong><br />
squares, reducing the difference to 2.2% over al I 85 plots. Although these<br />
reductions may seem smal I, the number <strong>of</strong> observations affected by thinning is<br />
only 10 to 15% <strong>of</strong> the total. Moreover the actual dates <strong>of</strong> thinning within<br />
the year were unknown in the case <strong>of</strong> the permanent yield plots whereas<br />
the model assumes the effect to be felt for the entire year in which thinning<br />
occurred. Thus, whi le the mpdel may not reflect the exact magnitude <strong>of</strong> the<br />
impact it does at least recognize an effect which all foresters know to occur.<br />
(5)<br />
(6)
TABLE 3.<br />
Coefficient<br />
bZ<br />
bS<br />
- 31 _.<br />
ESTIMATED VALUES OF COEFFICIENTS IN EQUATION 6 AND ASSOCIATED<br />
STANDARD ERRORS.<br />
Seasonally effective Growing index /<br />
rainfat t<br />
Estimated Standard Estimated Standard<br />
value error value error<br />
-1.416 .604 -1.815 .481<br />
.152 .025 .148 .020<br />
.00207 .00016 .136 .008<br />
.00259 .00017 .150 .008<br />
.00266 .00029 .167 .032<br />
.00322 .00023 .166 .011<br />
.0241 .0009 .0231 .0009<br />
Whi le it is obvious from Table 3 that not at I the coefficients b3 to b6<br />
are significantly different from one another, there are some significant<br />
differences and the pattern does seem to be sensible, as wi I I be apparent<br />
from later graphical analyses.<br />
The properties <strong>of</strong> these two models are virtually identical and it wi I I<br />
therefore be sufficient to illustrate those <strong>of</strong> the model using seasonally<br />
effective rainfal I. Figure I was prepared from the above results, holding<br />
rainfal I constant for Uriarra Forest, and examining four different levels <strong>of</strong><br />
site index in unthinned stands.<br />
The trends in Figure I are in accordance with expectations <strong>of</strong> growth<br />
behaviour. Figure 2 was prepared holding site index and rainfat I constant,<br />
and show the trends for the four forests in unthinned stands.<br />
The ordering <strong>of</strong> the four forests in Figure 2 may seem curious but<br />
nevertheless may be sensible, given that al I are based on the same level <strong>of</strong><br />
rainfall.<br />
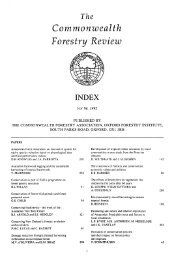
The relative impact <strong>of</strong> thinning on basal area increment is shown in<br />
Figure 3, for three different thinning intensities for a given forest and site<br />
index.<br />
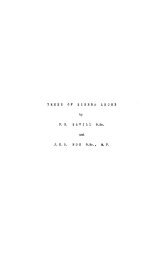
The trends in Figure 3 seem reasonable. Thinning at earl ier ages may<br />
tend to have less impact because there are proportionately more suppressed<br />
and dominated stems to be removed. Following first thinning at earl ier ages,<br />
later thinnings may have more impact because there are relatively fewer <strong>of</strong><br />
these stems in the stand. However, the severity <strong>of</strong> later thinnings tends<br />
to be less which may even the impact.
t-<br />
:z<br />
- 34 -<br />
FIGURE 3<br />
PROPORTION OF BASAL AREA INCREMENT AGAINST AGE<br />
FOR VARIOUS THINNING SEVERITIES<br />
W 0.8<br />
::E<br />
W er:<br />
(.)<br />
z<br />
1 .0 --------------- T • 1.0<br />
T • 0.8<br />
<<br />
w 0.6<br />
et:: T • 0.6<br />
<<br />
-J<br />
<<br />
(J)<br />
<<br />
CD<br />
u.. 0.4<br />
0<br />
z UR I ARRA "'FORES T<br />
0<br />
t- St TE INDEX 24.0<br />
0::<br />
0 0.2<br />
a..<br />
0 et::::<br />
a..<br />
. 4 10 15 20 25<br />
AGE (YEARS)<br />
:30 3S 40
- 36 -<br />
In al I cases, errors have been converted to an annual base to al low<br />
comparison across periods <strong>of</strong> measurement <strong>of</strong> differend lengths. No clear<br />
trends were apparent in relation to site class, in some periods biases<br />
being consistent in sign and magnitude across al I site classes, whi le erratic<br />
In others. Thus further discussion <strong>of</strong> the results may be confined to<br />
comparisons across al J plots. Results for the seasonally effective rainfal I<br />
model were essentially simi lar but the biases were larger although in the<br />
same direction.<br />
For periods <strong>of</strong> measurement 1958 to 1962 to 1971, the mean error proved<br />
to be significantly different from zero, based on 't' tests at the 95%<br />
probabi I ity level. However, the direction <strong>of</strong> the bias changed from one<br />
period to the next. In the 1958 to 1962 the magnitude <strong>of</strong> the bias is not<br />
large relative to average increment and could be ignored for practical' purposes.<br />
However the bias in the period 1962 to 1971 is approximately 10% <strong>of</strong> average<br />
annual increment.<br />
The plots used in the tests are evenly distributed over a wide range <strong>of</strong><br />
ages at first measurement. The switching <strong>of</strong> the direction <strong>of</strong> bias is<br />
therefore puzzl ing. Local foresters have suggested that the bias in the<br />
final period may reflect the effects <strong>of</strong> a disorder cal led dieback which is<br />
drought-induced and which was prevalent in Kowen Forest at the time.<br />
Further investigations along the same I ines are underway using the<br />
growing index model as a predictor. Attempts are also being made to obtain<br />
further independent test data.<br />
The Intercept (Aa)<br />
Only 13 <strong>of</strong> the 85 plots had been measured prior to an age <strong>of</strong> 8 years.<br />
The remainder therefore couid not be used to estimate the intercept Aa, the<br />
age at which a positive basal area first occurs. AI I 13 plots had a nominal<br />
initial spacing <strong>of</strong> 3.66 by 3.66 m (12 by 12 ft) but the values <strong>of</strong> site<br />
index ranged from 22 to 27 m.<br />
Graphs <strong>of</strong> gross basal area gainst age were prepared for each <strong>of</strong> these plots.<br />
A curve was fitted by eye and extrapolated to the horizontal axis, enabl ing<br />
the intercept to be read <strong>of</strong>f. Nine <strong>of</strong> the plots had intercepts <strong>of</strong> 3 years;<br />
the remainder 4 years. There was some tendency for this age to increase<br />
with decreasing site index.<br />
Both initial stocking and site index seem I ikely to affect the value <strong>of</strong><br />
this intercept but further data wi I I have to be collected to provide precise<br />
estimates.<br />
In the meantime, the fol Jowing estimates were based on the above results<br />
and inferences drawn from spacing trials in the A.C.T. (Cromer 1961):<br />
These estimates in Table 5 are Iittle better than educated guesses<br />
but shoutd suffice unti I better data can be obtained.
- 38 -<br />
Because top height was measured less frequently than diameter, some<br />
20 <strong>of</strong> the plots had 13 to 17 measurements, 26 had 18 to 21 measurements, and<br />
14 had more than 21 measurements. Some 10 plots had values <strong>of</strong> site index<br />
in the range 16 to 19 m, a further 31 fel I in the range 20 to 23 m, and 19 in<br />
the range 24 to 27 m.<br />
First-Stage Estimation<br />
As in the case <strong>of</strong> basal area functions, two-stage analyses <strong>of</strong> the top<br />
height functions were carried out; the first stage involving the estimation<br />
<strong>of</strong> the coefficients for each plot separately.<br />
Fipst-stage models<br />
Several alternative first-stage models were examined. Most were either<br />
unsuccessful or patently unsatisfactory and can be summarized briefly.<br />
A model based on Equation (3) was fitted using annual increment in top<br />
height as a proxy for the instantaneous increment. Rainfal I was also<br />
included as an independent variable. The results were entirely unsatisfactory,<br />
any effect <strong>of</strong> annual rainfal I being obscured by the errors <strong>of</strong> measurement in<br />
annual increment for top height. Indeed, the values <strong>of</strong> the other coefficients<br />
were also poorly determined and sometimes <strong>of</strong> the wrong sing.<br />
AI I other models examined were therefore based on the use <strong>of</strong> top height itself<br />
as the dependent variable and ignored rainfal I or other growing condition<br />
variables.<br />
Other models which proved unsatisfactory were the logarithm <strong>of</strong> height/<br />
reciprocal <strong>of</strong> age model, Korf's (1971) model, and the monomolecular model,<br />
either because they did not possess a.sigmoidal shape (eg. the monomolecular)<br />
or because the point <strong>of</strong> inflexion was inflexible.<br />
The von Bertalanffy (1941, 1942) model has a sigmoidal shape and is more<br />
flexible in relation to the point <strong>of</strong> inflexion. It was fitted to the data<br />
both in an unconstrained (Equation 7) and a constrained form (Equation 8), the<br />
constraint being that top height must equal the value <strong>of</strong> site index at age<br />
20 years: I<br />
H = [n/p{l_exp-p(l-m)A}]I-m (7)<br />
H =<br />
I<br />
S[I-exp-p(l-m)A ] I-m<br />
l_exp-p(l-m)20<br />
Where H denotos top height Cm).<br />
A denotes age (years).<br />
S denotes site index (m).<br />
And n, p, m denote coefficients.<br />
(8)
TABLE 7.<br />
- 43 .;.<br />
ERRORS OF PREDICTION BASED ON EQUATION 9 FOR THE<br />
PERIOD 1955 TO 1958<br />
Site Classes<br />
AI J<br />
50 60 70 80 t:'lots<br />
No. <strong>of</strong> plots 4 14 I1 6 35<br />
Mea,n error* .73 -.16 .32 -.06 • I I<br />
standard error .22 .32 .28 .36 .16<br />
*Observed minus predicted.<br />
As Table 7 shows, there was no obvious pattern in the sign or magnitude<br />
<strong>of</strong> mean errors by site classes, and the standard errors were such that these<br />
mean errors were not significantly different from zero based on ft' tests at<br />
the 95% probabi Iity level.<br />
Subsequent measurements <strong>of</strong> these plots were then used to carry out<br />
further tests, but on a somewhat different basis. Where more than one<br />
measurement exists for a plot, there are obvious advantages in making the<br />
prediction conditional on al I <strong>of</strong> those past measurements. The most<br />
appropriate way <strong>of</strong> accomplishing this is to form Bayes estimators <strong>of</strong> the<br />
coefficients, which are weighted averages <strong>of</strong> the estimates in Equation (9) and<br />
those estimates derived directly from the previous measurements themselves.<br />
Predictions from Sayes estimators are biased but have the property <strong>of</strong> a<br />
minimum average mean square error. The results for predictions derived from<br />
the Saves estimators are summarized in Table 8.<br />
The mean errors for each measurement period showed a consistent bias<br />
across al I site classes but the direction <strong>of</strong> the bias again changed from one<br />
measurement period to the next. The direction <strong>of</strong> the biases in these two<br />
periods agree with those for basal area. The use <strong>of</strong> Equation (9) on Its own,<br />
rather than Saves estimators, is unlikely to change the general thrust <strong>of</strong><br />
these results.
LITERATURE CITED<br />
Bard, Y., 1967. Non-linear parameter estimation and programming. IBM<br />
Contributed Program Library No. 3600, 13.6.003, IBM, N.Y. 154pp.<br />
BertaJanffy, L. von, 1941. Untersuchungen uber die Gasetzl ich bait des<br />
Wachstums. VI I St<strong>of</strong>fwechseltypen and Wachstumstypen. Bioi. Zbl.<br />
61:510-532.<br />
Bertalanffy, L. von, 1942. Theoretische 8iologie.<br />
Wachstum. Gebruder Borntraeger, Berl in, 362pp.<br />
Carron, L. T., 1967.<br />
radiata pine.<br />
I 1 St<strong>of</strong>fwechseI,<br />
A variable-density yield table <strong>of</strong> a plantation <strong>of</strong><br />
Aust. For. 31 (I): 10-18.<br />
Cromer, O.A.N., 1961. New approaches to forest mensuration.<br />
and Timber Bureau, 'Canberra, 9lpp.<br />
Forestry<br />
Cromer, O.A.N., and L.T. Carron, 1957. The volume I ine with reference to<br />
P. padiata - its derivation without the use <strong>of</strong> sample trees. Forestry<br />
and Timber Bureau, Leaflet No. 76, Commonwealth Govt. Printer, Canberra,<br />
16pp.<br />
Fearn, T. 1975. A Bayesian approach to growth curves.<br />
62(1): 89-100.<br />
BIOMETRIKA<br />
Ferguson, I.S. and J.W. Leech, 1978. General ized least squares estimation<br />
<strong>of</strong> yield functions. For. Sci. 24(1): 27-42.<br />
Fitzpatrick, E.A. and H.A. Nix, 1970. The cl imatic factor in Austral ian<br />
grassland ecology. Chapter I in Moore R.M. (Ed.) Australian Grasslands,<br />
ANU Press, Canberra.<br />
Korf, V., 1971. Odvozeinlcelkove hmotove produkce lesnick porost8.<br />
(Deriving the total volume production <strong>of</strong> forest stands). LESNICTVI<br />
1971: 903-922.<br />
Leech, J.W., 1978.<br />
A.N.U.<br />
Radiata Pine Yields Models. Unpublished Ph.D. thesis,<br />
Mi les, J .A., Ferguson, 1.5., and J .W. Leech, 1978.<br />
least squares for two-stage model development.<br />
27-42.<br />
Program GLS - generalized<br />
For. Sc i. 24 ( I ) :<br />
Mi Ilett, M.R.O., 1944. Rainfal I and increment <strong>of</strong> Monterey pine in the<br />
Australian Capital Territory. Commonwealth Forestry Bureau, Leaflet<br />
No. 56, Commonwealth Govt. Printer, Canberra, 26pp.<br />
Mitscherlich, E.A., 1910. Das Gesetz des minimuns und das Gesetz des<br />
abnehmenden Bodenertrages. LANDWIRTSCH. 38: 537-552.<br />
Swamy, P.A.V.B., 1971. Statistical Inference in Random Coefficient<br />
Regression Models. Lecture Notes - Operational Research and<br />
Mathematical Systems. No. 55, Ed. - by M. Beckmann, Sprlnger-Verlag,<br />
209pp.
- 49 -<br />
Table 2. Pole stage experiments in Sitka spruce and<br />
lodgepole pine (coastal).<br />
Species Variable No. Pres.Age Treatment Rep.<br />
age Term<br />
LP+ Spacing at 2 20-22 ·4-7 4 Randomised<br />
planting block<br />
LP " 3 15-16 5 4 "<br />
LP " 1 9 4 4 " with<br />
S.spruce<br />
SS+ " 1 20 8 4 Randomised<br />
block<br />
SS " 3 15-16 5 4 " "<br />
SS " 1 9 4 4 " with LP<br />
SS " 1 14 13 2 Nelder grid<br />
SS " 1 20 8 4 LP cut out<br />
LP Respacing 2 9-10 5 4 Randomised<br />
at 3 m block<br />
SS " 2 10-12 5 4 "<br />
LP Respacing<br />
at 8 m<br />
3*** 14-28 8 2-3 Randomised<br />
CCT<br />
LP Thinning<br />
in·tensity<br />
2* 24-27 4 2 Randornised<br />
block<br />
** " 2 27-38 3-5 2-3 " "<br />
SS Thinning type 2 27-31 2-6 2 " "<br />
n<br />
" 1 27 8 3 IUFRO series<br />
SS Thinning/ 2 23-28 3x3 3 Randornised<br />
fertilisation block<br />
factorial<br />
SS Fertilisation 30** 40-54 15 Composite<br />
rotatable<br />
LP " 4* 16-26 15<br />
* experiment written <strong>of</strong>f. + LP lodgepole pine (coastal)<br />
SS Sitka spruce
- 62 -<br />
STEM PROFILE ANALYSIS<br />
C. J. Liu<br />
Department <strong>of</strong> Forestry<br />
<strong>University</strong> <strong>of</strong> Kentucky<br />
Lexington, Kentucky 40546<br />
U. S. A.<br />
INTRODUCTION<br />
This paper describes an application <strong>of</strong> spline techniques<br />
for constructing stem pr<strong>of</strong>ile, developing spline functions for<br />
the analysis <strong>of</strong> tree growth, and examining growth patterns and<br />
their relation to environmental conditions. A stem pr<strong>of</strong>ile is a<br />
sequential set <strong>of</strong> taper curves. It provides a mathematical model<br />
for studying both the secular and the dimensional developments <strong>of</strong><br />
a tree. When presented graphically, a stem pr<strong>of</strong>ile depicts a<br />
tree's dimensional changes over time. Results <strong>of</strong> this study<br />
reveal that there is a strong relationship between local weather<br />
conditions and tree growth. It is important, therefore, to consider<br />
effects <strong>of</strong> environmental factors in growth modeling.<br />
METHOD AND PROCEDURES<br />
Spline approximation is an interpolation by a class <strong>of</strong> coordinates<br />
functions which may be described as sets <strong>of</strong> cubic polynomial<br />
segments with smooth joins. Instead <strong>of</strong> approximating a<br />
given function f(x) over an interval [atb] by a single polynomial,<br />
the interval [a,b] may be divided into n subintervals<br />
[a,xl],[xl,x2], ••• ,[xn_l,b] and, then, f(x) may be approximated<br />
by a different polynomial on each subinterval. To determine the<br />
approximating function, g(x), it is required that: (1) in each<br />
subinterval the approximation function g(x) be a polynomial <strong>of</strong><br />
maximum degree 3; (2) g(x) agree with f(x) at each <strong>of</strong> the n<br />
points, xO·a,xl, ••• ,xn_l,xn-b; and (3) the first derivative
- 66 -<br />
Error Introduced By Extrapolation<br />
It is apparent that the use <strong>of</strong> spline extrapolation has<br />
introduced a numerical error in estimated tree heights (Fig. 5).<br />
However, errors in volume estimation thus induced are believed to<br />
be negligible. While the history <strong>of</strong> the subject tree's height<br />
growth remains unknown, there is no practical method to evaluate<br />
the magnitude <strong>of</strong> this error except for the set <strong>of</strong> outermost<br />
rings. The extrapolated height, using the outermost rings, can<br />
be compared with the measured total tree height. For eight sample<br />
trees studied, every extrapolated height was less than the<br />
measured tree height but never exceeded 3% <strong>of</strong> error. The magnitude<br />
<strong>of</strong> this error depends upon- (1) the ratio <strong>of</strong> stem height to<br />
stem radius <strong>of</strong> the uppermost disc, and (2) the position and the<br />
width <strong>of</strong> the ring by which the taper curve passes. Above all,<br />
this extrapolation error can be minimized by maximizing the number<br />
<strong>of</strong> sample discs.<br />
CONCLUSION<br />
Spline techniques are useful numerical procedures. This<br />
investigation has employed spline techniques for construction and<br />
analysis <strong>of</strong> a stem pr<strong>of</strong>ile, a sequential set <strong>of</strong> taper curves.<br />
This set <strong>of</strong> taper curves represents a mathematical model <strong>of</strong> a<br />
tree's secular development. By examining a stem pr<strong>of</strong>ile, foresters<br />
can gain insights about growth trends and environmental<br />
impacts on an individual tree. The use <strong>of</strong> spline extrapolation<br />
tends to introduce some error, <strong>of</strong> varying magnitude, in height<br />
estimations. This error can be minimized by maximizing the number<br />
<strong>of</strong> sample discs. In this study, sufficient evidence supports<br />
the assumption that tree growth is strongly affected by fluctuations<br />
<strong>of</strong> cltmatological factors. It is suggested that effects <strong>of</strong><br />
environmental factors upon tree growth should be included in forest<br />
modeling work;<br />
LITERATURE CITED<br />
Ahlberg, J. H., E. N. Nilson and J. L. Walsh. 1967. The theory<br />
<strong>of</strong> splines and their applications. Academic Press, New<br />
York. 284p.<br />
de Boor, C. 1978.<br />
log, New York.<br />
A practical guide to splines.<br />
392p.<br />
Springer-Ver-<br />
Liu, C. J. 1979. On single tree height increment with spline<br />
approximation. (read at IUFRO S4.01-02 and S4.02-03 meeting,<br />
Vienna, Austria, Septemter 10-14, 1979).
Figure 5 • The<br />
tree.<br />
- 71 -<br />
stem pr<strong>of</strong>iIe<br />
<strong>of</strong> t he subject<br />
16. 50
- 76 -<br />
Data Stored in the Computer System<br />
The information which can currently be stored in the system in<br />
each plot is described below, though not all plots contain all the<br />
items despribed. The system is designed so that new items could be<br />
incorporated at a later date.<br />
The index file holds general plot details.<br />
(a) Sample plot identification and location - plot number, forest<br />
code, compartment number, latitude, longitude, altitude and a<br />
local forest grid reference number.<br />
(b) Details <strong>of</strong> the crop - species, establishment year, row and tree<br />
spacing, site index, and codes for treatment, ownership and plot<br />
status.<br />
(c) Measurement details - number, last measurement age, and a volume<br />
equation identification.<br />
The measurement file <strong>of</strong> the plot holds the basic data.<br />
(a) General details - month and year <strong>of</strong> each measurement, plot area,<br />
height <strong>of</strong> pruning, and a general connnent.<br />
(b) Individually identified trees - tree identification, distance<br />
and bearing from a reference point. Data referring to a particular<br />
measurement - diameter at breast height, total height, height to<br />
base <strong>of</strong> green crown, and codes for height purpose, crown class,<br />
stem quality, defect description and tree category (dead, felled,<br />
windblown or residual tree).<br />
(c) Diameter class distribution data. Instead <strong>of</strong> numbering each tree,<br />
the number <strong>of</strong> trees at each measurement within each diameter class<br />
can b e recorded for all trees or for a segment <strong>of</strong> the crop (e.g.<br />
thinned trees), in which case the remainder <strong>of</strong> the trees would be<br />
individually numbered. Each category is recorded separately.<br />
(d) Height data for 'unnumbered trees - diameter at breast height, total<br />
height, height to base <strong>of</strong> green crown, and height purpose code.<br />
Supplementary Information<br />
A "plot history sheet" contains environmental information and details<br />
concerning the history and treatment <strong>of</strong> the plots. The sheet defines the<br />
objectives <strong>of</strong> the experiment, the prescr,ibed treatment <strong>of</strong> the plot, and<br />
cross-references any related plots. Environmental information is presented<br />
on site, climate, geology and soils in a, descriptive manner, with room for<br />
general remarks and warnings. The plot history describes the establishment<br />
<strong>of</strong> the crop in detail, and every subsequent silvicultural operation.<br />
This information is especially important for centralised research workers<br />
who have no access to the actual plots and who therefore have no information<br />
which could explain apparently anomalous results. Efforts are being made to<br />
complete a sheet for every plot, and at the present .time these are not stored on<br />
the computer. When an analysis is carried out, a preliminary selection <strong>of</strong><br />
plots can be made on the computer on the basis <strong>of</strong> plot location, species,<br />
stocking, etc. A thorough screening <strong>of</strong> the selected plots can then be<br />
carried out by referring to the plot history sheets.
COL: 1 2 3 4 5 6 7 8 9 10 11 12 13 14<br />
Optimal Sample Sizes<br />
Optimum<br />
Sample Sizes<br />
Actual Sample<br />
Sizes<br />
Tariff<br />
Estimate<br />
Tariff<br />
c. <strong>of</strong> V.<br />
Estimate<br />
from (17)<br />
C .<strong>of</strong> V.<br />
A<br />
<strong>of</strong> V (C)<br />
(same precision) (5\ precision)<br />
CV/C<br />
G = 30 Cv/C = 60 (CV/C = 30)<br />
G G<br />
A A<br />
(m..i)<br />
Species N n +n n V, (T) (m<br />
J ) (\ )<br />
V (C) n +n n n +n n n +n n<br />
v 9 v v 9 v v 9 v v 9 v<br />
Scots Pine 419 209 20 142.9 3.22 146.1 2.94 208 20 246 19 69 8<br />
E. Larch 416 208 20 96.8 5.02 98.4 4.17 207 20 286 18 168 14<br />
" 696 204 19 87.6 6.17 103.5 5.56 165 20 203 19 212 24 \0<br />
0'<br />
Norway Spruce 4750 240 21 549.2 5.11 588.2 4.60 326 16 407 14 265 14<br />
It It 4080 272 27 714.8 4.90 735.4 4.44 350 23 432 21 286 18<br />
.. If<br />
808 202 20 160.9 4.07 160.2 3.82 244 18 331 16 148 11<br />
If 4440 222 22 762.3 4.84 788.6 4.37 266 19 383 17 206 15<br />
438 206 22 70.1 3.10 76.6 2.97 296 14 374 12- 131 6<br />
Table 1. Summary <strong>of</strong> results for a number <strong>of</strong> stands from Rockingham Forest.
- 106 -<br />
The selection index is (23.3 - 21.3) / 5.50 = 0.37, which<br />
corresponds to a percentage <strong>of</strong> 78.5 in the normal distribution<br />
so that the theoretical number <strong>of</strong> trees is 875 (= 1115 x 0.785).<br />
639 stems (875 - 236) <strong>of</strong> d 23.7 cm are left after the proposed<br />
removal. There is no problem to thin up to the 236 stems <strong>of</strong><br />
d 21.3 cm. On the other hand the thinning relative to the following<br />
period cannot be realized according to the main stand, the<br />
remaining number <strong>of</strong> sterns being insufficient (TEST = - 36).
Table 1<br />
Stand constraints :<br />
Results<br />
NB.BOIS/HA<br />
SURF TER<br />
AGE INI.T<br />
AGE FIN.<br />
AGE =<br />
HDOM =<br />
N/HA =<br />
DMOY =<br />
DI00 =<br />
D200 =<br />
DECL =<br />
G.AV =<br />
G.AP =<br />
GECL =<br />
NECL =<br />
TEST =<br />
- 107 -<br />
Abbreviations used in figure 1<br />
HAUT DOM = top height (m x 10)<br />
ANNEE PLANT. = planting age<br />
AGE = stand age<br />
DIAM INIT = initial mean diameter (mm) corresponding to<br />
Silvicultural constraints :<br />
the mean basal area <strong>of</strong> the stand<br />
= number <strong>of</strong> sterns per hectare<br />
= basal area per hectare (rn 2 )<br />
= age at the beginning <strong>of</strong> simulation<br />
= rotation age<br />
CL.AGE = age classes (or thinning cycles)<br />
AC.DIA = annual fixed diameter increment or "apparent"<br />
increment (mm)<br />
PC.BIO = "biological" increment (percentage <strong>of</strong> the "apparent"<br />
increment)<br />
age in years<br />
top height (m x 10)<br />
number <strong>of</strong> stems per hectare<br />
diameter corresponding to the mean basal area (cm)<br />
diameter <strong>of</strong> the 100 largest trees per hectare (cm)<br />
diameter <strong>of</strong> the 200 largest trees per hectare (cm)<br />
mean diameter <strong>of</strong> removed trees (cm)<br />
basal area <strong>of</strong> the main crop per hectare before thinning<br />
(m 2 )<br />
basal area <strong>of</strong> the main crop per hectare after thinning<br />
(m 2 )<br />
basal area per hectare removed in thinning (m 2 )<br />
number <strong>of</strong> stems removed per hectare<br />
difference between calculated number <strong>of</strong> stems (from<br />
normal distribution) corresponding to DECL and number<br />
<strong>of</strong> stems to be removed NECL.
- 109 -<br />
REFERENCES<br />
Dagnelie, P.; Rondeux, J.; Thill, A., 1976: Tables dendrometriques.<br />
Presses Agronomiques de Gernbloux, 128 p.<br />
Delvaux, J., 1974: Contribution a l'etude de l'education des<br />
peuplements XIII. Tables pour les eclaircies numeriques.<br />
Sta. Rech. Eaux et Forets, Groenendaal-Hoeilaart.<br />
Travaux. Serie B, nO 38, 31 p. + 33 annexes.<br />
Gerard, P., 1975: Estimation en valeur des pessieres.<br />
Bull. Soc. R. For. Belg., 82(4), 189 - 207.<br />
Hiley, W.E., 1952: Numerical thinning: with special reference to<br />
Japanese larch. Forestry 25(1), 10 - 18.<br />
Nanson, A., 1967: Tables de la differentielle de selection dans<br />
la distribution normale (0,1). Biornetrie-Praxirnetrie, 8(1),<br />
40 - 51.<br />
Rondeux, J., 1974: Simulation de l'evolution de peuplernents<br />
forestiers dans le contexte dtune sylviculture intensive.<br />
In : Growth models for tree and stand simulation. Research<br />
note n° 30. Stockholm, Royal College <strong>of</strong> Forestry, 1973,<br />
379 p.<br />
Rondeux, J., 1977: Construction et utilisation de tarifs de<br />
cubage "peuplernents" pour l'epicea (Picea Abies Karst.) en<br />
Ardenne meridionale. Bull. Rech. Agron. Gernbloux, 12(4),<br />
339 - 348.<br />
Rondeux, J. et Delvaux, J., 1979: Tables de gestion et de recolte<br />
"a la carte". Un modele simple pour I'epicea comrnun en<br />
Ardennes beIges. Centre de Recherche et de Promotion Forestieres<br />
I.R.S.l.A. Fac. Sci. Agr. Gembloux (sous presse).<br />
Staebler, G.R., 1960: Theoretical derivation <strong>of</strong> numerical thinning<br />
schedules for douglas-fir. For. Sci. 6(2), 98 - 109.<br />
Thill, A. et Palm, R., 1976: Production de l'epicea commun dans<br />
le Sud-Ouest de l'Ardenne belge. Note technique nO 28.<br />
Gembloux, Centre d'Ecologie forestiere (I.R.S.I.A.), 42 p.
- 123 -<br />
The use <strong>of</strong> an established stand was preferred since it would reduce the<br />
total duration <strong>of</strong> the experiment by at least three years, and also any<br />
possible error in the initial selection <strong>of</strong> the site. An eminently suitable<br />
stand was available on Clan Syndicate in Compartment E.23 which had<br />
been planted in February, 1967 at such an accurate espacement that the<br />
error in one direction was not more than 15 cm in 450 m or 0,03 per cent.<br />
After rejecting for practical reasons such factors as rotation length<br />
and coppice management <strong>of</strong> the thinned trees, it was decided to use a factorial<br />
experiment with intensity <strong>of</strong> thinnings, age <strong>of</strong> commencement <strong>of</strong><br />
first thinning, interval between thinnings and final stocking as the four<br />
main factors. The tentative rotation length is set at 25 years and the<br />
stools <strong>of</strong> all thinned trees are killed by chemical means immediately after<br />
felling.<br />
The minimum size <strong>of</strong> plot required was another factor which had to be<br />
taken into account before the experimental design could be decided. In<br />
Wattle Research Institute growth studies <strong>of</strong> stands <strong>of</strong> trees, it has been<br />
found that a minimum <strong>of</strong> 10 trees per experimental plot are required to<br />
provide satisfactory results, as long as the stands are uniform, have a<br />
narrow range <strong>of</strong> diameters and allow for enough replications. This finding<br />
is confirmed by Nemeth (1973) for Pinus taeda and P.eZZiottii on the<br />
basis <strong>of</strong> a time-cost analysis, indicating that the most variable stand<br />
would require plots with nine trees only. Unless a mean breast height<br />
diameter (d b h) <strong>of</strong> over 50 cm is required at clearfelling, there is no<br />
point in reducing the stocking lower than about 150 trees per ha.<br />
According to Marsh and Burgers (1967) this stocking gives a mean d b h<br />
<strong>of</strong> between 35 and 45 cm depending on age and site quality. Considering<br />
this final stocking and a minimum <strong>of</strong> 10 trees in the experimental plot at<br />
clearfelling, about 90 trees are originally required per plot if the<br />
stand was planted at an espacement <strong>of</strong> 2,74 x 2,74 m or 1 329 trees per ha.<br />
This gives a plot size <strong>of</strong> 677 m 2 or 0,0677 ha. In an arrangement <strong>of</strong> 9<br />
rows <strong>of</strong> 10 trees at least 2 rows <strong>of</strong> surrounds are necessary and the gross<br />
plot will be 13 x 14 trees = 182 trees or 0,1370 ha. Plotting each tree<br />
in the chosen experimental area on a grid system indicated clearly that<br />
it was possible to layout 81 plots in the area <strong>of</strong> nearly 15 ha. The<br />
allocation <strong>of</strong> plots is illustrated in Figure 1 with the plot numbers shown<br />
in the top left-hand corner.<br />
The availability <strong>of</strong> 81 plots made varl0us designs feasible, but it<br />
was decided that a single replicate <strong>of</strong> a 3 factorial, confounded in randomized<br />
incomplete blocks <strong>of</strong> 9 units would be the most advantageous.<br />
In Figure 1 the block boundaries are indicated by the dotted lines.<br />
This design made possible the allocation <strong>of</strong> intensity <strong>of</strong> thinnings, commencement<br />
<strong>of</strong> thinnings, interval between thinnings and final stocking as<br />
main factors, each being represented at three levels. The sub-divisions<br />
<strong>of</strong> the four main treatments are summarized on Figure 1, and their allocation<br />
to the 81 plots ;s indicated by the numerical notation at the lower<br />
end <strong>of</strong> each plot. Initially, thinning intensities <strong>of</strong> 30, 40 and 50 per<br />
cent were suggested but rounding <strong>of</strong>f and the necessary adjustments to<br />
plot size made the relevant thinning percentages 32,0, 38,2 and 47,5 per<br />
cent throughout from the first to the last thinning operation at the medium<br />
final stocking. This resulted in five thinning operations for the<br />
light intensity thinning, four for the medium and three for the heavy<br />
thinning regime. Varying the starting age <strong>of</strong> the first thinning from<br />
four, five and six years and the intervals from two, three and four
- 126 -<br />
regression curve fitted <strong>of</strong> the heights on d b h separately for each block<br />
<strong>of</strong> 9 units. The results showed that very little difference existed between<br />
the curves for the 9 blocks. Objections against measuring only the<br />
heights <strong>of</strong> thinned trees could be made, but from the second thinnings and<br />
even in the first thinning <strong>of</strong> the highest intensity many dominant trees<br />
were removed. In the thinnings the obviously suppressed, genetically<br />
inferior trees and those with poor form or which were otherwise damaged<br />
were removed first. Thereafter the spatial distribution <strong>of</strong> the trees<br />
over the plot, heavy branching habit and stem crookedness were the main<br />
considerations in marking trees to be removed in thinnings. In the plots<br />
which were thinned at the high intensity, the latter considerations were<br />
the main thinning criteria from the second thinning onwards, but for those<br />
thinned at the lower intensities, these criteria were applicable mainly<br />
only from the third thinnings on.<br />
From the first enumeration, the measurements as well as the volume<br />
calculations were made in imperial measure. For trees up to 25 cm d b h,<br />
the volumes were calculated with the general volume regressions for E.grandis<br />
(Schonau, 1971) and for larger trees with tables adapted from the original<br />
South African alignment chart (Brent, 1956). The plot volumes are<br />
the totals for each half inch d b h class calculated from the regression<br />
heights and number <strong>of</strong> trees in the tallies. These calculations are made<br />
each year and are at this stage only partly computerized. The main reason<br />
for this non-computerization is lack <strong>of</strong> time and a satisfactory volume<br />
regression for the larger trees. To obtain more data for the latter,<br />
each year during the thinning at least 100 sample trees are measured according<br />
to the WR I procedure (Schonau, 1972). During the last few years<br />
these sample trees were all over 25 cm d b h.<br />
Up to 11 years <strong>of</strong> age a number <strong>of</strong> lightning storms struck and killed<br />
trees in at least seven instances. However, only one strike was so serious<br />
that permanent damage occurred and in one plot the surviving trees<br />
are rather confined to one side <strong>of</strong> the plot. Initial damage in the<br />
form <strong>of</strong> severe bending by strong dry adiabatic winds occurred during the<br />
first years, but no permanent damage ;s noticeable externally at present.<br />
RES UL T S<br />
No extensive report on the development from year to year will be given<br />
in this paper, only the overall trend <strong>of</strong> the intermediate results at six<br />
and ten years <strong>of</strong> age will be discussed together with an important finding<br />
which could be <strong>of</strong> great importance if proved to be generally applicable.<br />
The mean d b h <strong>of</strong> the experiment as a whole was 17,3 cm at six years and<br />
25,0 cm at ten years <strong>of</strong> age. At these ages the mean height was 21,6<br />
and 28,9 m and the mean annual increment (MAl) was 32,2 and 31,2 m 3 per<br />
ha per annum respectively. The average standing volume up to 5 cm tip<br />
under bark at ten years <strong>of</strong> age was 198,5m 3 per ha. The coefficients <strong>of</strong><br />
variation for these seven parameters were 2,18, 3,00, 0,95, 1,34, 5,80,<br />
4,82 and 6,37 per cent respectively, indicating that the variation was<br />
very small, increased slightly with age and that the experiment was very<br />
uniform. In contrast the variation in the volumes <strong>of</strong> the first thinnings<br />
were naturally much greater and the coefficient <strong>of</strong> variation was 13,65 per
- 131 -<br />
interpolation makes it possible to quantify thinnings, other yields and<br />
any stand parameter required for yield investigations.<br />
It is not considered that the design discussed is the ultimate solution,<br />
e.g. one <strong>of</strong> the main treatment factors could be dropped as superfluous<br />
or too complicated. A 3 3 factorial with one or two replications<br />
could then be used which would reduce the number <strong>of</strong> plots to 27 or 54.<br />
On the other hand it could be found necessary thgt thinning intensity<br />
should change with age, a third replicate <strong>of</strong> a 3 would then be a possibility.<br />
However, at this stage the finding that mean annual increment is not<br />
changed by thinning intensity, frequency or commencement <strong>of</strong> first thinning<br />
is the most important result <strong>of</strong> this experiment. If the universal acceptance<br />
<strong>of</strong> this principal for E.gpandis or any other eucalypt species can<br />
be proved, then only a few other experiments will be necessary for satisfactory<br />
thinning research under other site conditions. The fact that<br />
the MAl remains the same over a wide range should make it a most useful<br />
tool in the development <strong>of</strong> growth models. The great advantage <strong>of</strong> this<br />
over the C C T approach is that it is based on statistical evidence and<br />
not on various assumptions about basal area increment as made by some<br />
authors (Marsh, 1957; Burgers, 1971; Marsh and Burgers, 1973). Also,<br />
the possibility <strong>of</strong> regression analysis, response surfaces and interpolation<br />
make this replicated trial a very rich source <strong>of</strong> information. In<br />
conclusion, however, it should be noted that this is only a preliminary<br />
analysis <strong>of</strong> a few intermediate data and that much work lies ahead to utilize<br />
this experiment to its full advantage.<br />
ACKNOWLEDGEMENT'<br />
The encouragement by the Management <strong>of</strong> Hans Merensky Forestry Holdings<br />
(Pty) Ltd and the continuous support <strong>of</strong> past and present staff at<br />
Clan Syndicate (Pty) Ltd are gratefully acknowledged.<br />
Prepared May, 1979.
Experiment SE.6 : E: GRANDIS<br />
- 135 -<br />
Plots :<br />
Net = 9 rows <strong>of</strong> 10 trees = 90 trees<br />
planted 2,74 x 2,74 m = 0,0677 ha<br />
x 81 = 5,48 ha<br />
Gross = 13 rows <strong>of</strong><br />
182 trees<br />
x 81<br />
TREATr··1ErJTS<br />
"CLAN SYNDICATE"<br />
CRAf·10tlD<br />
A. Intensity <strong>of</strong><br />
Thinning<br />
O. 32 %<br />
1. 38,2 %<br />
2. 47,5 %<br />
B. Commencement<br />
O. 4 years<br />
1. 5 years<br />
2. 6 years<br />
C. Interval between Thinnings<br />
O. 2 years<br />
1. 3 years<br />
2. 4 years<br />
D. Final stocking<br />
O. 148 trees per ha<br />
1. 192 trees per ha<br />
2. 236 trees per ha<br />
=<br />
Block E23<br />
- - - - - Block boundary
- 136 <br />
TABLE 2<br />
Basic experimental thinning regimes indicated by number <strong>of</strong> trees per ha<br />
remaining at various ages<br />
Commencement<br />
<strong>of</strong> thinning<br />
4 years (80) 5 years (B1) 6 years (82)<br />
Interval<br />
between thinnings<br />
Age<br />
(yrs)<br />
2 yrs<br />
(Co)<br />
3 yrs<br />
(C1 )<br />
4 yrs<br />
(C2)<br />
2 yrs<br />
(CO)<br />
3 yrs<br />
(C1)<br />
4 yrs<br />
(C2)<br />
2 yrs<br />
(CO)<br />
3 yrs<br />
(C 1)<br />
4 yrs<br />
(C2)<br />
Thinning<br />
intensity<br />
32,0%<br />
(Aa)<br />
4<br />
5<br />
6<br />
7<br />
8<br />
9<br />
10<br />
11<br />
12<br />
13<br />
14<br />
15<br />
16<br />
17<br />
18<br />
19<br />
20<br />
21<br />
22<br />
901<br />
620<br />
413<br />
281<br />
final<br />
901<br />
620<br />
413<br />
281<br />
final<br />
901<br />
620<br />
413<br />
281<br />
final<br />
901<br />
620<br />
413<br />
281<br />
final<br />
901<br />
620<br />
413<br />
281<br />
final<br />
901<br />
620<br />
413<br />
281<br />
final<br />
901<br />
620<br />
413<br />
28<br />
final<br />
901<br />
620<br />
413<br />
281<br />
final<br />
901<br />
620<br />
413<br />
281<br />
final<br />
4 827 827 827<br />
5 827 827 827<br />
6 502 827 827 827<br />
7 502 502<br />
8 310 502 502 502<br />
9 310 502 502<br />
Thinning 10 final 310 310 502<br />
11 ... final 310<br />
inten- 12 310 final 310<br />
sity 13 final 310<br />
14 final 310<br />
38,2% 15 final<br />
16 final<br />
(A1 ) 17 final<br />
18 final<br />
Thi nning<br />
intensity<br />
47,5%<br />
(A2)<br />
4<br />
5<br />
6<br />
7<br />
8<br />
9<br />
10<br />
11<br />
12<br />
13<br />
14<br />
694<br />
369<br />
final<br />
694<br />
369<br />
final<br />
694<br />
369<br />
final<br />
694<br />
369<br />
final<br />
694<br />
369<br />
final<br />
694<br />
36,9<br />
final<br />
694<br />
369<br />
fi nal<br />
694<br />
369<br />
final<br />
694<br />
369<br />
final<br />
Final<br />
stocking DO : 148 trees/ha °1 : 192 trees/ha 02 :<br />
236 trees/ha
- 139 <br />
TABLE 7<br />
The effect <strong>of</strong> thinning intensity and time <strong>of</strong> the first thinning on<br />
the timber volume removed during this latter operation in m 3 per ha<br />
up to 5 cm tip diameter<br />
Thinning<br />
Commencement <strong>of</strong> thinning<br />
intensity Mean 4 yrs 5 yrs 6 yrs<br />
(80) (B1) (82)<br />
32% (A O ) 20,3 16,5 22,5 21,9<br />
38,2% (A 1 ) 29,0 24,6 28,6 33,8<br />
47,5% (A 2 ) 44,2 34,2 45,5 52,9<br />
Mean 25,1 32,2 36,2<br />
Statistical details for Standard Least significant<br />
interaction means error difference<br />
P=O,05 P=O,01<br />
1,419 4,07 5,46
- 152 -<br />
that there would be no difference in accretion for the second<br />
measurement period for these two treatments. However, the<br />
common mean for these two harvesting cycles is different from<br />
the mean for the 5-year harvesting cycle in the same period.<br />
All other treatment means are assumed to be different.<br />
The following notation is used in the statistical pro<br />
cedures. Let Y.. be the annual accretion in the k<br />
k th compart<br />
1J<br />
ment d urlng · t h e J.th measurement· per10d<br />
for the l·th treatment.<br />
The vector <strong>of</strong> average annual accretion for the k th compartment<br />
in the i th treatment is denoted by lik = (Yilk' Yi2k' Yi3k'<br />
Yi4k)' This applies to compartments with a complete set <strong>of</strong><br />
measurements. Let Zlk = (Y l1k ' Y12k' Y 13k ) for the two compartments<br />
in the 5-year cycle that were measured in periods 1,<br />
2, and 3 only.<br />
The statistical model .for the means is:<br />
for compartments in treatment 1<br />
with complete set <strong>of</strong> measurements<br />
(k = 1,2)<br />
for compartments in treatment 1<br />
measured in periods 1, 2, and 3<br />
only (k = 3,4)<br />
k = 1, •.• , 6<br />
k = 1,2,3.<br />
It is assumed that accretion measurements are dependent when<br />
measured on the same compartment and that they have a common covariance<br />
matrix. The vectors <strong>of</strong> measurements on different compartments<br />
are assumed to be independent, that is:<br />
E(Y'ik Yik') = r<br />
= 0<br />
if k = k'<br />
if k 1- k'
- 155 -<br />
RES U L T S<br />
Because there are statistical differences due to treatments,<br />
the maximum likelihood estimates <strong>of</strong> the treatment means in<br />
Table 2 are the statistics <strong>of</strong> interest. These estimates suggest<br />
that the accretion for the 5-year harvesting cycle may be different<br />
from the accretion <strong>of</strong> both the 10- and 20-year harvesting<br />
cycles. In the 5-year cycle, the four estimated accretion rates<br />
are more or less the same. The largest accretion rates are in<br />
the fourth period in the 10-year and the 20-year harvesting<br />
cycles. This increase may be due to the removal <strong>of</strong> balsam fir<br />
and the increase <strong>of</strong> hemlock, a faster growing species, into<br />
the merchantable growing stock.<br />
Although the treatments means are different statistically,<br />
the differences in mean accretion rates are small. The differences<br />
among the means <strong>of</strong> the four measurement periods may be<br />
due to differences in growing conditions within the Reriod.<br />
For management purposes, the overall mean <strong>of</strong> 2.42 ft /(acre.yr)<br />
<strong>of</strong> accretion could be used.<br />
Similar analysis can be performed on the mortality, ingrowth,<br />
and net growth. However, the means in Table 1 suggest<br />
little or no difference among the other growth components in<br />
the three harvesting cycles. There are too few measurements<br />
at the present time .to show distinct trends in the data.<br />
The small differences in the accretion rates may be due to<br />
the fact that the compartments in the three treatments had<br />
about the same basal area before the first thinning and were<br />
thinned to similar residual basal area. Also, the purpose <strong>of</strong><br />
thinning was not to maximize growth. The purpose was to change<br />
species composition, obtain a balanced uneven-aged diameterclass<br />
distribution, and to have a basal area <strong>of</strong> 100 to 120<br />
ft 2 /acre midway through the operating interval.<br />
These statistical procedures are applicable to any data<br />
that can be described by a linear model where the data are<br />
obtained from repeated measurements on permanent plots. A<br />
computer program for the Incomplete Multivariate Model with<br />
Correlated Errors will soon be available from the Northeastern<br />
Forest Experiment Station, Broomall, PA 19008 U.S.A. l<br />
1 Arner , S. L, and Seegrist, D. W.: MX4,A computer<br />
program for th.e maximum likelihood estimator <strong>of</strong> the incomplete<br />
multivariate normal linear model, In preparation.
- 157 -<br />
QUANTIFYING FOREST SCIENCE WITH BIOMASS<br />
PART ONE: SITE PRODUCTIVITY<br />
Harold E. Young<br />
Complete Tree Institute<br />
School <strong>of</strong> Forest Resources<br />
<strong>University</strong> <strong>of</strong> Maine<br />
Orone, Maine 04469 USA<br />
and<br />
John H. Ribe<br />
Woodlands Department<br />
International Paper Co.<br />
9 Green Street<br />
Augusta, Maine 04330 USA<br />
Prepared for: Meeting <strong>of</strong> 54.01, Mensuration Growth and Yield, IUFRO<br />
<strong>Oxford</strong>, Great Britain<br />
September 16-22, 1979
- 165 -<br />
Young, H. E. and E. G. Stoecke1er. 1956.<br />
interpretation mapping. Photo. Engr.<br />
Quantitative evaluation <strong>of</strong> photo<br />
22:137-143.<br />
Young, H. E. 1971. Biomass sampling methods for puckerbrush stands. In<br />
Forest Biomass Studies (H. Young ed.). <strong>University</strong> <strong>of</strong> Maine, Orono,<br />
Maine. pp. 179-190.<br />
Young, H. E. 1976. A summary and analysis <strong>of</strong> weight table studies. In<br />
Olso Biomass Studies (H. Young ed.). <strong>University</strong> <strong>of</strong> Maine, Orono, Maine.<br />
pp. 251-283.
- 166 -<br />
QUANTIFYING FOREST SCIENCE WITH BIOMASS<br />
PART TWO: CONIFER THINNING STUDIES<br />
Harold E. Young<br />
Complete Tree Institute<br />
School <strong>of</strong> Forest Resources<br />
<strong>University</strong> <strong>of</strong> Maine<br />
Orono, Maine 04469 USA<br />
and<br />
Donald C. Hoppe<br />
Woodlands Department<br />
Jar! F10restale Agropecuaria Ltda.<br />
Belem, Para<br />
Brazil<br />
Prepared for: Meeting <strong>of</strong> S4.01, Mensuration and Yield, IUFRO<br />
<strong>Oxford</strong>, Great Britain<br />
September 16-22, 1979
Table I. Thinning Immature S<strong>of</strong>twood Stands on Meso Sites in Maine by Senior Industrial<br />
Foresters Assuming (1) the existance <strong>of</strong> efficient economical machines for thinning<br />
and (2) a market for all material thinned.
- 170 -<br />
Table 2 shows the range <strong>of</strong> differences, calculated as a percent, between<br />
the actual field weight and the calculated weight for individual plots and the<br />
relatively low difference when a group <strong>of</strong> six or more plots are combined.<br />
Using the results <strong>of</strong> Table 1 as a guideline the marking instructions for<br />
the second summer were to remove about 45% <strong>of</strong> the above ground biomass from<br />
about 65% <strong>of</strong> the living trees primarily in the smaller diameter classes. The<br />
only exception to this was that 50% <strong>of</strong> the biomass was to be removed from 50%<br />
<strong>of</strong> the trees in the very dense young conifer stands. Table 3 shows the results<br />
<strong>of</strong> the thinning during the second summer by age class <strong>of</strong> the stands. The standards<br />
were achieved in the dense young stands but in the "normal" densities an<br />
average <strong>of</strong> 10.5% more biomass was removed from 15.5% more trees than the marking<br />
rules recommended. Table 4 shows the thinnings that would have achieved<br />
the desired results in the "normal" stands. It is interesting to note the large<br />
number <strong>of</strong> trees per acre that would be left compared to the number <strong>of</strong> trees<br />
per acre recommended by the industrial chief foresters.<br />
DISCUSSION<br />
For this study stand selection depended on combinations <strong>of</strong> stand age and<br />
moisture conditions. To expedite matters the field crews were directed to specific<br />
areas known to be quite wet, such as bogs, or quite dry such as the vast<br />
sandy area in Washington County. The time to locate a specific plot varied from<br />
a few minutes to two or more hours. A more refined classification scheme involving<br />
5-9 moisture regimes, or one based on landforms or one based on soil series<br />
or groups <strong>of</strong> soils series would greatly increase the time required to locate a<br />
series <strong>of</strong> plots extending over the desired age range for each member <strong>of</strong> the classification<br />
scheme.<br />
An experienced two person field crew can establish and then cut and weigh<br />
all <strong>of</strong> the above ground material on a 1/100 acre plot plus sub-sampling in about<br />
one-half day. In contrast it takes only about 30-45 minutes to establish and<br />
measure the trees on the same size plot when weight tables will be used to estimate<br />
the biomass. Inasmuch as approximately six 1/100 acre plots are necessary<br />
to obtain a reliable estimate <strong>of</strong> the average biomass in a' stand when using weight<br />
tables, the total time for the stand is about the same as that to destructively<br />
sample a single plot.<br />
Table 3 shows the margin by which the field crew failed to meet the thinnings<br />
standard that had been established. This is primarily a planning error<br />
by the senior author and to a much lesser degree the fact that the crew had no<br />
prior experience with biomass. If the weight tables used in phase one had been<br />
used to check the marking on the first few plots and possibly once a week thereafter<br />
while field work was in progress the crew would have come closer to the<br />
standard <strong>of</strong> thinning 45% <strong>of</strong> the above ground biomass from 65% <strong>of</strong> the living trees<br />
as indicated in table 4.<br />
Two silvicultural arguments that encourage a thinning program in fully<br />
stocked immature conifer stands are (1) the very high density <strong>of</strong> young stands<br />
which decreases rapidly with increase in age and (2) the corresponding tonnage<br />
in standing dead trees with increase in age. The latter (Chase and Young 1976)<br />
can be used for pulp increasing the productivity per acre.
Table 2. Comparison <strong>of</strong> Actual Plot Biomass and Calculated Biomass on an Acre Basis Using 1975 Data<br />
O'<strong>of</strong> Ave. Dif. Between Range <strong>of</strong> Difference<br />
Plots Calculated and Actual Between Actual and Calculated<br />
Region Location Biomass as a Percent Biomass for Individual Plots<br />
Northern St. Pamphi1e 7 +4.4% (-9.7%) - (+30.5%)<br />
Ashland 9 +3.1% (-4.6%) - (+6.9%)<br />
Telos 7 +6.1% (-9.4%) - (+26.5%) .....,<br />
All 26 +4.5% (-9.7%) - (+30.5%)<br />
Central Princeton 8 -1.1% (-18.0%) - (+18.3%)<br />
Machias 8 -0.1% (-7.5%) - (10.5%)<br />
PassaduDlkeag 10 +0.1% (-13.9%) - (+20.4%)<br />
All 26 -0.3% (-18.0%) - (20.4%)<br />
Southwestern Rangeley 6 +2.6% (-12.1%) - (+10.9%)<br />
All 55 +2.2% (-13.9%) - (+30.5%)
Table 4. Average Thinning Conditions for 1975 Data to Achieve Thinning <strong>of</strong> 45% <strong>of</strong> Biomass by<br />
Removing 65% <strong>of</strong> Trees 1.0" dbh and Larger<br />
Oven dry biomass<br />
in tons per acre<br />
No. <strong>of</strong> stand- No. <strong>of</strong> trees<br />
Age<br />
Class<br />
65% <strong>of</strong> trees<br />
1.0" dbh and<br />
larger<br />
ing dead trees<br />
1.0" dbh and<br />
larger<br />
Total trees<br />
to be removed<br />
per acre<br />
45% <strong>of</strong> trees<br />
1.0" dbh and<br />
larger<br />
Standing<br />
dead Total<br />
left per acre<br />
1.0" 'dbh and<br />
larger<br />
.......<br />
w<br />
28-39<br />
(normal) 2900 3900 6800 26.3 4.2 30.5 1500<br />
40-74 2400 2100 4500 30.8 6.5 37.3 1200<br />
..