- Page 1 and 2:
The Relationship Between The 1990 C
- Page 3 and 4:
TABLE OF CONTENTS Technical Report:
- Page 5 and 6:
The Relationship Between the 1990 C
- Page 7 and 8:
After 1990, however, the crosswalks
- Page 9 and 10:
entertainment, and recreation,”
- Page 11 and 12:
apply those factors to census data
- Page 13 and 14:
“majority” choice in most cases
- Page 15 and 16:
went to category 340, “Emergency
- Page 17 and 18:
Industry 1. Small, new, and residua
- Page 19 and 20:
The data presented in this report a
- Page 22 and 23:
1990 CENSUS CODE APPENDIX A. 1990 C
- Page 24 and 25:
CENSUS CODE MANUFACTURING - Continu
- Page 26 and 27:
CENSUS CODE RETAIL TRADE 580 Lumber
- Page 28:
CENSUS CODE PROFESSIONAL AND RELATE
- Page 31 and 32:
045 Metallurgical and materials (16
- Page 33 and 34:
Writers, Artists, Entertainers, and
- Page 35 and 36:
327 Order clerks (4664) 328 Personn
- Page 37 and 38:
457 Barbers (5252) 458 Hairdressers
- Page 39 and 40:
594 Paving, surfacing, and tamping
- Page 41 and 42:
749 Miscellaneous textile machine o
- Page 44 and 45:
APPENDIX C. CENSUS 2000 INDUSTRY CL
- Page 46 and 47:
Census 2000 1997 NAICS Code Categor
- Page 48 and 49:
Census 2000 1997 NAICS Code Categor
- Page 50:
Census 2000 1997 NAICS Code Categor
- Page 53 and 54:
Census 2000 2000 SOC Code Category
- Page 55 and 56:
Census 2000 2000 SOC Code Category
- Page 57 and 58:
Census 2000 2000 SOC Code Category
- Page 59 and 60:
Census 2000 2000 SOC Code Category
- Page 61 and 62:
Census 2000 2000 SOC Code Category
- Page 64 and 65:
APPENDIX E. BIBLIOGRAPHY OF RELATED
- Page 66 and 67:
APPENDIX G. GLOSSARY OF TERMS AND A
- Page 68 and 69:
Industry and Occupation The 1990 ce
- Page 70 and 71:
1990 Census Codes and Categories Ce
- Page 72 and 73:
1990 Census Codes and Categories Ce
- Page 74 and 75:
1990 Census Codes and Categories Ce
- Page 76 and 77:
1990 Census Codes and Categories Ce
- Page 78 and 79:
1990 Census Codes and Categories Ce
- Page 80 and 81:
1990 Census Codes and Categories Ta
- Page 82 and 83:
1990 Census Codes and Categories Ce
- Page 84 and 85:
1990 Census Codes and Categories Ce
- Page 86 and 87:
1990 Census Codes and Categories Ce
- Page 88 and 89:
1990 Census Codes and Categories Ce
- Page 90 and 91:
1990 Census Codes and Categories Ce
- Page 92 and 93:
Table 2. 1990 Census Occupation Cla
- Page 94 and 95:
1990 Census Codes and Categories Ce
- Page 96 and 97:
1990 Census Codes and Categories Ce
- Page 98 and 99:
1990 Census Codes and Categories Ce
- Page 100 and 101:
1990 Census Codes and Categories Ce
- Page 102 and 103:
1990 Census Codes and Categories Ce
- Page 104 and 105:
1990 Census Codes and Categories Ce
- Page 106 and 107:
1990 Census Codes and Categories Ta
- Page 108 and 109:
1990 Census Codes and Categories Ce
- Page 110 and 111:
1990 Census Codes and Categories Ta
- Page 112 and 113:
1990 Census Codes and Categories Ce
- Page 114 and 115:
1990 Census Codes and Categories Ce
- Page 116 and 117:
1990 Census Codes and Categories Ce
- Page 118 and 119:
1990 Census Codes and Categories Ce
- Page 120 and 121:
1990 Census Codes and Categories Ce
- Page 122 and 123:
1990 Census Codes and Categories Ce
- Page 124 and 125:
1990 Census Codes and Categories Ta
- Page 126 and 127:
1990 Census Codes and Categories Ce
- Page 128 and 129:
1990 Census Codes and Categories Ce
- Page 130 and 131:
1990 Census Codes and Categories Ce
- Page 132 and 133:
1990 Census Codes and Categories Ce
- Page 134 and 135:
1990 Census Codes and Categories Ce
- Page 136 and 137:
1990 Census Codes and Categories Ce
- Page 138 and 139:
1990 Census Codes and Categories Ce
- Page 140 and 141:
1990 Census Codes and Categories Ce
- Page 142 and 143:
1990 Census Codes and Categories Ce
- Page 144 and 145:
Table 7. 1990 Census STF-3 Occupati
- Page 146 and 147:
Table 7. 1990 Census STF-3 Occupati
- Page 148 and 149:
Table 7. 1990 Census STF-3 Occupati
- Page 150 and 151:
Table 6. 1990 Census STF-3 Industry
- Page 152 and 153:
Table 6. 1990 Census STF-3 Industry
- Page 154 and 155:
Table 5. 1990 STF-4 Occupation Grou
- Page 156 and 157:
Table 5. 1990 STF-4 Occupation Grou
- Page 158 and 159:
Table 5. 1990 STF-4 Occupation Grou
- Page 160 and 161:
Table 5. 1990 STF-4 Occupation Grou
- Page 162 and 163:
Table 5. 1990 STF-4 Occupation Grou
- Page 164 and 165:
Table 5. 1990 STF-4 Occupation Grou
- Page 166 and 167:
Table 5. 1990 STF-4 Occupation Grou
- Page 168 and 169:
Table 4. 1990 STF-4 Industry Groups
- Page 170 and 171:
Table 4. 1990 STF-4 Industry Groups
- Page 172 and 173:
Table 4. 1990 STF-4 Industry Groups
- Page 174 and 175:
Table 4. 1990 STF-4 Industry Groups
- Page 176 and 177:
Table 4. 1990 STF-4 Industry Groups
- Page 178 and 179:
Table 3. 1990 Census EEO File Occup
- Page 180 and 181:
1990 Census Codes and Categories Ta
- Page 182 and 183:
1990 Census Codes and Categories Ta
- Page 184 and 185:
1990 Census Codes and Categories Ta
- Page 186 and 187:
1990 Census Codes and Categories Ta
- Page 188 and 189:
1990 Census Codes and Categories Ta
- Page 190 and 191:
1990 Census Codes and Categories Ta
- Page 192 and 193:
1990 Census Codes and Categories Ta
- Page 194 and 195:
1990 Census Codes and Categories Ta
- Page 196 and 197:
1990 Census Codes and Categories Ta
- Page 198 and 199:
1990 Census Codes and Categories Ta
- Page 200 and 201:
1990 Census Codes and Categories Ta
- Page 202 and 203:
1990 Census Codes and Categories Ta
- Page 204 and 205:
1990 Census Codes and Categories Ce
- Page 206 and 207:
1990 Census Codes and Categories Ta
- Page 208 and 209: 1990 Census Codes and Categories Ta
- Page 210 and 211: 1990 Census Codes and Categories Ta
- Page 212 and 213: 1990 Census Codes and Categories Ta
- Page 214 and 215: 1990 Census Codes and Categories Ta
- Page 216 and 217: 1990 Census Codes and Categories Ta
- Page 218 and 219: 1990 Census Codes and Categories Ce
- Page 220 and 221: 1990 Census Codes and Categories Ta
- Page 222 and 223: 1990 Census Codes and Categories Ta
- Page 224 and 225: 1990 Census Codes and Categories Ta
- Page 226 and 227: 1990 Census Codes and Categories Ta
- Page 228 and 229: 1990 Census Codes and Categories Ta
- Page 230 and 231: Table 8. 1990 Census Redistributed
- Page 232 and 233: Table 8. 1990 Census Redistributed
- Page 234 and 235: Table 8. 1990 Census Redistributed
- Page 236 and 237: Table 8. 1990 Census Redistributed
- Page 238 and 239: Table 9. 1990 Census Redistributed
- Page 240 and 241: Table 9. 1990 Census Redistributed
- Page 242 and 243: Table 9. 1990 Census Redistributed
- Page 244 and 245: Table 9. 1990 Census Redistributed
- Page 246 and 247: Table 9. 1990 Census Redistributed
- Page 248 and 249: Table 9. 1990 Census Redistributed
- Page 250 and 251: Table 9. 1990 Census Redistributed
- Page 252 and 253: Table 10. 1990 Census Redistributed
- Page 254 and 255: Table 10. 1990 Census Redistributed
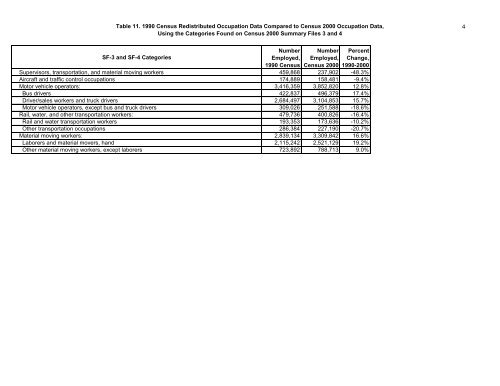
- Page 256 and 257: Table 11. 1990 Census Redistributed
- Page 260 and 261: Template for Converting 1990 Census
- Page 262 and 263: Template for Converting 1990 Census
- Page 264 and 265: Template for Converting 1990 Census
- Page 266 and 267: Template for Converting 1990 Census