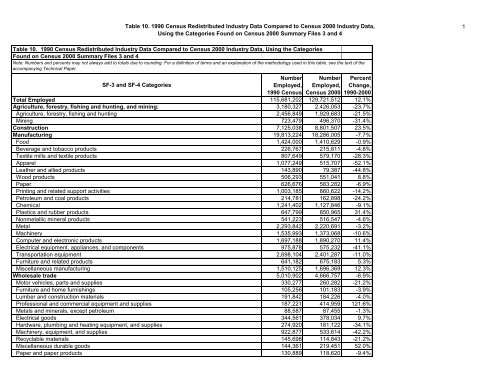
Table 10. <strong>1990</strong> <strong>Census</strong> Redistributed Industry Data Compared to <strong>Census</strong> 2000 Industry Data, Using the Categories Found on <strong>Census</strong> 2000 Summary Files 3 <strong>and</strong> 4 Table 10. <strong>1990</strong> <strong>Census</strong> Redistributed Industry Data Compared to <strong>Census</strong> 2000 Industry Data, Using the Categories Found on <strong>Census</strong> 2000 Summary Files 3 <strong>and</strong> 4 Note: Numbers <strong>and</strong> percents may not always add to totals due to rounding. For a definition of terms <strong>and</strong> an explanation of the methodology used in this table, see the text of the accompanying Technical Paper. SF-3 <strong>and</strong> SF-4 Categories Number Employed, <strong>1990</strong> <strong>Census</strong> Number Employed, <strong>Census</strong> 2000 Percent Change, <strong>1990</strong>-2000 Total Employed 115,681,202 129,721,512 12.1% Agriculture, forestry, fishing <strong>and</strong> hunting, <strong>and</strong> mining: 3,180,327 2,426,053 -23.7% Agriculture, forestry, fishing <strong>and</strong> hunting 2,456,849 1,929,683 -21.5% Mining 723,479 496,370 -31.4% Construction 7,125,038 8,801,507 23.5% Manufacturing 19,813,224 18,286,005 -7.7% Food 1,424,000 1,410,629 -0.9% Beverage <strong>and</strong> tobacco products 226,767 215,811 -4.8% Textile mills <strong>and</strong> textile products 807,649 579,170 -28.3% Apparel 1,077,249 515,707 -52.1% Leather <strong>and</strong> allied products 143,890 79,387 -44.8% Wood products 506,293 551,041 8.8% Paper 626,676 583,282 -6.9% Printing <strong>and</strong> related support activities 1,003,185 860,622 -14.2% Petroleum <strong>and</strong> coal products 214,781 162,898 -24.2% Chemical 1,241,402 1,127,846 -9.1% Plastics <strong>and</strong> rubber products 647,799 850,965 31.4% Nonmetallic mineral products 541,223 516,547 -4.6% Metal 2,293,842 2,220,691 -3.2% Machinery 1,535,993 1,373,068 -10.6% Computer <strong>and</strong> electronic products 1,697,188 1,890,270 11.4% Electrical equipment, appliances, <strong>and</strong> components 975,878 575,232 -41.1% Transportation equipment 2,698,104 2,401,287 -11.0% Furniture <strong>and</strong> related products 641,182 675,183 5.3% Miscellaneous manufacturing 1,510,125 1,696,369 12.3% Wholesale trade 5,010,902 4,666,757 -6.9% Motor vehicles, parts <strong>and</strong> supplies 330,277 260,282 -21.2% Furniture <strong>and</strong> home furnishings 105,256 101,183 -3.9% Lumber <strong>and</strong> construction materials 191,842 184,226 -4.0% Professional <strong>and</strong> commercial equipment <strong>and</strong> supplies 187,221 414,959 121.6% Metals <strong>and</strong> minerals, except petroleum 88,587 87,455 -1.3% Electrical goods 344,561 378,034 9.7% Hardware, plumbing <strong>and</strong> heating equipment, <strong>and</strong> supplies 274,920 181,122 -34.1% Machinery, equipment, <strong>and</strong> supplies 922,877 533,614 -42.2% Recyclable materials 145,698 114,843 -21.2% Miscellaneous durable goods 144,361 219,451 52.0% Paper <strong>and</strong> paper products 130,889 118,620 -9.4% 1
Table 10. <strong>1990</strong> <strong>Census</strong> Redistributed Industry Data Compared to <strong>Census</strong> 2000 Industry Data, Using the Categories Found on <strong>Census</strong> 2000 Summary Files 3 <strong>and</strong> 4 SF-3 <strong>and</strong> SF-4 Categories Number Employed, <strong>1990</strong> <strong>Census</strong> Number Employed, <strong>Census</strong> 2000 Percent Change, <strong>1990</strong>-2000 Drugs, druggist sundries, chemicals <strong>and</strong> allied products 196,269 202,570 3.2% Apparel, piece goods <strong>and</strong> notions 134,357 124,937 -7.0% Groceries <strong>and</strong> related products 801,750 831,910 3.8% Farm product raw materials 62,926 43,916 -30.2% Petroleum <strong>and</strong> petroleum products 171,659 159,951 -6.8% Alcoholic beverages 121,793 129,799 6.6% Farm supplies 89,624 80,933 -9.7% Miscellaneous nondurable goods 566,034 498,952 -11.9% Retail trade 13,672,631 15,221,716 11.3% Motor vehicle <strong>and</strong> parts dealers 1,590,434 1,731,838 8.9% Furniture <strong>and</strong> home furnishings <strong>and</strong> household appliances 625,179 703,936 12.6% Radio, TV <strong>and</strong> computer stores 388,802 792,434 103.8% Building materials, hardware, <strong>and</strong> lawn <strong>and</strong> garden equipment stores 750,098 1,180,682 57.4% Food <strong>and</strong> beverage stores 3,145,341 3,115,543 -0.9% Pharmacies <strong>and</strong> drug stores 579,084 669,172 15.6% Other health <strong>and</strong> personal care stores 167,010 240,027 43.7% Gasoline stations 563,137 407,344 -27.7% Clothing <strong>and</strong> apparel including shoes 892,502 815,537 -8.6% Jewelry, luggage <strong>and</strong> leather goods 184,046 186,436 1.3% Sporting goods, cameras, <strong>and</strong> hobby <strong>and</strong> toy stores 311,228 373,750 20.1% Sewing, needlework, <strong>and</strong> piece goods 72,395 54,004 -25.4% Music stores 116,171 135,194 16.4% Book stores <strong>and</strong> news dealers 115,414 168,803 46.3% Department <strong>and</strong> other general stores 2,063,366 2,340,178 13.4% Florists 186,056 174,432 -6.2% Office supplies <strong>and</strong> stationery 124,835 196,996 57.8% Used merch<strong>and</strong>ise, gift, novelty, souvenir, <strong>and</strong> miscellaneous stores 582,117 834,652 43.4% Electronic shopping <strong>and</strong> mail order houses 138,815 289,602 108.6% Vending machine operators 75,678 59,457 -21.4% Fuel dealers 117,214 62,361 -46.8% Other direct selling establishments 883,708 689,338 -22.0% Transportation <strong>and</strong> warehousing, <strong>and</strong> utilities 6,139,336 6,740,102 9.8% Transportation <strong>and</strong> warehousing 4,850,882 5,565,853 14.7% Air transportation 620,231 667,951 7.7% Rail transportation 298,920 266,695 -10.8% Water transportation 63,336 50,456 -20.3% Truck transportation 1,310,629 1,684,591 28.5% U.S. Postal Service 886,389 896,902 1.2% Other transportation 1,460,968 1,731,114 18.5% Warehousing <strong>and</strong> storage 210,410 268,144 27.4% Utilities 1,288,454 1,174,249 -8.9% 2
- Page 1 and 2:
The Relationship Between The 1990 C
- Page 3 and 4:
TABLE OF CONTENTS Technical Report:
- Page 5 and 6:
The Relationship Between the 1990 C
- Page 7 and 8:
After 1990, however, the crosswalks
- Page 9 and 10:
entertainment, and recreation,”
- Page 11 and 12:
apply those factors to census data
- Page 13 and 14:
“majority” choice in most cases
- Page 15 and 16:
went to category 340, “Emergency
- Page 17 and 18:
Industry 1. Small, new, and residua
- Page 19 and 20:
The data presented in this report a
- Page 22 and 23:
1990 CENSUS CODE APPENDIX A. 1990 C
- Page 24 and 25:
CENSUS CODE MANUFACTURING - Continu
- Page 26 and 27:
CENSUS CODE RETAIL TRADE 580 Lumber
- Page 28:
CENSUS CODE PROFESSIONAL AND RELATE
- Page 31 and 32:
045 Metallurgical and materials (16
- Page 33 and 34:
Writers, Artists, Entertainers, and
- Page 35 and 36:
327 Order clerks (4664) 328 Personn
- Page 37 and 38:
457 Barbers (5252) 458 Hairdressers
- Page 39 and 40:
594 Paving, surfacing, and tamping
- Page 41 and 42:
749 Miscellaneous textile machine o
- Page 44 and 45:
APPENDIX C. CENSUS 2000 INDUSTRY CL
- Page 46 and 47:
Census 2000 1997 NAICS Code Categor
- Page 48 and 49:
Census 2000 1997 NAICS Code Categor
- Page 50:
Census 2000 1997 NAICS Code Categor
- Page 53 and 54:
Census 2000 2000 SOC Code Category
- Page 55 and 56:
Census 2000 2000 SOC Code Category
- Page 57 and 58:
Census 2000 2000 SOC Code Category
- Page 59 and 60:
Census 2000 2000 SOC Code Category
- Page 61 and 62:
Census 2000 2000 SOC Code Category
- Page 64 and 65:
APPENDIX E. BIBLIOGRAPHY OF RELATED
- Page 66 and 67:
APPENDIX G. GLOSSARY OF TERMS AND A
- Page 68 and 69:
Industry and Occupation The 1990 ce
- Page 70 and 71:
1990 Census Codes and Categories Ce
- Page 72 and 73:
1990 Census Codes and Categories Ce
- Page 74 and 75:
1990 Census Codes and Categories Ce
- Page 76 and 77:
1990 Census Codes and Categories Ce
- Page 78 and 79:
1990 Census Codes and Categories Ce
- Page 80 and 81:
1990 Census Codes and Categories Ta
- Page 82 and 83:
1990 Census Codes and Categories Ce
- Page 84 and 85:
1990 Census Codes and Categories Ce
- Page 86 and 87:
1990 Census Codes and Categories Ce
- Page 88 and 89:
1990 Census Codes and Categories Ce
- Page 90 and 91:
1990 Census Codes and Categories Ce
- Page 92 and 93:
Table 2. 1990 Census Occupation Cla
- Page 94 and 95:
1990 Census Codes and Categories Ce
- Page 96 and 97:
1990 Census Codes and Categories Ce
- Page 98 and 99:
1990 Census Codes and Categories Ce
- Page 100 and 101:
1990 Census Codes and Categories Ce
- Page 102 and 103:
1990 Census Codes and Categories Ce
- Page 104 and 105:
1990 Census Codes and Categories Ce
- Page 106 and 107:
1990 Census Codes and Categories Ta
- Page 108 and 109:
1990 Census Codes and Categories Ce
- Page 110 and 111:
1990 Census Codes and Categories Ta
- Page 112 and 113:
1990 Census Codes and Categories Ce
- Page 114 and 115:
1990 Census Codes and Categories Ce
- Page 116 and 117:
1990 Census Codes and Categories Ce
- Page 118 and 119:
1990 Census Codes and Categories Ce
- Page 120 and 121:
1990 Census Codes and Categories Ce
- Page 122 and 123:
1990 Census Codes and Categories Ce
- Page 124 and 125:
1990 Census Codes and Categories Ta
- Page 126 and 127:
1990 Census Codes and Categories Ce
- Page 128 and 129:
1990 Census Codes and Categories Ce
- Page 130 and 131:
1990 Census Codes and Categories Ce
- Page 132 and 133:
1990 Census Codes and Categories Ce
- Page 134 and 135:
1990 Census Codes and Categories Ce
- Page 136 and 137:
1990 Census Codes and Categories Ce
- Page 138 and 139:
1990 Census Codes and Categories Ce
- Page 140 and 141:
1990 Census Codes and Categories Ce
- Page 142 and 143:
1990 Census Codes and Categories Ce
- Page 144 and 145:
Table 7. 1990 Census STF-3 Occupati
- Page 146 and 147:
Table 7. 1990 Census STF-3 Occupati
- Page 148 and 149:
Table 7. 1990 Census STF-3 Occupati
- Page 150 and 151:
Table 6. 1990 Census STF-3 Industry
- Page 152 and 153:
Table 6. 1990 Census STF-3 Industry
- Page 154 and 155:
Table 5. 1990 STF-4 Occupation Grou
- Page 156 and 157:
Table 5. 1990 STF-4 Occupation Grou
- Page 158 and 159:
Table 5. 1990 STF-4 Occupation Grou
- Page 160 and 161:
Table 5. 1990 STF-4 Occupation Grou
- Page 162 and 163:
Table 5. 1990 STF-4 Occupation Grou
- Page 164 and 165:
Table 5. 1990 STF-4 Occupation Grou
- Page 166 and 167:
Table 5. 1990 STF-4 Occupation Grou
- Page 168 and 169:
Table 4. 1990 STF-4 Industry Groups
- Page 170 and 171:
Table 4. 1990 STF-4 Industry Groups
- Page 172 and 173:
Table 4. 1990 STF-4 Industry Groups
- Page 174 and 175:
Table 4. 1990 STF-4 Industry Groups
- Page 176 and 177:
Table 4. 1990 STF-4 Industry Groups
- Page 178 and 179:
Table 3. 1990 Census EEO File Occup
- Page 180 and 181:
1990 Census Codes and Categories Ta
- Page 182 and 183:
1990 Census Codes and Categories Ta
- Page 184 and 185:
1990 Census Codes and Categories Ta
- Page 186 and 187:
1990 Census Codes and Categories Ta
- Page 188 and 189:
1990 Census Codes and Categories Ta
- Page 190 and 191:
1990 Census Codes and Categories Ta
- Page 192 and 193:
1990 Census Codes and Categories Ta
- Page 194 and 195:
1990 Census Codes and Categories Ta
- Page 196 and 197:
1990 Census Codes and Categories Ta
- Page 198 and 199:
1990 Census Codes and Categories Ta
- Page 200 and 201:
1990 Census Codes and Categories Ta
- Page 202 and 203: 1990 Census Codes and Categories Ta
- Page 204 and 205: 1990 Census Codes and Categories Ce
- Page 206 and 207: 1990 Census Codes and Categories Ta
- Page 208 and 209: 1990 Census Codes and Categories Ta
- Page 210 and 211: 1990 Census Codes and Categories Ta
- Page 212 and 213: 1990 Census Codes and Categories Ta
- Page 214 and 215: 1990 Census Codes and Categories Ta
- Page 216 and 217: 1990 Census Codes and Categories Ta
- Page 218 and 219: 1990 Census Codes and Categories Ce
- Page 220 and 221: 1990 Census Codes and Categories Ta
- Page 222 and 223: 1990 Census Codes and Categories Ta
- Page 224 and 225: 1990 Census Codes and Categories Ta
- Page 226 and 227: 1990 Census Codes and Categories Ta
- Page 228 and 229: 1990 Census Codes and Categories Ta
- Page 230 and 231: Table 8. 1990 Census Redistributed
- Page 232 and 233: Table 8. 1990 Census Redistributed
- Page 234 and 235: Table 8. 1990 Census Redistributed
- Page 236 and 237: Table 8. 1990 Census Redistributed
- Page 238 and 239: Table 9. 1990 Census Redistributed
- Page 240 and 241: Table 9. 1990 Census Redistributed
- Page 242 and 243: Table 9. 1990 Census Redistributed
- Page 244 and 245: Table 9. 1990 Census Redistributed
- Page 246 and 247: Table 9. 1990 Census Redistributed
- Page 248 and 249: Table 9. 1990 Census Redistributed
- Page 250 and 251: Table 9. 1990 Census Redistributed
- Page 254 and 255: Table 10. 1990 Census Redistributed
- Page 256 and 257: Table 11. 1990 Census Redistributed
- Page 258 and 259: Table 11. 1990 Census Redistributed
- Page 260 and 261: Template for Converting 1990 Census
- Page 262 and 263: Template for Converting 1990 Census
- Page 264 and 265: Template for Converting 1990 Census
- Page 266 and 267: Template for Converting 1990 Census