

The Relationship Between The 1990 Census and ... - Census Bureau
The Relationship Between The 1990 Census and ... - Census Bureau
The Relationship Between The 1990 Census and ... - Census Bureau

You also want an ePaper? Increase the reach of your titles
YUMPU automatically turns print PDFs into web optimized ePapers that Google loves.
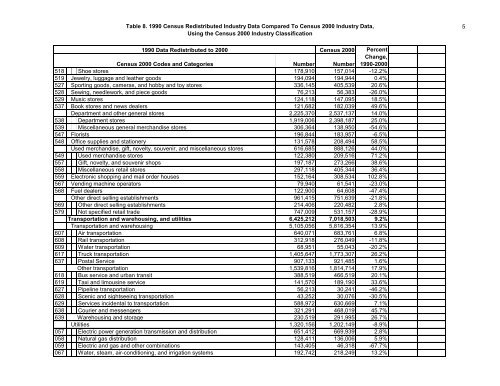
Table 8. <strong>1990</strong> <strong>Census</strong> Redistributed Industry Data Compared To <strong>Census</strong> 2000 Industry Data,<br />
Using the <strong>Census</strong> 2000 Industry Classification<br />
<strong>1990</strong> Data Redistributed to 2000 <strong>Census</strong> 2000 Percent<br />
Change,<br />
<strong>Census</strong> 2000 Codes <strong>and</strong> Categories<br />
Number Number <strong>1990</strong>-2000<br />
518 Shoe stores 178,910 157,014 -12.2%<br />
519 Jewelry, luggage <strong>and</strong> leather goods 194,094 194,944 0.4%<br />
527 Sporting goods, cameras, <strong>and</strong> hobby <strong>and</strong> toy stores 336,145 405,539 20.6%<br />
528 Sewing, needlework, <strong>and</strong> piece goods 76,213 56,383 -26.0%<br />
529 Music stores 124,118 147,095 18.5%<br />
537 Book stores <strong>and</strong> news dealers 121,682 182,039 49.6%<br />
Department <strong>and</strong> other general stores 2,225,370 2,537,137 14.0%<br />
538 Department stores 1,919,006 2,398,187 25.0%<br />
539 Miscellaneous general merch<strong>and</strong>ise stores 306,364 138,950 -54.6%<br />
547 Florists 196,844 183,957 -6.5%<br />
548 Office supplies <strong>and</strong> stationery 131,578 208,494 58.5%<br />
Used merch<strong>and</strong>ise, gift, novelty, souvenir, <strong>and</strong> miscellaneous stores 616,685 888,126 44.0%<br />
549 Used merch<strong>and</strong>ise stores 122,380 209,516 71.2%<br />
557 Gift, novelty, <strong>and</strong> souvenir shops 197,187 273,266 38.6%<br />
558 Miscellaneous retail stores 297,118 405,344 36.4%<br />
559 Electronic shopping <strong>and</strong> mail order houses 152,164 308,534 102.8%<br />
567 Vending machine operators 79,940 61,541 -23.0%<br />
568 Fuel dealers 122,900 64,608 -47.4%<br />
Other direct selling establishments 961,415 751,639 -21.8%<br />
569 Other direct selling establishments 214,406 220,482 2.8%<br />
579 Not specified retail trade 747,009 531,157 -28.9%<br />
Transportation <strong>and</strong> warehousing, <strong>and</strong> utilities 6,425,212 7,018,503 9.2%<br />
Transportation <strong>and</strong> warehousing 5,105,056 5,816,354 13.9%<br />
607 Air transportation 640,071 683,761 6.8%<br />
608 Rail transportation 312,918 276,049 -11.8%<br />
609 Water transportation 68,951 55,043 -20.2%<br />
617 Truck transportation 1,405,647 1,773,307 26.2%<br />
637 Postal Service 907,133 921,485 1.6%<br />
Other transportation 1,539,816 1,814,714 17.9%<br />
618 Bus service <strong>and</strong> urban transit 388,519 466,519 20.1%<br />
619 Taxi <strong>and</strong> limousine service 141,570 189,190 33.6%<br />
627 Pipeline transportation 56,213 30,241 -46.2%<br />
628 Scenic <strong>and</strong> sightseeing transportation 43,252 30,076 -30.5%<br />
629 Services incidental to transportation 588,972 630,669 7.1%<br />
638 Courier <strong>and</strong> messengers 321,291 468,019 45.7%<br />
639 Warehousing <strong>and</strong> storage 230,519 291,995 26.7%<br />
Utilities 1,320,156 1,202,149 -8.9%<br />
057 Electric power generation transmission <strong>and</strong> distribution 651,412 669,939 2.8%<br />
058 Natural gas distribution 128,411 136,006 5.9%<br />
059 Electric <strong>and</strong> gas <strong>and</strong> other combinations 143,405 46,318 -67.7%<br />
067 Water, steam, air-conditioning, <strong>and</strong> irrigation systems 192,742 218,249 13.2%<br />
5


