

The Relationship Between The 1990 Census and ... - Census Bureau
The Relationship Between The 1990 Census and ... - Census Bureau
The Relationship Between The 1990 Census and ... - Census Bureau

You also want an ePaper? Increase the reach of your titles
YUMPU automatically turns print PDFs into web optimized ePapers that Google loves.
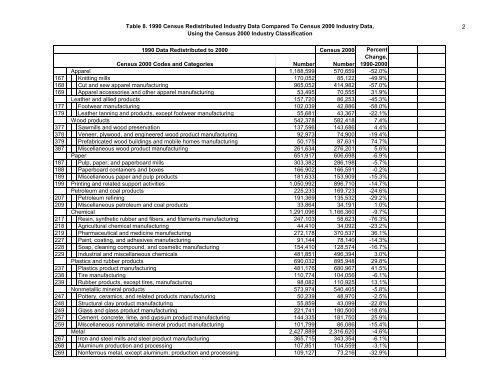
Table 8. <strong>1990</strong> <strong>Census</strong> Redistributed Industry Data Compared To <strong>Census</strong> 2000 Industry Data,<br />
Using the <strong>Census</strong> 2000 Industry Classification<br />
<strong>1990</strong> Data Redistributed to 2000 <strong>Census</strong> 2000 Percent<br />
Change,<br />
<strong>Census</strong> 2000 Codes <strong>and</strong> Categories<br />
Number Number <strong>1990</strong>-2000<br />
Apparel 1,188,599 570,659 -52.0%<br />
167 Knitting mills 170,052 85,122 -49.9%<br />
168 Cut <strong>and</strong> sew apparel manufacturing 965,052 414,982 -57.0%<br />
169 Apparel accessories <strong>and</strong> other apparel manufacturing 53,495 70,555 31.9%<br />
Leather <strong>and</strong> allied products 157,720 86,253 -45.3%<br />
177 Footwear manufacturing 102,039 42,886 -58.0%<br />
179 Leather tanning <strong>and</strong> products, except footwear manufacturing 55,681 43,367 -22.1%<br />
Wood products 542,378 582,418 7.4%<br />
377 Sawmills <strong>and</strong> wood preservation 137,596 143,686 4.4%<br />
378 Veneer, plywood, <strong>and</strong> engineered wood product manufacturing 92,973 74,900 -19.4%<br />
379 Prefabricated wood buildings <strong>and</strong> mobile homes manufacturing 50,175 87,631 74.7%<br />
387 Miscellaneous wood product manufacturing 261,634 276,201 5.6%<br />
Paper 651,917 606,698 -6.9%<br />
187 Pulp, paper, <strong>and</strong> paperboard mills 303,382 286,198 -5.7%<br />
188 Paperboard containers <strong>and</strong> boxes 166,902 166,591 -0.2%<br />
189 Miscellaneous paper <strong>and</strong> pulp products 181,633 153,909 -15.3%<br />
199 Printing <strong>and</strong> related support activities 1,050,992 896,710 -14.7%<br />
Petroleum <strong>and</strong> coal products 225,233 169,723 -24.6%<br />
207 Petroleum refining 191,369 135,532 -29.2%<br />
209 Miscellaneous petroleum <strong>and</strong> coal products 33,864 34,191 1.0%<br />
Chemical 1,291,096 1,166,360 -9.7%<br />
217 Resin, synthetic rubber <strong>and</strong> fibers, <strong>and</strong> filaments manufacturing 247,103 58,623 -76.3%<br />
218 Agricultural chemical manufacturing 44,410 34,092 -23.2%<br />
219 Pharmaceutical <strong>and</strong> medicine manufacturing 272,178 370,537 36.1%<br />
227 Paint, coating, <strong>and</strong> adhesives manufacturing 91,144 78,140 -14.3%<br />
228 Soap, cleaning compound, <strong>and</strong> cosmetic manufacturing 154,410 128,574 -16.7%<br />
229 Industrial <strong>and</strong> miscellaneous chemicals 481,851 496,394 3.0%<br />
Plastics <strong>and</strong> rubber products 690,032 895,948 29.8%<br />
237 Plastics product manufacturing 481,176 680,967 41.5%<br />
238 Tire manufacturing 110,774 104,056 -6.1%<br />
239 Rubber products, except tires, manufacturing 98,082 110,925 13.1%<br />
Nonmetallic mineral products 573,974 540,405 -5.8%<br />
247 Pottery, ceramics, <strong>and</strong> related products manufacturing 50,239 48,970 -2.5%<br />
248 Structural clay product manufacturing 55,859 43,099 -22.8%<br />
249 Glass <strong>and</strong> glass product manufacturing 221,741 180,500 -18.6%<br />
257 Cement, concrete, lime, <strong>and</strong> gypsum product manufacturing 144,335 181,750 25.9%<br />
259 Miscellaneous nonmetallic mineral product manufacturing 101,799 86,086 -15.4%<br />
Metal 2,427,889 2,316,620 -4.6%<br />
267 Iron <strong>and</strong> steel mills <strong>and</strong> steel product manufacturing 365,715 343,354 -6.1%<br />
268 Aluminum production <strong>and</strong> processing 107,851 104,559 -3.1%<br />
269 Nonferrous metal, except aluminum, production <strong>and</strong> processing 109,127 73,216 -32.9%<br />
2


