

The Relationship Between The 1990 Census and ... - Census Bureau
The Relationship Between The 1990 Census and ... - Census Bureau
The Relationship Between The 1990 Census and ... - Census Bureau

Create successful ePaper yourself
Turn your PDF publications into a flip-book with our unique Google optimized e-Paper software.
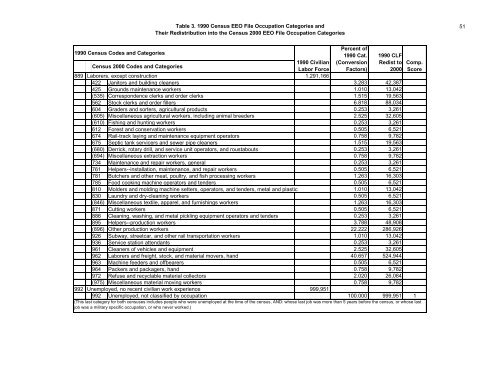
<strong>1990</strong> <strong>Census</strong> Codes <strong>and</strong> Categories<br />
Table 3. <strong>1990</strong> <strong>Census</strong> EEO File Occupation Categories <strong>and</strong><br />
<strong>The</strong>ir Redistribution into the <strong>Census</strong> 2000 EEO File Occupation Categories<br />
Percent of<br />
<strong>1990</strong> Cat.<br />
(Conversion<br />
Factors)<br />
<strong>1990</strong> CLF<br />
Redist to<br />
2000<br />
<strong>Census</strong> 2000 Codes <strong>and</strong> Categories<br />
<strong>1990</strong> Civilian<br />
Labor Force<br />
Comp.<br />
Score<br />
889 Laborers, except construction 1,291,166<br />
422 Janitors <strong>and</strong> building cleaners 3.283 42,387<br />
425 Grounds maintenance workers 1.010 13,042<br />
(535) Correspondence clerks <strong>and</strong> order clerks 1.515 19,563<br />
562 Stock clerks <strong>and</strong> order fillers 6.818 88,034<br />
604 Graders <strong>and</strong> sorters, agricultural products 0.253 3,261<br />
(605) Miscellaneous agricultural workers, including animal breeders 2.525 32,605<br />
(610) Fishing <strong>and</strong> hunting workers 0.253 3,261<br />
612 Forest <strong>and</strong> conservation workers 0.505 6,521<br />
674 Rail-track laying <strong>and</strong> maintenance equipment operators 0.758 9,782<br />
675 Septic tank servicers <strong>and</strong> sewer pipe cleaners 1.515 19,563<br />
(680) Derrick, rotary drill, <strong>and</strong> service unit operators, <strong>and</strong> roustabouts 0.253 3,261<br />
(694) Miscellaneous extraction workers 0.758 9,782<br />
734 Maintenance <strong>and</strong> repair workers, general 0.253 3,261<br />
761 Helpers--installation, maintenance, <strong>and</strong> repair workers 0.505 6,521<br />
781 Butchers <strong>and</strong> other meat, poultry, <strong>and</strong> fish processing workers 1.263 16,303<br />
785 Food cooking machine operators <strong>and</strong> tenders 0.505 6,521<br />
810 Molders <strong>and</strong> molding machine setters, operators, <strong>and</strong> tenders, metal <strong>and</strong> plastic 1.010 13,042<br />
830 Laundry <strong>and</strong> dry-cleaning workers 0.505 6,521<br />
(846) Miscellaneous textile, apparel, <strong>and</strong> furnishings workers 1.263 16,303<br />
871 Cutting workers 0.505 6,521<br />
886 Cleaning, washing, <strong>and</strong> metal pickling equipment operators <strong>and</strong> tenders 0.253 3,261<br />
895 Helpers--production workers 3.788 48,908<br />
(896) Other production workers 22.222 286,926<br />
926 Subway, streetcar, <strong>and</strong> other rail transportation workers 1.010 13,042<br />
936 Service station attendants 0.253 3,261<br />
961 Cleaners of vehicles <strong>and</strong> equipment 2.525 32,605<br />
962 Laborers <strong>and</strong> freight, stock, <strong>and</strong> material movers, h<strong>and</strong> 40.657 524,944<br />
963 Machine feeders <strong>and</strong> offbearers 0.505 6,521<br />
964 Packers <strong>and</strong> packagers, h<strong>and</strong> 0.758 9,782<br />
972 Refuse <strong>and</strong> recyclable material collectors 2.020 26,084<br />
(975) Miscellaneous material moving workers 0.758 9,782<br />
992 Unemployed, no recent civilian work experience 999,951<br />
992 Unemployed, not classified by occupation 100.000 999,951 1<br />
(This last category for both censuses includes people who were unemployed at the time of the census, AND: whose last job was more than 5 years before the census, or whose last<br />
job was a military specific occupation, or who never worked.)<br />
51


