

The Relationship Between The 1990 Census and ... - Census Bureau
The Relationship Between The 1990 Census and ... - Census Bureau
The Relationship Between The 1990 Census and ... - Census Bureau

You also want an ePaper? Increase the reach of your titles
YUMPU automatically turns print PDFs into web optimized ePapers that Google loves.
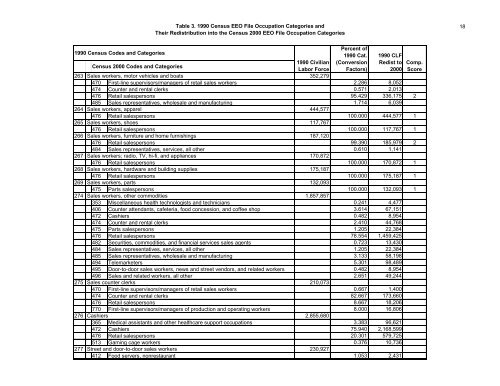
<strong>1990</strong> <strong>Census</strong> Codes <strong>and</strong> Categories<br />
Table 3. <strong>1990</strong> <strong>Census</strong> EEO File Occupation Categories <strong>and</strong><br />
<strong>The</strong>ir Redistribution into the <strong>Census</strong> 2000 EEO File Occupation Categories<br />
Percent of<br />
<strong>1990</strong> Cat.<br />
(Conversion<br />
Factors)<br />
<strong>1990</strong> CLF<br />
Redist to<br />
2000<br />
<strong>Census</strong> 2000 Codes <strong>and</strong> Categories<br />
<strong>1990</strong> Civilian<br />
Labor Force<br />
263 Sales workers, motor vehicles <strong>and</strong> boats 352,279<br />
470 First-line supervisors/managers of retail sales workers 2.286 8,052<br />
474 Counter <strong>and</strong> rental clerks 0.571 2,013<br />
476 Retail salespersons 95.429 336,175 2<br />
485 Sales representatives, wholesale <strong>and</strong> manufacturing 1.714 6,039<br />
264 Sales workers, apparel 444,577<br />
476 Retail salespersons 100.000 444,577 1<br />
265 Sales workers, shoes 117,767<br />
476 Retail salespersons 100.000 117,767 1<br />
266 Sales workers, furniture <strong>and</strong> home furnishings 187,120<br />
476 Retail salespersons 99.390 185,979 2<br />
484 Sales representatives, services, all other 0.610 1,141<br />
267 Sales workers; radio, TV, hi-fi, <strong>and</strong> appliances 170,872<br />
476 Retail salespersons 100.000 170,872 1<br />
268 Sales workers, hardware <strong>and</strong> building supplies 175,187<br />
476 Retail salespersons 100.000 175,187 1<br />
269 Sales workers, parts 132,093<br />
475 Parts salespersons 100.000 132,093 1<br />
274 Sales workers, other commodities 1,857,857<br />
353 Miscellaneous health technologists <strong>and</strong> technicians 0.241 4,477<br />
406 Counter attendants, cafeteria, food concession, <strong>and</strong> coffee shop 3.614 67,151<br />
472 Cashiers 0.482 8,954<br />
474 Counter <strong>and</strong> rental clerks 2.410 44,768<br />
475 Parts salespersons 1.205 22,384<br />
476 Retail salespersons 78.554 1,459,425<br />
482 Securities, commodities, <strong>and</strong> financial services sales agents 0.723 13,430<br />
484 Sales representatives, services, all other 1.205 22,384<br />
485 Sales representatives, wholesale <strong>and</strong> manufacturing 3.133 58,198<br />
494 Telemarketers 5.301 98,489<br />
495 Door-to-door sales workers, news <strong>and</strong> street vendors, <strong>and</strong> related workers 0.482 8,954<br />
496 Sales <strong>and</strong> related workers, all other 2.651 49,244<br />
275 Sales counter clerks 210,073<br />
470 First-line supervisors/managers of retail sales workers 0.667 1,400<br />
474 Counter <strong>and</strong> rental clerks 82.667 173,660<br />
476 Retail salespersons 8.667 18,206<br />
770 First-line supervisors/managers of production <strong>and</strong> operating workers 8.000 16,806<br />
276 Cashiers 2,855,680<br />
365 Medical assistants <strong>and</strong> other healthcare support occupations 3.383 96,621<br />
472 Cashiers 75.940 2,168,599<br />
476 Retail salespersons 20.301 579,725<br />
513 Gaming cage workers 0.376 10,736<br />
277 Street <strong>and</strong> door-to-door sales workers 230,927<br />
412 Food servers, nonrestaurant 1.053 2,431<br />
Comp.<br />
Score<br />
18


