

The Relationship Between The 1990 Census and ... - Census Bureau
The Relationship Between The 1990 Census and ... - Census Bureau
The Relationship Between The 1990 Census and ... - Census Bureau

Create successful ePaper yourself
Turn your PDF publications into a flip-book with our unique Google optimized e-Paper software.
<strong>1990</strong> <strong>Census</strong> Codes <strong>and</strong> Categories<br />
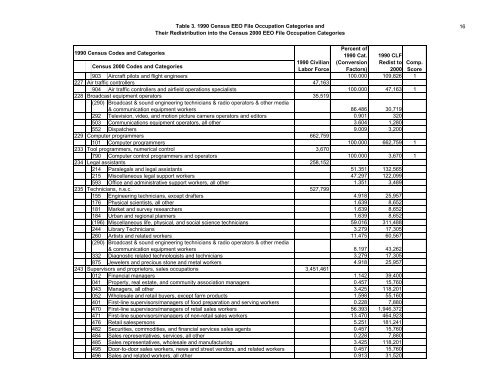
Table 3. <strong>1990</strong> <strong>Census</strong> EEO File Occupation Categories <strong>and</strong><br />
<strong>The</strong>ir Redistribution into the <strong>Census</strong> 2000 EEO File Occupation Categories<br />
Percent of<br />
<strong>1990</strong> Cat.<br />
(Conversion<br />
Factors)<br />
<strong>1990</strong> CLF<br />
Redist to<br />
2000<br />
<strong>Census</strong> 2000 Codes <strong>and</strong> Categories<br />
<strong>1990</strong> Civilian<br />
Labor Force<br />
Comp.<br />
Score<br />
903 Aircraft pilots <strong>and</strong> flight engineers 100.000 109,826 1<br />
227 Air traffic controllers 47,163<br />
904 Air traffic controllers <strong>and</strong> airfield operations specialists 100.000 47,163 1<br />
228 Broadcast equipment operators<br />
(290) Broadcast & sound engineering technicians & radio operators & other media<br />
35,519<br />
& communication equipment workers 86.486 30,719<br />
292 Television, video, <strong>and</strong> motion picture camera operators <strong>and</strong> editors 0.901 320<br />
503 Communications equipment operators, all other 3.604 1,280<br />
552 Dispatchers 9.009 3,200<br />
229 Computer programmers 662,759<br />
101 Computer programmers 100.000 662,759 1<br />
233 Tool programmers, numerical control 3,670<br />
790 Computer control programmers <strong>and</strong> operators 100.000 3,670 1<br />
234 Legal assistants 258,152<br />
214 Paralegals <strong>and</strong> legal assistants 51.351 132,565<br />
215 Miscellaneous legal support workers 47.297 122,099<br />
593 Office <strong>and</strong> administrative support workers, all other 1.351 3,489<br />
235 Technicians, n.e.c. 527,799<br />
155 Engineering technicians, except drafters 4.918 25,957<br />
176 Physical scientists, all other 1.639 8,652<br />
181 Market <strong>and</strong> survey researchers 1.639 8,652<br />
184 Urban <strong>and</strong> regional planners 1.639 8,652<br />
(196) Miscellaneous life, physical, <strong>and</strong> social science technicians 59.016 311,488<br />
244 Library Technicians 3.279 17,305<br />
260 Artists <strong>and</strong> related workers 11.475 60,567<br />
(290) Broadcast & sound engineering technicians & radio operators & other media<br />
& communication equipment workers 8.197 43,262<br />
332 Diagnostic related technologists <strong>and</strong> technicians 3.279 17,305<br />
875 Jewelers <strong>and</strong> precious stone <strong>and</strong> metal workers 4.918 25,957<br />
243 Supervisors <strong>and</strong> proprietors, sales occupations 3,451,461<br />
012 Financial managers 1.142 39,400<br />
041 Property, real estate, <strong>and</strong> community association managers 0.457 15,760<br />
043 Managers, all other 3.425 118,201<br />
052 Wholesale <strong>and</strong> retail buyers, except farm products 1.598 55,160<br />
401 First-line supervisors/managers of food preparation <strong>and</strong> serving workers 0.228 7,880<br />
470 First-line supervisors/managers of retail sales workers 56.393 1,946,372<br />
471 First-line supervisors/managers of non-retail sales workers 13.470 464,923<br />
476 Retail salespersons 5.251 181,241<br />
482 Securities, commodities, <strong>and</strong> financial services sales agents 0.457 15,760<br />
484 Sales representatives, services, all other 0.228 7,880<br />
485 Sales representatives, wholesale <strong>and</strong> manufacturing 3.425 118,201<br />
495 Door-to-door sales workers, news <strong>and</strong> street vendors, <strong>and</strong> related workers 0.457 15,760<br />
496 Sales <strong>and</strong> related workers, all other 0.913 31,520<br />
16


