

The Relationship Between The 1990 Census and ... - Census Bureau
The Relationship Between The 1990 Census and ... - Census Bureau
The Relationship Between The 1990 Census and ... - Census Bureau

Create successful ePaper yourself
Turn your PDF publications into a flip-book with our unique Google optimized e-Paper software.
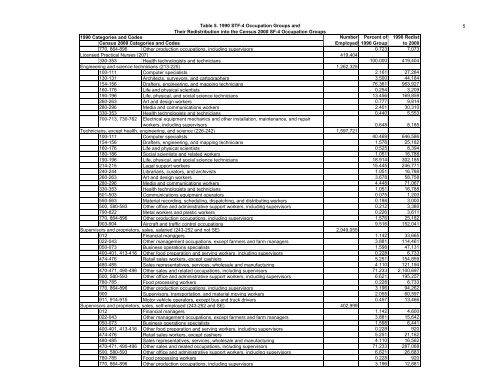
Table 5. <strong>1990</strong> STF-4 Occupation Groups <strong>and</strong><br />
<strong>The</strong>ir Redistribution into the <strong>Census</strong> 2000 SF-4 Occupation Groups<br />
<strong>1990</strong> Categories <strong>and</strong> Codes Number Percent of <strong>1990</strong> Redist<br />
<strong>Census</strong> 2000 Categories <strong>and</strong> Codes<br />
Employed <strong>1990</strong> Group to 2000<br />
770, 864-896 Other production occupations, including supervisors 0.723 7,073<br />
Licensed Practical Nurses (207) 419,404<br />
330-353 Health technologists <strong>and</strong> technicians 100.000 419,404<br />
Engineering <strong>and</strong> science technicians (213-225) 1,262,325<br />
100-111 Computer specialists 2.161 27,284<br />
130-131 Architects, surveyors, <strong>and</strong> cartographers 3.500 44,184<br />
154-156 Drafters, engineering, <strong>and</strong> mapping technicians 76.361 963,927<br />
160-176 Life <strong>and</strong> physical scientists 0.254 3,209<br />
190-196 Life, physical, <strong>and</strong> social science technicians 13.456 169,859<br />
260-263 Art <strong>and</strong> design workers 0.777 9,814<br />
280-296 Media <strong>and</strong> communications workers 2.401 30,310<br />
330-353 Health technologists <strong>and</strong> technicians 0.440 5,553<br />
700-713, 730-762 Electrical equipment mechanics <strong>and</strong> other installation, maintenance, <strong>and</strong> repair<br />
workers, including supervisors 0.648 8,185<br />
Technicians, except health, engineering, <strong>and</strong> science (226-242) 1,597,721<br />
100-111 Computer specialists 40.469 646,586<br />
154-156 Drafters, engineering, <strong>and</strong> mapping technicians 1.576 25,182<br />
160-176 Life <strong>and</strong> physical scientists 0.525 8,394<br />
180-186 Social scientists <strong>and</strong> related workers 1.051 16,788<br />
190-196 Life, physical, <strong>and</strong> social science technicians 18.914 302,185<br />
214-215 Legal support workers 15.445 246,771<br />
240-244 Librarians, curators, <strong>and</strong> archivists 1.051 16,788<br />
260-263 Art <strong>and</strong> design workers 3.678 58,758<br />
280-296 Media <strong>and</strong> communications workers 4.448 71,067<br />
330-353 Health technologists <strong>and</strong> technicians 1.051 16,788<br />
501-503 Communications equipment operators 0.075 1,200<br />
550-563 Material recording, scheduling, dispatching, <strong>and</strong> distributing workers 0.188 3,000<br />
500, 580-593 Other office <strong>and</strong> administrative support workers, including supervisors 0.212 3,380<br />
790-822 Metal workers <strong>and</strong> plastic workers 0.226 3,611<br />
770, 864-896 Other production occupations, including supervisors 1.576 25,182<br />
903-904 Aircraft <strong>and</strong> traffic control occupations 9.516 152,041<br />
Supervisors <strong>and</strong> proprietors, sales, salaried (243-252 <strong>and</strong> not SE) 2,949,055<br />
012 Financial managers 1.142 33,665<br />
022-043 Other management occupations, except farmers <strong>and</strong> farm managers 3.881 114,461<br />
050-073 Business operations specialists 1.598 47,131<br />
400-401, 413-416 Other food preparation <strong>and</strong> serving workers, including supervisors 0.228 6,733<br />
474-476 Retail sales workers, except cashiers 5.251 154,859<br />
480-485 Sales representatives, services, wholesale <strong>and</strong> manufacturing 4.110 121,194<br />
470-471, 490-496 Other sales <strong>and</strong> related occupations, including supervisors 71.233 2,100,697<br />
500, 580-593 Other office <strong>and</strong> administrative support workers, including supervisors 6.621 195,257<br />
780-785 Food processing workers 0.228 6,733<br />
770, 864-896 Other production occupations, including supervisors 3.196 94,262<br />
900 Supervisors, transportation, <strong>and</strong> material moving workers 2.055 60,597<br />
911, 914-915 Motor vehicle operators, except bus <strong>and</strong> truck drivers 0.457 13,466<br />
Supervisors <strong>and</strong> proprietors, sales, self-employed (243-252 <strong>and</strong> SE) 402,999<br />
012 Financial managers 1.142 4,600<br />
022-043 Other management occupations, except farmers <strong>and</strong> farm managers 3.881 15,642<br />
050-073 Business operations specialists 1.598 6,441<br />
400-401, 413-416 Other food preparation <strong>and</strong> serving workers, including supervisors 0.228 920<br />
474-476 Retail sales workers, except cashiers 5.251 21,162<br />
480-485 Sales representatives, services, wholesale <strong>and</strong> manufacturing 4.110 16,562<br />
470-471, 490-496 Other sales <strong>and</strong> related occupations, including supervisors 71.233 287,068<br />
500, 580-593 Other office <strong>and</strong> administrative support workers, including supervisors 6.621 26,683<br />
780-785 Food processing workers 0.228 920<br />
770, 864-896 Other production occupations, including supervisors 3.196 12,881<br />
5


