

The Relationship Between The 1990 Census and ... - Census Bureau
The Relationship Between The 1990 Census and ... - Census Bureau
The Relationship Between The 1990 Census and ... - Census Bureau

Create successful ePaper yourself
Turn your PDF publications into a flip-book with our unique Google optimized e-Paper software.
<strong>1990</strong> <strong>Census</strong> Codes <strong>and</strong> Categories<br />
<strong>Census</strong> 2000 Codes <strong>and</strong> Categories<br />
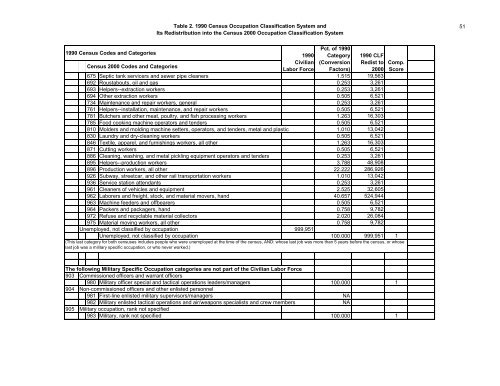
Table 2. <strong>1990</strong> <strong>Census</strong> Occupation Classification System <strong>and</strong><br />
Its Redistribution into the <strong>Census</strong> 2000 Occupation Classification System<br />
<strong>1990</strong><br />
Civilian<br />
Labor Force<br />
Pct. of <strong>1990</strong><br />
Category<br />
(Conversion<br />
Factors)<br />
<strong>1990</strong> CLF<br />
Redist to<br />
2000<br />
Comp.<br />
Score<br />
675 Septic tank servicers <strong>and</strong> sewer pipe cleaners 1.515 19,563<br />
692 Roustabouts, oil <strong>and</strong> gas 0.253 3,261<br />
693 Helpers--extraction workers 0.253 3,261<br />
694 Other extraction workers 0.505 6,521<br />
734 Maintenance <strong>and</strong> repair workers, general 0.253 3,261<br />
761 Helpers--installation, maintenance, <strong>and</strong> repair workers 0.505 6,521<br />
781 Butchers <strong>and</strong> other meat, poultry, <strong>and</strong> fish processing workers 1.263 16,303<br />
785 Food cooking machine operators <strong>and</strong> tenders 0.505 6,521<br />
810 Molders <strong>and</strong> molding machine setters, operators, <strong>and</strong> tenders, metal <strong>and</strong> plastic 1.010 13,042<br />
830 Laundry <strong>and</strong> dry-cleaning workers 0.505 6,521<br />
846 Textile, apparel, <strong>and</strong> furnishings workers, all other 1.263 16,303<br />
871 Cutting workers 0.505 6,521<br />
886 Cleaning, washing, <strong>and</strong> metal pickling equipment operators <strong>and</strong> tenders 0.253 3,261<br />
895 Helpers--production workers 3.788 48,908<br />
896 Production workers, all other 22.222 286,926<br />
926 Subway, streetcar, <strong>and</strong> other rail transportation workers 1.010 13,042<br />
936 Service station attendants 0.253 3,261<br />
961 Cleaners of vehicles <strong>and</strong> equipment 2.525 32,605<br />
962 Laborers <strong>and</strong> freight, stock, <strong>and</strong> material movers, h<strong>and</strong> 40.657 524,944<br />
963 Machine feeders <strong>and</strong> offbearers 0.505 6,521<br />
964 Packers <strong>and</strong> packagers, h<strong>and</strong> 0.758 9,782<br />
972 Refuse <strong>and</strong> recyclable material collectors 2.020 26,084<br />
975 Material moving workers, all other 0.758 9,782<br />
Unemployed, not classified by occupation 999,951<br />
Unemployed, not classified by occupation 100.000 999,951 1<br />
(This last category for both censuses includes people who were unemployed at the time of the census, AND: whose last job was more than 5 years before the census, or whose<br />
last job was a military specific occupation, or who never worked.)<br />
<strong>The</strong> following Military Specific Occupation categories are not part of the Civilian Labor Force<br />
903 Commissioned officers <strong>and</strong> warrant officers<br />
980 Military officer special <strong>and</strong> tactical operations leaders/managers 100.000 1<br />
904 Non-commissioned officers <strong>and</strong> other enlisted personnel<br />
981 First-line enlisted military supervisors/managers NA<br />
982 Military enlisted tactical operations <strong>and</strong> air/weapons specialists <strong>and</strong> crew members NA<br />
905 Military occupation, rank not specified<br />
983 Military, rank not specified 100.000 1<br />
51


