Luka Ploče d.d.
Luka Ploče d.d.
Luka Ploče d.d.

Create successful ePaper yourself
Turn your PDF publications into a flip-book with our unique Google optimized e-Paper software.
LUKA PLOČE d.d.<br />
Trg kralja Tomislava 21<br />
20 340 <strong>Ploče</strong><br />
OIB: 51228874907<br />
LUKA PLOČE GROUP<br />
UNAUDITED CONSOLIDATED REPORT<br />
FOR PERIOD<br />
FROM 01.01. UNTIL 30.06.2012.<br />
<strong>Ploče</strong>, July 2012.
CONTENTS:<br />
a) MANAGEMENT BOARD'S REPORT<br />
- Balance sheet<br />
- P&L (profit and loss account)<br />
- Cash flow statement<br />
- Change in capital statement<br />
b) STATEMENT OF PERSONS RESPONSIBLE FOR<br />
PREPARATION OF FINANCIAL REPORTS
<strong>Luka</strong> <strong>Ploče</strong> Group's Interim Report for the first six months of 2012.<br />
MANAGEMENT BOARD'S STATEMENT ON POSITION OF<br />
THE COMPANY IN PERIOD FROM 01.01.2012. TO 30.06.2012.<br />
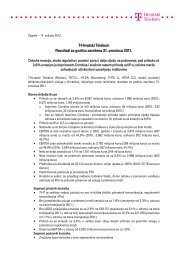
FINANCIAL RESULTS OF THE LUKA PLOČE GROUP IN I-VI 2012.:<br />
- Traffic of cargo through the port of <strong>Ploče</strong>: 1,40 million tones of<br />
cargoes<br />
- 34 % in comparison with the same period of the previous year.<br />
- Revenues from sales: 64,34 million kuna<br />
- 10,88% in comparison with the same period of the previous year.<br />
- EBITDA (profit before interests, taxation and depreciation) 7,8<br />
million kuna<br />
- EBITDA margin: 12,14%<br />
- EBIT: 1,30 million kuna<br />
- EBIT margin: 2,04%<br />
- Net profit: 7,08 million kuna<br />
- Cash flow from operating activities: 2,17 million kuna<br />
- Cash flow from investing activities: -10,80 million kuna
<strong>Luka</strong> <strong>Ploče</strong> Group's Interim Report for the first six months of 2012.<br />
CONSOLIDATED REVENUE<br />
In the first half of the year 2012. operating revenues amounted to 63,34<br />
milion kuna which is 10,88% decrease over the previous year. The fall in<br />
operating revenues is mainly caused by the drop in bulk cargo traffic in<br />
the last quarter due to difficulties in the operations of major customers in<br />
Bosnia and Herzegovina and Italy.<br />
Structure of the <strong>Luka</strong> <strong>Ploče</strong> Group's operating revenue (in mill kuna)<br />
75,00<br />
70,00<br />
65,00<br />
60,00<br />
55,00<br />
50,00<br />
45,00<br />
40,00<br />
35,00<br />
30,00<br />
72,20<br />
64,34<br />
I-VI 2011. I-VI 2012.
<strong>Luka</strong> <strong>Ploče</strong> Group's Interim Report for the first six months of 2012.<br />
OPERATING EXPENSES OF LUKA PLOČE GROUP<br />
Operating expenses amount to 63,04 million kuna which represent the<br />
decrease of 5,8% in comparison to the same period of the previous year.<br />
Decrease in expenses is the result of the decrease of costs of material<br />
and decrease of costs of external services.<br />
Structure of operating costs in the total operating expenses<br />
70,00<br />
60,00<br />
50,00<br />
40,00<br />
30,00<br />
20,00<br />
10,00<br />
0,00<br />
6,09<br />
7,14<br />
8,82<br />
9,34<br />
35,02<br />
6,52<br />
6,64<br />
7,50<br />
7,25<br />
34,07<br />
I-VI 2011. I-VI 2012.<br />
Depreciation<br />
Other operational<br />
costs<br />
Services cost<br />
Cost of material<br />
Labour cost<br />
Decrease of the costs is the result of the performed rationalization of the<br />
business operation aimed at increasing of the effectiveness of the<br />
operation.
<strong>Luka</strong> <strong>Ploče</strong> Group's Interim Report for the first six months of 2012.<br />
FINANCIAL POSITION<br />
Due to the global slowdown in production and consumption, <strong>Luka</strong> <strong>Ploče</strong><br />
Group has had disadvantageous position in comparison to the previous<br />
year. It has led a conservative business politic by a low debt ratio, which<br />
is indicated by the ratio between borrowing and assets of only 0.11% on<br />
31.12.2011. and the same ratio of 0,10% on 30.06.2012.<br />
The largest part of the <strong>Luka</strong> <strong>Ploče</strong> Group's borrowings refers to<br />
liabilities arising from finance leases of equipment (94%) while the rest<br />
of the loans are related to liabilities to the state for residential flats sold<br />
to employees.<br />
The structure of financial liabilities of <strong>Luka</strong> <strong>Ploče</strong> Group (in mill kuna)<br />
100,00<br />
80,00<br />
60,00<br />
40,00<br />
20,00<br />
0,00<br />
36,53<br />
46,02<br />
27,17<br />
47,14<br />
31.12.2011. 30.06.2012.<br />
Short term liabilities<br />
Long termliabilities<br />
Structure of the sources of funding of <strong>Luka</strong> <strong>Ploče</strong> Group (in mill kuna)<br />
500,00<br />
400,00<br />
300,00<br />
200,00<br />
100,00<br />
0,00<br />
82,55 74,32<br />
402,93 410,48<br />
31.12.2011. 30.06.2012.<br />
Liabilities<br />
Equity
<strong>Luka</strong> <strong>Ploče</strong> Group's Interim Report for the first six months of 2012.<br />
KEY INDICATORS<br />
(in million kuna)<br />
DESCRIPTION 31.12.2011. 30.06.2012.<br />
Total debt 82,55 74,32<br />
Net debt +21,86 +29,20<br />
Interest coverage ratio 5,9 0,73<br />
Debt Indicators 0,11 0,10<br />
Current ratio 8,79 11,94<br />
SALES AND MARKETING<br />
Total volume of cargo reloaded in the period I-VI of 2012. totals to<br />
1.380.832 tons, which represents 34% decrease in comparison to the<br />
same period in 2011. when the total volume of reloaded cargo was<br />
2.081.368 t.<br />
Volumes reloaded in period I-VI 2011. and (I-VI) 2012.(in t)<br />
2.400.000<br />
2.000.000<br />
1.600.000<br />
1.200.000<br />
800.000<br />
400.000<br />
0<br />
2.081.368<br />
1.380.832<br />
I-VI 2011. I-VI 2012<br />
Volumes as per the structure of cargo<br />
Volumes as per the type of cargo (in tones)<br />
CARGO TYPE I-VI 2011. I-VI 2012.<br />
Indeks<br />
2012./2011.<br />
General cargoes 210.811 262.578 125<br />
Bulk cargoes 1.649.072 902.098 55<br />
Liquid cargoes 221.485 216.156 98<br />
TOTAL 2.081.368 1.380.832 66
<strong>Luka</strong> <strong>Ploče</strong> Group's Interim Report for the first six months of 2012.<br />
Structure as per the cargo type for period I – VI of 2012.<br />
Bulk cargo<br />
65%<br />
16%<br />
19%<br />
General cargo<br />
Bulk cargo<br />
Liquid cargo<br />
The share of bulk cargo continues to prevail within the structure of the<br />
total volume of cargo and amounts to 65% for the first half of the year<br />
2012. in comparison to 79% achieved in the first six months of the<br />
previous year.<br />
General cargo<br />
Traffic volumes of general cargo reports significant increase by 25%<br />
(262.578 tons in I-VI of 2012. compared to 210.811 tons in I-VI of<br />
2011.). The growth happened in volume of iron and aluminium products,<br />
as well as due to present trend of the occurrence of the new types of<br />
general cargoes (most significant one: segments of the wind power<br />
plants that are assembled on site at the Pelješac peninsula.<br />
Container traffic has increased by 10% in the first half of year 2012.<br />
with reloaded 11.873 TEUs in comparison to 10.805 TEUs reloaded in<br />
the same period of previous year.
<strong>Luka</strong> <strong>Ploče</strong> Group's Interim Report for the first six months of 2012.<br />
Liquid cargo<br />
Cargo traffic volume of liquid cargo in the first half of year 2012. reports<br />
slight decrease in comparison to the same period of the previous year.<br />
Structure of traffic volumes as per various markets<br />
The majority of traffic volumes in the first half of year 2012. relates to<br />
Bosnia and Herzegovina market at the level of 80%. EU market segment<br />
has decreased to 13% due to the termination of the transhipment to Italy,<br />
while the share of domestic market segment within the total cargo traffic<br />
of <strong>Ploče</strong> port is 7%.<br />
80%<br />
7%<br />
13%<br />
EU<br />
CROATIA<br />
BiH
<strong>Luka</strong> <strong>Ploče</strong> Group's Interim Report for the first six months of 2012.<br />
KEY EVENTS IN THE PERIOD I-VI OF YEAR 2012.<br />
The most significant event in the period I-VI of year 2012. is termination<br />
of transhipment services for the client Alpiq Italy.<br />
Company has commenced activities aimed at rationalization of the<br />
business operation and cost optimizing, especially the cost of labour.<br />
The Decision has been brought for preparation of the voluntary<br />
workforce settlement Program for settlement of surplus workforce with<br />
payments of stimulative severances during the year 2012. The Decision<br />
has been made in order to adjust Company’s operation with the present<br />
market conditions, aimed at increasing the efficiency and effectiveness<br />
of the operation.<br />
Workforce downsizing Program shall be applied as the new impetus<br />
within the restructuring of the Company, but with full consideration to<br />
the position of social partners and personal choice of each employee.<br />
Approximately 100 employees of <strong>Luka</strong> <strong>Ploče</strong> Group could be included<br />
by this workforce settlement Program until the end of the year.
RISKS<br />
EXPECTATIONS<br />
<strong>Luka</strong> <strong>Ploče</strong> Group's Interim Report for the first six months of 2012.<br />
Operations of <strong>Luka</strong> <strong>Ploče</strong> Group mainly depends upon the production<br />
and trading of commodities at the global and regional markets. It is<br />
evident that again, after 2008., at the end of y.2011 we have had<br />
significant downfall of import / export and consumption of commodities<br />
in the region, resulting in stagnation and downfall of total volume of<br />
cargoes in comparison to the same period of the previous year. Industrial<br />
production downfall trend, thereby resulting in decrease of cargo<br />
volumes trough <strong>Ploče</strong> port has continued even in the first half of year<br />
2012., effecting negative impact to the total volume of cargoes and<br />
business results of <strong>Luka</strong> <strong>Ploče</strong> company. In view of the uncertainty<br />
reference to the duration of the actual crisis, the total range of effects it<br />
will have to the <strong>Luka</strong> <strong>Ploče</strong> Group is unknown.<br />
Besides the risk of the effects of economic crisis, <strong>Luka</strong> <strong>Ploče</strong> Group<br />
faces the risks of competition on the alternative traffic routes due to<br />
higher transport costs in its hinterland, primarily reference to the railway<br />
transport corridor which is more expensive due to existence of larger<br />
number of railway operator authorities at the same railway transport<br />
corridor, thus preventing <strong>Luka</strong> <strong>Ploče</strong> to compete at markets of Middle<br />
Europe and Serbia, traditional to her.<br />
Any further prolongation of Vc road corridor construction represents the<br />
aggravating circumstance towards the growth of containers traffic.<br />
Operations of the <strong>Luka</strong> <strong>Ploče</strong> in the first half of year 2012. are in visible<br />
downfall in comparison to the same period of the previous year,<br />
resulting from the anticipated regional stagnation and crisis in<br />
production and trading of commodities of interest in the gravitational<br />
hinterland.
<strong>Luka</strong> <strong>Ploče</strong> Group's Interim Report for the first six months of 2012.<br />
It is not possible at this moment to make precise estimation of the actual<br />
duration of the recession that has evidently significantly and adversely<br />
affected our region as well as entire Europe, but the producers- large<br />
multinational companies which are business partners of <strong>Luka</strong> <strong>Ploče</strong><br />
Group will undertake all efforts to retain their production and market<br />
positions and will take actions aimed at intensifying their operations, and<br />
some indications in that respect already exist.<br />
<strong>Ploče</strong>, July 27 th 2012.<br />
__________________<br />
Capt.Ivan Pavlović dipl.ing.<br />
Director<br />
Any clarification may be obtained at:<br />
Investor relations:<br />
Željka Dodig<br />
Tel: 385 20 603 223<br />
Anita Galamboš<br />
Tel: 385 20 603 260<br />
Fax: 385 20 679 103<br />
E-mail: financije@luka-ploce.htnet.hr
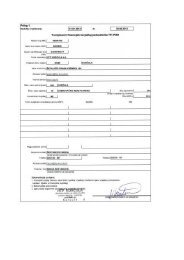
Appendix 1<br />
Reporting period:<br />
Registration number (MB) 03036138<br />
Identification number of subject 0900065233<br />
Personal identification number 5122874907<br />
(OIB)<br />
Issueer company: LUKA PLOČE d.d.<br />
Code and name of comune/town 335 PLOČE<br />
01.01.2012. to 30.06.2012.<br />
Code and county name 19 DUBROVAČKO-NERETVANSKA<br />
Number of employees<br />
(at quarter end)<br />
772<br />
Consolidated statement Yes NKD/NWC code:<br />
5224<br />
Subsidiaries subject to consolidation (according to IFRS):<br />
Quarterly financial report of entrepreneur - TFI-POD<br />
Postal code and place 20340 PLOČE<br />
Street and number TRG KRALJA TOMISLAVA 21<br />
E-mail address: financije@luka-ploce.htnet.hr<br />
Internet adress: www.luka-ploce.hr<br />
LUKA PLOČE TRGOVINA d.o.o. LUČKA CESTA bb, PLOČE<br />
Contact person: DODIG ŽELJKA<br />
(fill in only surname and name of contact person)<br />
Phone number: 020 603 223 Fascimile: 020 679 170<br />
M.P.<br />
Personal identification number (OIB)<br />
18102992360<br />
POMORSKI SERVIS LUKA PLOČE d.o.o. LUČKA BOSANSKA OBALA bb, PLOČE 18875024938<br />
LUKA PLOČE ODRŽAVANJE d.o.o. LUČKA CESTA bb, PLOČE<br />
Disclosure documents:<br />
1. Financial statements (balance sheet, profit and loss account, cash flow statement, statement of changes in<br />
capital and notes to the financial statements<br />
2. Statement of persons responsible for preparation of financial statements<br />
3. Report of the Management Board on position of the Company<br />
87501430734<br />
LUKA ŠPED d.o.o. LUČKA CESTA bb, PLOČE 28527523504<br />
LUKA PLOČE USLUGE d.o.o. LUČKA CESTA bb, PLOČE<br />
PLOČANSKA PLOVIDBA d.o.o.<br />
HLADNJAČA PLOČE d.o.o.<br />
Book keeping service:<br />
E-mail address:<br />
Surname and name PAVLOVIĆ IVAN<br />
(authorised person for representation)<br />
38548671304<br />
LUČKA CESTA bb, PLOČE 39778257122<br />
LUČKA CESTA bb, PLOČE 59501819409<br />
(signed by authorised person for representation)
Item<br />
BALANCE SHEET<br />
as at 30.06.2012.<br />
1<br />
ASSETS<br />
A) RECEIVABLES FOR SUBSCRIBED BUT NOT PAID-IN CAPITAL<br />
B) LONG-TERM ASSETS (003+010+020+029+033)<br />
I. INTANGIBLE ASSETS (004 to 009)<br />
1. Assets development<br />
2. Concessions, patents, licences fees, trade and service marks, software and other rights<br />
3. Goodwill<br />
4. Prepayments for purchase of intangible assets<br />
5. Intangible assets in preparation<br />
6. Other intangible assets<br />
II. TANGIBLE ASSETS (011 to 019)<br />
1. Land<br />
2. Buildings<br />
3. Plant and equipment<br />
4. Tools, facility inventory and transport assets<br />
5. Biological assets<br />
6. Prepayments for tangible assets<br />
7. Tangible assets in progress<br />
8. Other tangible assets<br />
9. Investments in buildings<br />
III. LONG-TERM FINANCIAL ASSETS (021 to 028)<br />
1. Investments (shares) with related parties<br />
2. Loans given to related parties<br />
3. Participating interest (shares)<br />
4. Loans to entrepreneurs in whom the entity holds participating interests<br />
5. Investments in securities<br />
6. Loans, deposits and similar assets<br />
7. Other long - term financial assets<br />
8. Investments accounted by equity method<br />
IV. RECEIVABLES (030 to 032)<br />
1.Receivables from related parties<br />
2. Receivables from based on trade loans<br />
3. Other receivables<br />
V. DEFERRED TAX ASSETS<br />
C) SHORT TERM ASSETS (035+043+050+058)<br />
I. INVENTORIES (036 to 042)<br />
1. Raw-material and supplies<br />
2. Work in progress<br />
3. Finished goods<br />
4. Merchandise<br />
5. Prepayments for inventories<br />
6. Long - term assets held for sales<br />
7. Biological assets<br />
II. RECEIVABLES (044 to 049)<br />
1. Receivables from related parties<br />
2. Accounts receivable<br />
3. Receivables from participating parties<br />
4. Receivables from employees and members of related parties<br />
5. Receivables from government and other institutions<br />
6. Other receivables<br />
III. SHORT TERM FINANCIAL ASSETS (051 to 057)<br />
1. Shares (stocks) in related parties<br />
2. Loans given to related parties<br />
3. Participating interests (shares)<br />
4. Loans to entrepreneurs in whom the entity holds participating interests<br />
5. Investments in securities<br />
6. Loans, deposits, etc.<br />
7. Other financial assets<br />
IV. CASH AT BANK AND IN CASHIER<br />
D) PREPAID EXPENSES AND ACCRUED REVENUE<br />
E) TOTAL ASSETS (001+002+034+059)<br />
F) OFF-BALANCE RECORDS<br />
AOP<br />
code<br />
Last year (net) Current year<br />
(net)<br />
2 3 4<br />
001<br />
002 171.889.882 168.625.256<br />
003 0 0<br />
004<br />
005<br />
006<br />
007<br />
008<br />
009<br />
010 166.948.155 163.507.908<br />
011 2.138.881 2.138.881<br />
012 22.724.113 22.395.047<br />
013 102.876.850 96.904.483<br />
014 8.743.882 7.761.023<br />
015<br />
016 714.668 153.243<br />
017 24.435.147 28.889.226<br />
018<br />
019 5.314.614 5.266.005<br />
020 822.404 973.792<br />
021 79.500 79.500<br />
022<br />
023 29.400<br />
024<br />
025<br />
026 362.904 387.953<br />
027 380.000 476.939<br />
028<br />
029 4.119.323 4.143.556<br />
030 0<br />
031 4.119.323 4.119.323<br />
032 24.233<br />
033<br />
034 321.185.775 324.645.585<br />
035 3.303.944 3.211.146<br />
036 3.130.818 3.006.748<br />
037<br />
038<br />
039 103.971 204.206<br />
040 69.155 192<br />
041<br />
042<br />
043 35.809.949 39.299.470<br />
044<br />
045 33.817.122 31.604.946<br />
046 73.199<br />
047 1.755 13.928<br />
048 991.955 1.127.592<br />
049 999.117 6.479.805<br />
050 246.807.093 256.868.049<br />
051<br />
052<br />
053 275.388 275.388<br />
054<br />
055<br />
056 246.531.705 256.592.423<br />
057 238<br />
058 35.264.789 25.266.920<br />
059 160.744<br />
060 493.075.657 493.431.585<br />
061
Item<br />
1<br />
LIABILITIES AND CAPITAL<br />
A) CAPITAL AND RESERVES (063+064+065+071+072+075+078)<br />
I. SUBSCRIBED CAPITAL<br />
II. CAPITAL RESERVES<br />
III.RESERVES FROM PROFIT (066+067-068+069+070)<br />
1. Reserves prescribed by low<br />
2. Reserves for treasury shares<br />
3. Treasury stocks and shares (deduction)<br />
4. Statutory reserves<br />
5. Other reserves<br />
IV. REVALUATION RESERVES<br />
V. RETAINED EARNINGS OR ACCUMULATED LOSS (073-074)<br />
1. Retained earnings<br />
2. Accumulated loss<br />
VI. PROFIT/LOSS FOR THE CURRENT YEAR (076-077)<br />
1. Profit for the current year<br />
2. Loss for the current year<br />
IX. MINORITY INTERESTS<br />
B) PROVISIONS (080 to 082)<br />
1. Provisions for pensions, severance pay, and similar liabilities<br />
2. Reserves for tax liabilities<br />
3. Other reserves<br />
C) LONG - TERM LIABILITIES (084 to 092)<br />
1. Liabilities to related parties<br />
2. Liabilities for loans, deposits etc.<br />
3. Liabilities to banks and other financial institutions<br />
4. Liabilities for received prepayments<br />
5. Accounts payable<br />
6. Liabilities arising from debt securities<br />
7. Liabilities to entrepreneurs in whom the entity holds participating interests<br />
8. Other long-term liabilities<br />
9. Deferred tax liability<br />
D) SHORT - TERM LIABILITIES (094 to 105)<br />
1. Liabilities to related parties<br />
2. Liabilities for loans, deposits etc.<br />
3. Liabilities to banks and other financial institutions<br />
4. Liabilities for received prepayments<br />
5. Accounts payable<br />
6. Liabilities arising from debt securities<br />
7. Liabilities to entrepreneurs in whom the entity holds participating interests<br />
8. Liabilities to employees<br />
9. Liabilities for taxes, contributions and similar fees<br />
10. Liabilities to share - holders<br />
11. Liabilities for long-term assets held for sale<br />
12. Other short - term liabilities<br />
E) DEFFERED SETTLEMENTS OF CHARGES AND INCOME DEFERRED TO FUTURE PERIOD<br />
F) TOTAL – CAPITAL AND LIABILITIES (062+079+083+093+106)<br />
G) OFF-BALANCE RECORDS<br />
AOP<br />
code<br />
Last year (net) Current year<br />
(net)<br />
2 3 4<br />
062 402.929.716 410.479.339<br />
063 169.186.800 169.186.800<br />
064 88.107.087 88.107.087<br />
065 37.033.109 38.319.410<br />
066 4.157.437 5.443.738<br />
067<br />
068<br />
069<br />
8.624.617 8.624.617<br />
070<br />
071<br />
24.251.055 24.251.055<br />
072 81.144.391 107.428.297<br />
073<br />
074<br />
81.144.391 107.428.297<br />
075 27.101.031 7.229.993<br />
076<br />
077<br />
27.101.031 7.229.993<br />
078 357.298 207.752<br />
079 7.396.000 8.456.775<br />
080<br />
081<br />
4.136.000 4.136.000<br />
082 3.260.000 4.320.775<br />
083<br />
084<br />
085<br />
46.019.456 47.141.461<br />
086 43.334.823 43.097.043<br />
087<br />
088<br />
089<br />
090<br />
1.359.785<br />
091<br />
092<br />
2.684.633 2.684.633<br />
093<br />
094<br />
095<br />
36.534.856 27.174.979<br />
096 11.109.384 7.330.524<br />
097 176.197<br />
098<br />
099<br />
6.458.384 4.864.008<br />
100 1.869.381 1.466.787<br />
101 4.259.926 3.999.335<br />
102<br />
103<br />
6.812.406 5.150.691<br />
104 3.366<br />
105 6.025.375 4.184.071<br />
106 195.629 179.031<br />
107<br />
108<br />
493.075.657 493.431.585<br />
APPENDIX to balance sheet(to be filled in by entrepreneur that prepares consolidated annual financial report)<br />
CAPITAL AND RESERVES<br />
1. Attributed to equity holders of parent company<br />
109 402.572.418 410.271.587<br />
2. Attributed to minority interest<br />
110 357.298 207.752
PROFIT AND LOSS ACCOUNT<br />
for the period 01.01.2012. to 30.06.2012.<br />
Item<br />
AOP<br />
code<br />
Last year Current year<br />
Comulative Quartely Comulative Quartely<br />
1<br />
2 3 4 5 6<br />
I. OPERATING REVENUE (112+113)<br />
111 72.200.415 34.841.018 64.341.484 31.689.998<br />
1. Sales revenue<br />
112 71.691.218 34.834.962 61.644.117 31.689.998<br />
2. Other operating revenues<br />
113 509.197 6.056 2.697.367<br />
II. OPERATING EXPENSES (115+116+120+124+125+126+129+130)<br />
114 66.929.863 34.517.743 63.045.761 31.411.901<br />
1. Changes in value of work in progress and finished products<br />
115<br />
2. Material costs (117 to 119)<br />
116 18.171.525 9.370.241 14.705.219 7.266.743<br />
a) Raw material and material costs<br />
117 9.347.273 4.240.542 7.255.545 2.756.003<br />
b) Costs of goods sold<br />
118<br />
c) Other external costs<br />
119 8.824.252 5.129.699 7.449.674 4.510.740<br />
3. Staff costs (121 to 123)<br />
120 35.021.407 17.131.591 34.072.952 16.877.542<br />
a) Net salaries and wages<br />
121 22.077.795 10.946.599 21.871.554 10.915.122<br />
b) Cost for taxes and contributions from salaries<br />
122 7.658.305 3.644.956 7.330.392 3.613.069<br />
c) Contributions on gross salaries<br />
123 5.285.307 2.540.036 4.871.006 2.349.351<br />
4. Depreciation<br />
124 6.090.316 3.060.165 6.516.925 3.218.001<br />
5. Other costs<br />
125 7.144.006 4.649.992 6.643.933 2.973.355<br />
6. Impairment (127+128)<br />
126 84.926 84.926 873.052 873.052<br />
a) Impairment of long-term assets (financial assets excluded)<br />
127<br />
b) Impairment of short - term assets (financial assets excluded)<br />
128 84.926 84.926 873.052 873.052<br />
7. Provisions<br />
129<br />
8. Other operating costs<br />
130 417.683 220.828 233.680 203.208<br />
III. FINANCIAL INCOME (132 to 136)<br />
131 695.703 292.699 6.740.970 6.677.800<br />
1. Interest income, foreign exchange gains, dividends and similar income from related 132<br />
2. Interest income, foreign exchange gains, dividends and similar income from non -<br />
133 695.703 292.699 6.740.970 6.677.800<br />
3. Share in income from affiliated entrepreneurs and participating interests<br />
134<br />
4. Unrealized gains (income) from financial assets<br />
135<br />
5. Other financial income<br />
136<br />
IV. FINANCIAL EXPENSES (138 do 141)<br />
137 1.201.407 399.912 956.325 330.798<br />
1. Interest expenses, foreign exchange losses, dividends and similar expenses from related 138<br />
2. Interest expenses, foreign exchange losses, dividends and similar expenses from non - 139 1.201.407 399.912 956.325 330.798<br />
3. Unrealized losses (expenses) on financial assets<br />
140<br />
4. Other financial expenses<br />
141<br />
V. INCOME FROM INVESTMENT - SHARE IN PROFIT OF ASSOCIATED ENTREPRENEURS 142<br />
VI. LOSS FROM INVESTMENT - SHARE IN LOSS OF ASSOCIATED ENTREPRENEURS<br />
143<br />
VII. EXTRAORDINARY - OTHER INCOME<br />
144<br />
VIII. EXTRAORDINARY - OTHER EXPENSES<br />
145<br />
IX. TOTAL INCOME (111+131+142 + 144)<br />
146 72.896.118 35.133.717 71.082.454 38.367.798<br />
X. TOTAL EXPENSES (114+137+143 + 145)<br />
147 68.131.270 34.917.655 64.002.086 31.742.699<br />
XI. PROFIT OR LOSS BEFORE TAXATION (146-147)<br />
148 4.764.848 216.062 7.080.368 6.625.099<br />
1. Profit before taxation (146-147)<br />
149 4.764.848 216.062 7.080.368 6.625.099<br />
2. Loss before taxation (147-146)<br />
150 0 0 0 0<br />
XII. PROFIT TAX<br />
151<br />
XIII. PROFIT OR LOSS FOR THE PERIOD (148-151)<br />
152 4.764.848 216.062 7.080.368 6.625.099<br />
1. Profit for the period (149-151)<br />
153 4.764.848 216.062 7.080.368 6.625.099<br />
2. Loss for the period (151-148)<br />
154 0 0 0 0<br />
APPENDIX to P&L account (to be filled in by entrepreneur that prepares consolidated financial report)<br />
XIV. PROFIT OR LOSS FOR THE PERIOD<br />
1. Attributed to equity holders of parent company<br />
155 4.775.368 226.582 7.229.993 6.774.724<br />
2. Attributed to minority interest<br />
STATEMENT OF OTHER COMPREHENSIVE INCOME (IFRS)<br />
156 -10.520 -10.520 -149.625 -149.625<br />
I. PROFIT OR LOSS FOR THE PERIOD (= 152)<br />
157 4.764.848 216.062 7.080.368 6.625.099<br />
II. OTHER COMPREHENSIVE INCOME / LOSS BEFORE TAX (159 do 165)<br />
158 0 0 0 0<br />
1. Exchange differences on translation of foreign operations<br />
159<br />
2. Movements in revaluation reserves of long - term tangible and intangible assets<br />
160<br />
3. Profit or loss from reevaluation of financial assets available for sale<br />
161<br />
4. Gains or losses on efficient cash flow hedging<br />
162<br />
5. Gains or losses on efficient hedge of a net investment in foreign countries<br />
163<br />
6. Share in other comprehensive income / loss of associated companies<br />
164<br />
7. Actuarial gains / losses on defined benefit plans<br />
165<br />
III. TAX ON OTHER COMPREHENSIVE INCOME FOR THE PERIOD<br />
166<br />
IV. NET OTHER COMPREHENSIVE INCOME OR LOSS FOR THE PERIOD (158-166)<br />
167 0 0 0 0<br />
V. COMPREHENSIVE INCOME OR LOSS FOR THE PERIOD (157+167)<br />
168 4.764.848 216.062 7.080.368 6.625.099<br />
APPENDIX to Statement of other comprenhensive income (to be filled in by entrepreneur that prepares consolidated financial report)<br />
VI. COMPREHENSIVE INCOME OR LOSS FOR THE PERIOD<br />
1. Attributed to equity holders of parent company<br />
169<br />
2. Attributed to minority interest<br />
170
STATEMENT OF CASH FLOWS - INDIRECT METHOD<br />
for the period 01.01.2012. to 30.06.2012.<br />
Item<br />
1<br />
CASH FLOW FROM OPERATING ACTIVITIES<br />
1. Profit before tax<br />
2. Depreciation<br />
3. Increase in short term liabilities<br />
4. Decrease in short term receivables<br />
5. Decrease in inventories<br />
6. Other increase in cash flow<br />
I. Total increase in cash flow from operating activities (001 to 006)<br />
1. Decrease in short term liabilities<br />
2. Increase in short term receivables<br />
3. Increase in inventories<br />
4. Other decrease in cash flow<br />
II. Total decrease in cash flow from operating activities (008 to 011)<br />
A1) NET INCREASE IN CASH FLOW FROM OPERATING ACTIVITIES<br />
A2) NET DECREASE IN IN CASH FLOW FROM OPERATING ACTIVITIES<br />
CASH FLOW FROM INVESTING ACTIVITIES<br />
1. Cash inflows from sales of long-term tangible and intangible assets<br />
2. Cash inflows from sales of equity and debt instruments<br />
3. Interests receipts<br />
4. Dividend receipts<br />
5. Other cash inflows from investing activities<br />
III. Total cash inflows from investing activities (015 to 019)<br />
1. Cash outflow for purchase of long-term tangible and intangible assets<br />
2. Cash outflow for acquisition of equity and debt financial instruments<br />
3. Other cash outflow for investing activities<br />
IV. Total cash outflow for investing activities (021 do 023)<br />
B1) NET INCREASE IN CASH FLOW FROM INVESTING ACTIVITIES (020-024)<br />
B2) NET DECREASE IN CASH FLOW FROM INVESTING ACTIVITIES<br />
CASH FLOW FROM FINANCIAL ACTIVITIES<br />
1. Cash inflow from issuing property and debt financial instruments<br />
2. Proceeds from the credit principal, promissory notes, borrowings and other loans<br />
3. Other proceeds from financial activities<br />
V. Total cash inflows from financial activities (027 to 029)<br />
1. Cash outflow for repayment of credit principal and bonds<br />
2. Cash outflow for dividends paid<br />
3. Cash outflow for financial lease<br />
4. Cash outflow for purchase of treasury shares<br />
5. Other cash outflow for financial activities<br />
VI. Total cash outflow for financial activities (031 to 035)<br />
C1) NET INCREASE IN CASH FLOW FROM FINANCIAL ACTIVITIES<br />
C2) NET DECREASE IN CASH FLOW FROM FINANCIAL ACTIVITIES<br />
Total increase in cash flow (013 – 014 + 025 – 026 + 037 – 038)<br />
Total decrease in cash flow (014 – 013 + 026 – 025 + 038 – 037)<br />
Cash and cash equivalents at the beginning of the period<br />
Increase of cash and cash equivalents<br />
Decrease of cash and cash equivalents<br />
Cash and cash equivalents at the end of the period<br />
AOP<br />
code<br />
Last year Current year<br />
2 3 4<br />
001 4.764.848 7.080.368<br />
002 6.090.316 6.516.925<br />
003<br />
004 3.029.593<br />
005 124.070<br />
006 2.414.557<br />
007 16.299.314 13.721.363<br />
008 2.544.829 5.581.017<br />
009 3.489.759<br />
010 91.875<br />
011 321.942 2.477.292<br />
012 2.958.646 11.548.068<br />
013 13.340.668 2.173.295<br />
014 0 0<br />
015 2.998.769<br />
016<br />
017<br />
018<br />
019<br />
020 0 2.998.769<br />
021 26.654.709 13.799.461<br />
022<br />
023<br />
024 26.654.709 13.799.461<br />
025 0 0<br />
026 26.654.709 10.800.692<br />
027<br />
028 12.846.372 1.212.743<br />
029<br />
030 12.846.372 1.212.743<br />
031 1.887.114 988.839<br />
032<br />
033 1.594.376<br />
034<br />
035 450.000<br />
036 2.337.114 2.583.215<br />
037 10.509.258 0<br />
038 0 1.370.472<br />
039 0 0<br />
040 2.804.783 9.997.869<br />
041 76.063.521 35.264.789<br />
042<br />
043 2.804.783 9.997.869<br />
044 73.258.738 25.266.920
STATEMENT OF CHANGES IN EQUITY<br />
for the period 1.1.2012 to 30.6.2012<br />
Item<br />
1<br />
1. Subscribed capital<br />
2. Capital reserves<br />
3. Reserves from profit<br />
4. Retained earnings or accumulated loss<br />
5. Profit or loss for the current year<br />
6. Revaluation of long - term tangible assets<br />
7. Revaluation of intangible assets<br />
8. Revaluation of financial assets available for sale<br />
9. Other revaluation<br />
10. Total capital and reserves (AOP 001 do 009)<br />
11. Currency gains and losses arising from net investement in foreign operations<br />
12. Current and deferred taxes (part)<br />
13. Cash flow hedging<br />
14. Changes in accounting policy<br />
15. Correction of significant errors in prior period<br />
16. Other changes of capital<br />
17. Total increase or decrease in capital (AOP 011 do 016)<br />
17 a. Attributed to equity holders of parent company<br />
17 b. Attributed to minority interest<br />
AOP<br />
code<br />
Last year Current year<br />
2 3 4<br />
001 169.186.800 169.186.800<br />
002 88.107.087 88.107.087<br />
003 37.033.109 38.319.410<br />
004 81.975.693 107.785.674<br />
005<br />
006<br />
007<br />
008<br />
009<br />
26.627.027 7.080.368<br />
010<br />
011<br />
012<br />
013<br />
014<br />
015<br />
016<br />
402.929.716 410.479.339<br />
017 0 0<br />
018 402.572.418 410.271.587<br />
019 357.298 207.752
Notes to financial statements
Pursuant to the article 410. of the Capital market Law (Official Gazette 88/08. and 146/08) the<br />
President of the Management board of <strong>Luka</strong> <strong>Ploče</strong> d.d. provides<br />
MANAGEMENT BOARD'S STATEMENT OF LIABILITY<br />
Financial statements of the <strong>Luka</strong> <strong>Ploče</strong> Group have been prepared pursuant to the International<br />
Financial Reporting Standards (IFRS) and Accounting Law.<br />
The financial statements for the period from January 01 st to June 30 th 2012. represent complete<br />
and fair view of assets and liabilities, profit and loss, financial position and operations of the <strong>Luka</strong><br />
<strong>Ploče</strong> Group.<br />
Capt. Ivan Pavlović<br />
_______________________________<br />
President of the Management Board